A unified model for interpretable latent embedding of multi-sample, multi-condition single-cell data
Published in Protocols & Methods and Genetics & Genomics
I remember that one of the first articles shared with me by my supervisor, Dr. Hamed S. Najafabadi, was the PLIER paper1. This work demonstrates how to incorporate prior information from various gene sets, for example, pathways or gene-regulatory networks, to provide interpretability to the latent factors obtained from gene-expression analysis. Inspired by this, we wanted to extend some of these ideas to the analysis of single cell RNA-seq data, but we soon realized that multiple challenges lay ahead.
One of these obstacles is the presence of technical or biological variability among samples, as shown by several groups that developed computational methods for the integration of single-cell RNA-seq data2,3. Although integration was possible, we realized that applying it impacted other analyses, such as the estimation of pathway activities. This influence could also be seen in other downstream tasks, for example, differential expression across conditions involves integration and cell type/cluster identification, but their interplay is typically ignored, and the analysis is limited to the discrete clusters identified. We reasoned that having a model that could unify these multiple concepts and perform all these tasks in a single step could be useful, and that is how Gene Expression Decomposition and Integration (GEDI) was born!

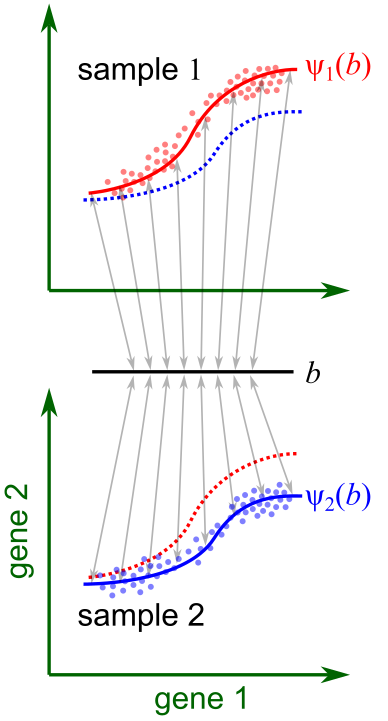
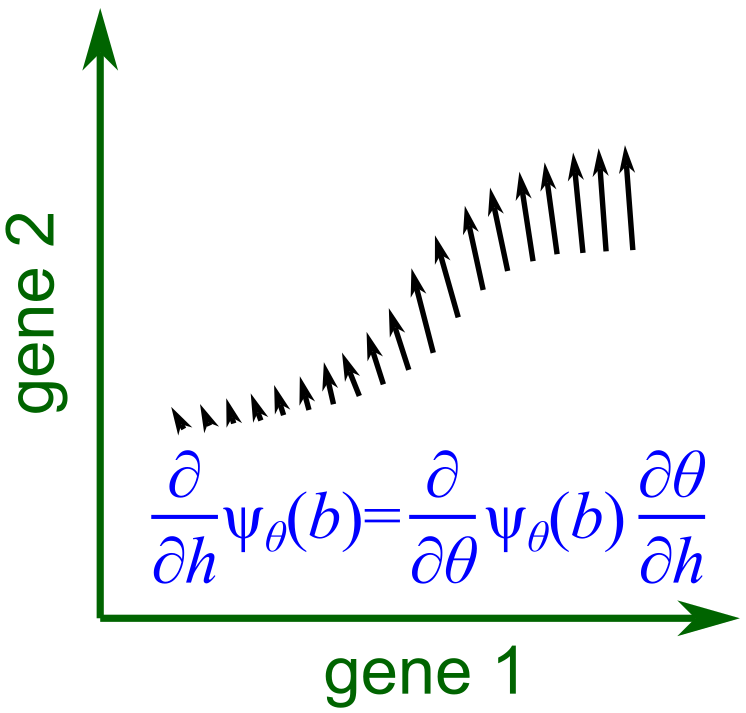
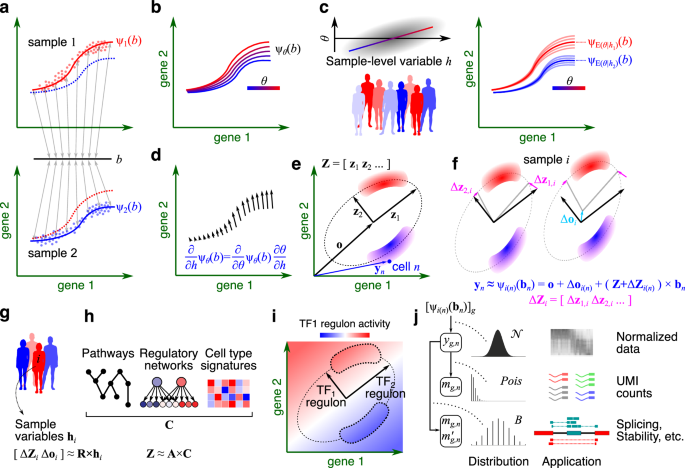
Our work starts from the premise that in a multi-sample, multi-condition single-cell dataset, cells are embedded in manifolds that can vary across samples due to technical or biological variations (Fig. 1). In GEDI, the gene expression manifold of each sample is modeled as a hyperplane or hyperellipsoid, defined by a reference set of principal axes and sample-specific transformations of these axes. The variations to the reference frame can be expressed as a probabilistic function of sample-level variables, such as a change in disease status. This formulation enables us to quantify how changes in sample-level covariates influence the gene expression of any given cell state, leading to a transcriptomic vector field for a sample-level variable (Fig. 2).

Fig. 2. The derivative of ψ with respect to the sample-level variable h forms a vector field, representing the change in expression of each cell at the biological state b as h changes (differential expression).
The reference set of principal axes can also be expressed as a probabilistic function of gene-level variables, such as gene-set membership of pathways, cell signatures and regulatory factor targets, providing interpretability to the axes identified. If using prior information about regulatory networks, GEDI can calculate the activity gradient of regulatory factors and compare them to the transcriptomic vector fields of sample-level variables.
In the paper, we illustrate the different capabilities of GEDI. Using different datasets, we show that GEDI can capture biological or technical variability and is competitive with other top-performing integration tools. When analyzing a single-cell atlas of PBMCs that include healthy individuals as well as mild and severe COVID-19 cases, GEDI performs cluster-free differential gene expression analysis along the continuum of cell states, obtaining a transcriptomic vector field that describes the differences between COVID-19 and healthy individuals. When also including prior information about gene regulatory networks, GEDI identifies transcription factors whose activity gradient is in the same direction as the transcriptomic vector of COVID-19 in specific cell subpopulations.
Finally, we showcase that GEDI can also be applied to modalities where the biological quantity of interest is a ratio between two observations, such as splicing or mRNA stability. This capability allows us to perform the analyses described above, including dimensionality reduction, sample harmonization, and gene-regulatory network analysis on the latent space of ratio-based modalities.
To learn more about these and other results, you can find the paper here: https://www.nature.com/articles/s41467-024-50963-0
And you can find GEDI here: https://github.com/csglab/GEDI/tree/main
References:
- Mao, W., Zaslavsky, E., Hartmann, B. M., Sealfon, S. C., & Chikina, M. (2019). Pathway-level information extractor (PLIER) for gene expression data. Nature methods, 16(7), 607-610.
- Butler, A., Hoffman, P., Smibert, P., Papalexi, E., & Satija, R. (2018). Integrating single-cell transcriptomic data across different conditions, technologies, and species. Nature biotechnology, 36(5), 411-420.
- Haghverdi, L., Lun, A. T., Morgan, M. D., & Marioni, J. C. (2018). Batch effects in single-cell RNA-sequencing data are corrected by matching mutual nearest neighbors. Nature biotechnology, 36(5), 421-427.
Follow the Topic
-
Nature Communications

An open access, multidisciplinary journal dedicated to publishing high-quality research in all areas of the biological, health, physical, chemical and Earth sciences.
Related Collections
With Collections, you can get published faster and increase your visibility.
Women's Health
Publishing Model: Hybrid
Deadline: Ongoing
Advances in neurodegenerative diseases
Publishing Model: Hybrid
Deadline: Mar 24, 2026


Please sign in or register for FREE
If you are a registered user on Research Communities by Springer Nature, please sign in