Are COVID-19 case or death counts better for tracking the pandemic?
Published in Healthcare & Nursing
Responding to an ongoing pandemic is difficult. Policymakers and public health officials must often make complex decisions from noisy data. Parameters such as the effective reproduction number, often referred to as R, are important to informing this decision-making process. R is a key measure of disease transmission. An R>1 means that the epidemic is growing while R<1 suggests that infections are under control. Estimating R reliably requires knowing the infections across time i.e., the epidemic curve. Unfortunately, we almost never have access to the true number of infections and necessarily imperfect proxies must be used.
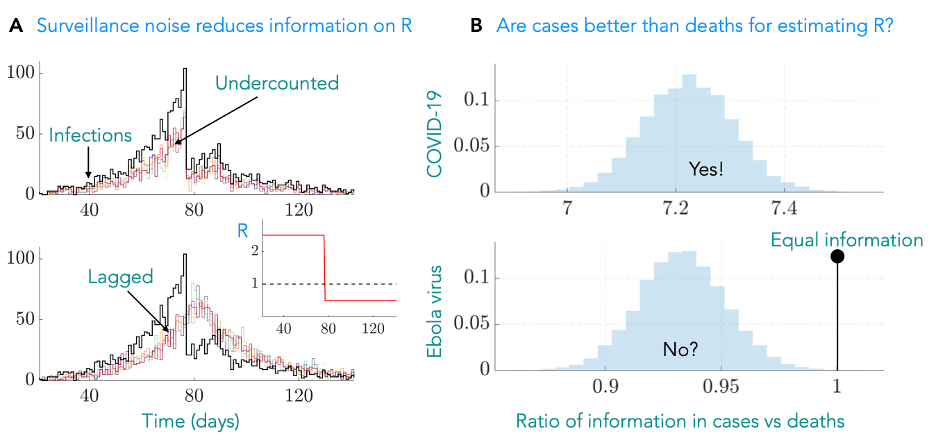
There are two proxies of particular importance: counts of the number of deaths, mortality data, and counts of the number of confirmed infections, case data. While these may appear sensible measures of the epidemic curve, they can misrepresent transmission in multiple ways. While mortality data are often largely complete i.e., it includes most of the relevant deaths, it can lag behind the current infections substantially. Further, since it captures an extreme outcome, its counts are (often) substantially lower than the number of infections. Confirmed cases are timely but the proportion of cases that have been undercounted is difficult to ascertain and varies over time. Undercounting and lags, as in Fig 1A, can reduce the reliability of our estimates of R.

Figure 1: (A) True infections (black) can be undercounted (top) or suffer lags due to limits on our capacity for surveillance. These forms of noise mean that we cannot distinguish among any of the multiple proxy curves that are plotted and hamper our ability to infer R (inset), which provides actionable insight into transmission. (B) We developed an information metric that quantifies how noise due to effects such as lags and undercounting limit our ability to reliably estimate R. We tested this on case and mortality data asking the question – which is more informative? For COVID-19 we find that cases are significantly better (the ratio of our metrics is much larger than 1) whereas for Ebola virus they offer more similar information content. The COVID-19 result contrasts a common heuristic that death data are better for inferring R. We show histograms as we computed metrics over many possible noisy proxies.
This project came about as an attempt to answer a simple question: which data source is better (more informative) for tracking R across the COVID-19 pandemic? While several methods for modelling incomplete and lagged epidemic curves exist, there was surprisingly little guidance on selecting a dataset in the first place and no general means of assessing its quality. Further, there seemed to be an untested but reasonable assumption that mortality data were necessarily of better quality because of how cases undercount infections. Given its implications on policy, we wanted an objective way to assess the quality of data to quantify its influence on R.
We turned to information theory, which provides a mathematical framework for describing how much information data contain. Combining this with experimental design theory, we developed a measure of how different sources of noise reduce the information in epidemic curves and impact our estimates of R from proxies. This enabled us to answer the question of which data type was better in a systematic way, not just for COVID-19, but for any epidemic provided we know some basic facts about the disease and the way in which the data are collected. We used this approach to quantify the influence of lags and undercounting in mortality and case data and concluded, in contrast to convention, that there were few instances in which death counts are better.
We described this with an information ratio, as in Fig1B, which when above 1 indicates that cases are likely more informative. Our approach highlighted that because the rate at which infections cause mortality is approximately 1%, we are losing the vast majority of information available to estimate R. The strength of this effect dominates the influences of the time-varying undercounting of cases and hence contradicts the commonly held assumption for COVID-19. In contrast, since Ebola virus disease has a much larger fatality rate, the comparison is much closer, with death data marginally outperforming case data as a reliable source for estimating R.
The approach we developed is another step towards integrating the ideas from information theory into mathematical epidemiology. Epidemic modelling attempts to reduce a complex transmission process into the fundamental details that can help us to summarise and effectively respond to an outbreak. The art of mathematical modelling is deciding which details are necessary and which can safely be ignored for decision-making. Frameworks like ours make the link between data quality and choice of details more explicit and rigorous, in the hope of improving the understanding of how practical epidemic data can be more reliably used to inform public health policy.
Based on: Parag KV, Donnelly CA, Zarebski AE. Quantifying the information in noisy epidemic curves. Nat Comput Sci 2, 584–594 (2022).
Follow the Topic
-
Nature Computational Science

A multidisciplinary journal that focuses on the development and use of computational techniques and mathematical models, as well as their application to address complex problems across a range of scientific disciplines.
Related Collections
With Collections, you can get published faster and increase your visibility.
Physics-Informed Machine Learning
Publishing Model: Hybrid
Deadline: May 31, 2026


Please sign in or register for FREE
If you are a registered user on Research Communities by Springer Nature, please sign in