Behind the paper: COVID-19 reduced diverse urban interactions
Published in Social Sciences

In our new paper published in Nature Communications "Behavioral changes during the COVID-19 pandemic decreased income diversity of urban encounters", we take a deep dive into how and why our urban encounters have changed during the different parts of the pandemic.
The key insights are highlighted in an interview article published by MIT News, and also please take a look at our paper if you're interested in the details!
In this Behind the Paper blog, rather than going into the details of the study, we will focus on sharing our story about how this research started, how it progressed, and the path it took until publication.
Inspiration
The core idea of the study was inspired by a previous article published in Nature Communications by Professors Esteban Moro at MIT and UC3M, Xiaowen Dong at Oxford, and Alex ‘Sandy’ Pentland at MIT (who are also co-authors of this paper), which looks at the income segregation of urban encounters in 10 cities in the US using mobile phone data. Moro et al. found that around 55% of the variance in experienced income segregation could be explained by where people go, not by where people live.
There were many studies looking at how human mobility and behavioral patterns have changed during the pandemic using mobile phone data, showing how people's activities decreased/changed during lockdowns, how people started to spend more time around their neighborhood, and also how the dynamic patterns are correlated with the number of COVID-19 cases.
We wanted to take a step further than understanding the dynamics, and to measure the impacts of mobility reduction and behavioral change on social connections and interactions in cities, which are known to be important for social capital, resilience, and social capital.
Interesting and surprising results
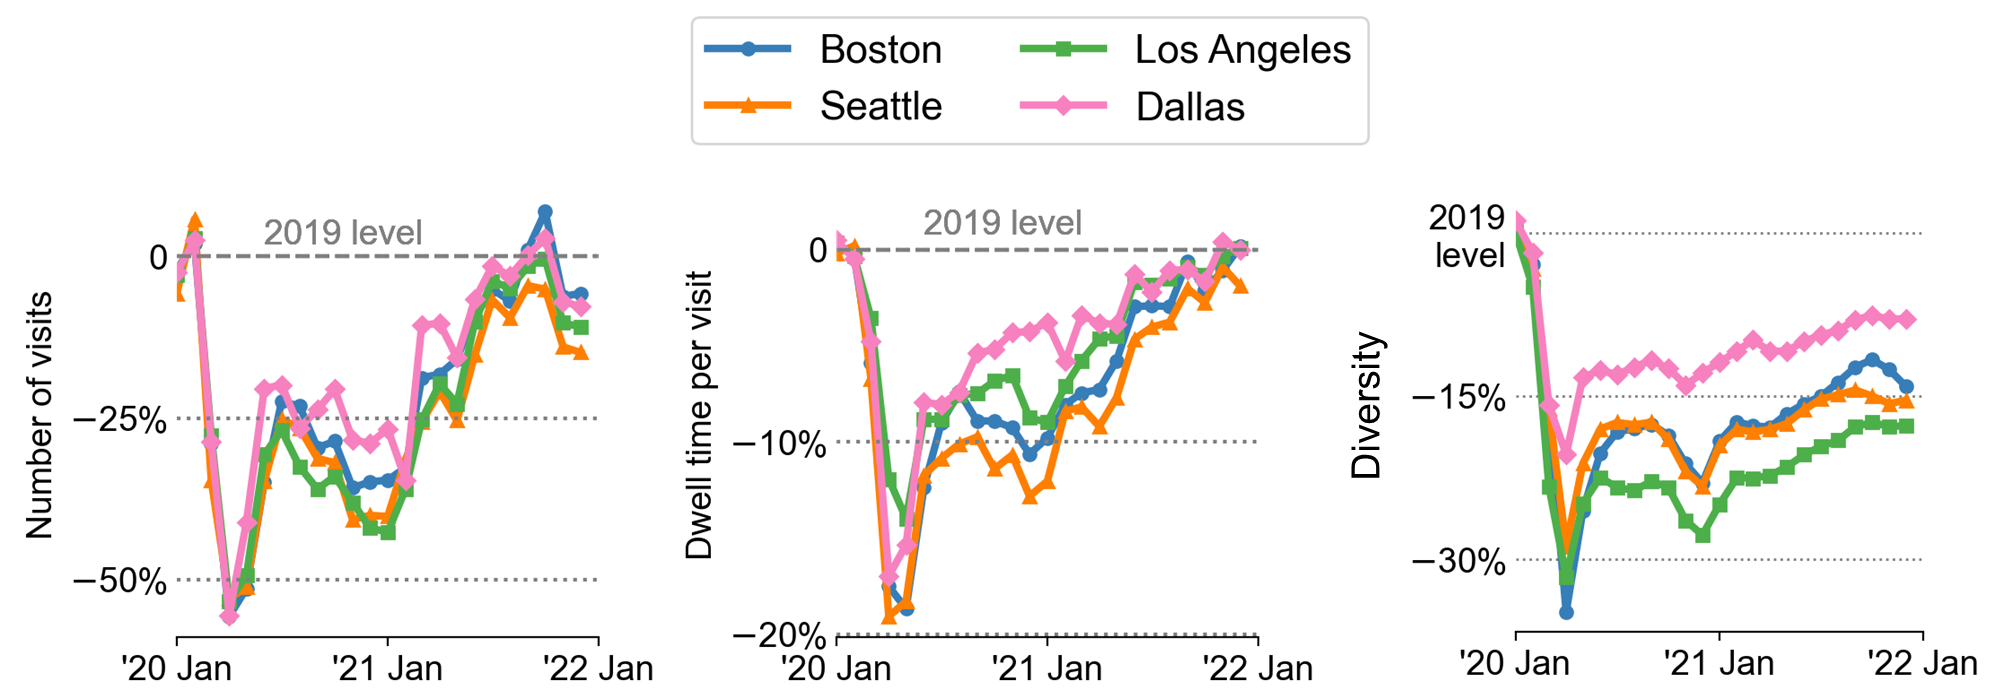
We first started by analyzing how the diversity of urban encounters changed over time, between 2019 January and 2021 December. Our hypothesis was that diversity has decreased, because of less activities overall, shorter trip lengths, and disproportionate drops in activities among the higher-income groups. We were right, income diversity decreased by almost 35% during the lockdowns and the reduction also was observed outside the lockdown periods.
What surprised us was, even in late 2021, when the quantity of mobility metrics (e.g., average number of visits to places per day, average dwell time at places per visit) have recovered back to normal, we still observed a 15% reduction in the income diversity of encounters!

Diving into the ‘Why?’ – Counterfactual analysis
The obvious next question was, why has diversity gone down by at least 15% even when people have resumed activities in cities? The majority of the time in this project was dedicated to getting to the bottom of this question, and we’re very glad we spent the time and collective effort to tackle this challenge.
Answering the “why” requires to isolate the fundamental reasons behind the decrease of diversity. But there were many other things happening at the same time: lockdowns, recovery, different COVID-19 waves, vaccination, etc. To quantify the impact of behavioral changes on decreased diversity, we wanted to identify the fraction of that decrease that was only due to profound shifts in human behavior, not city-wide or even nation-wide policies.
The idea came through during one meeting among the authors, when we ran a simple experiment: ‘how much diversity would a place lose if the number of visits decreased by half?' Of course, we cannot make those experiments in real life, but the comparison with pre-COVID19 gave us the idea. We could use data from pre-pandemic (2019) data to simulate a synthetic counterfactual. The results were striking – a place’s diversity, on average, decreases monotonically as the number of visits decrease.
We realized that by conducting this simulation for all places, we could answer the question: ‘how much diversity would cities lose just due to reduction in mobility?’, and soon after, we tested different counterfactual scenarios, like ‘what if people reduced their mobility patterns disproportionately by income quartiles (i.e., higher-income people reducing more than lower-income) from 2019 levels?’
This aha! moment allowed us to quantify why diversity decreased – and led to the finding that in late 2021, most of the reduction in diversity was due to microscopic behavioral changes, for example, more routine behavior (e.g., more visits to grocery and less to gyms, spas) and less 'social exploration' in cities.
This counterfactual approach is applicable to many other problems using behavioral data. We are excited to see applications of this in the use of mobility data and in other domains and research questions!

Robustness checks – data representativeness, parameters, POI datasets
After we obtained the main findings of the paper, we asked many critical questions to ourselves – maybe the results were due to the biases in mobility data? Maybe the parameters used to analyze the mobility data were giving fluke results? Maybe the places dataset (Foursquare data) was biased in some way? Does the conclusion hold when we use different ways to measure ‘diversity’?
These are important questions that are unfortunately not addressed so commonly in studies of big data. Having a large dataset of movements in the city does not equal having a representative description of all demographic groups and behavior. That is why we are very proud of the Supplementary Information which contains a very detailed, over 60-page robustness analysis of our main results from many angles. I would suggest readers take a look at the SI when they have any questions about the study – I hope you can find an answer somewhere in the SI.
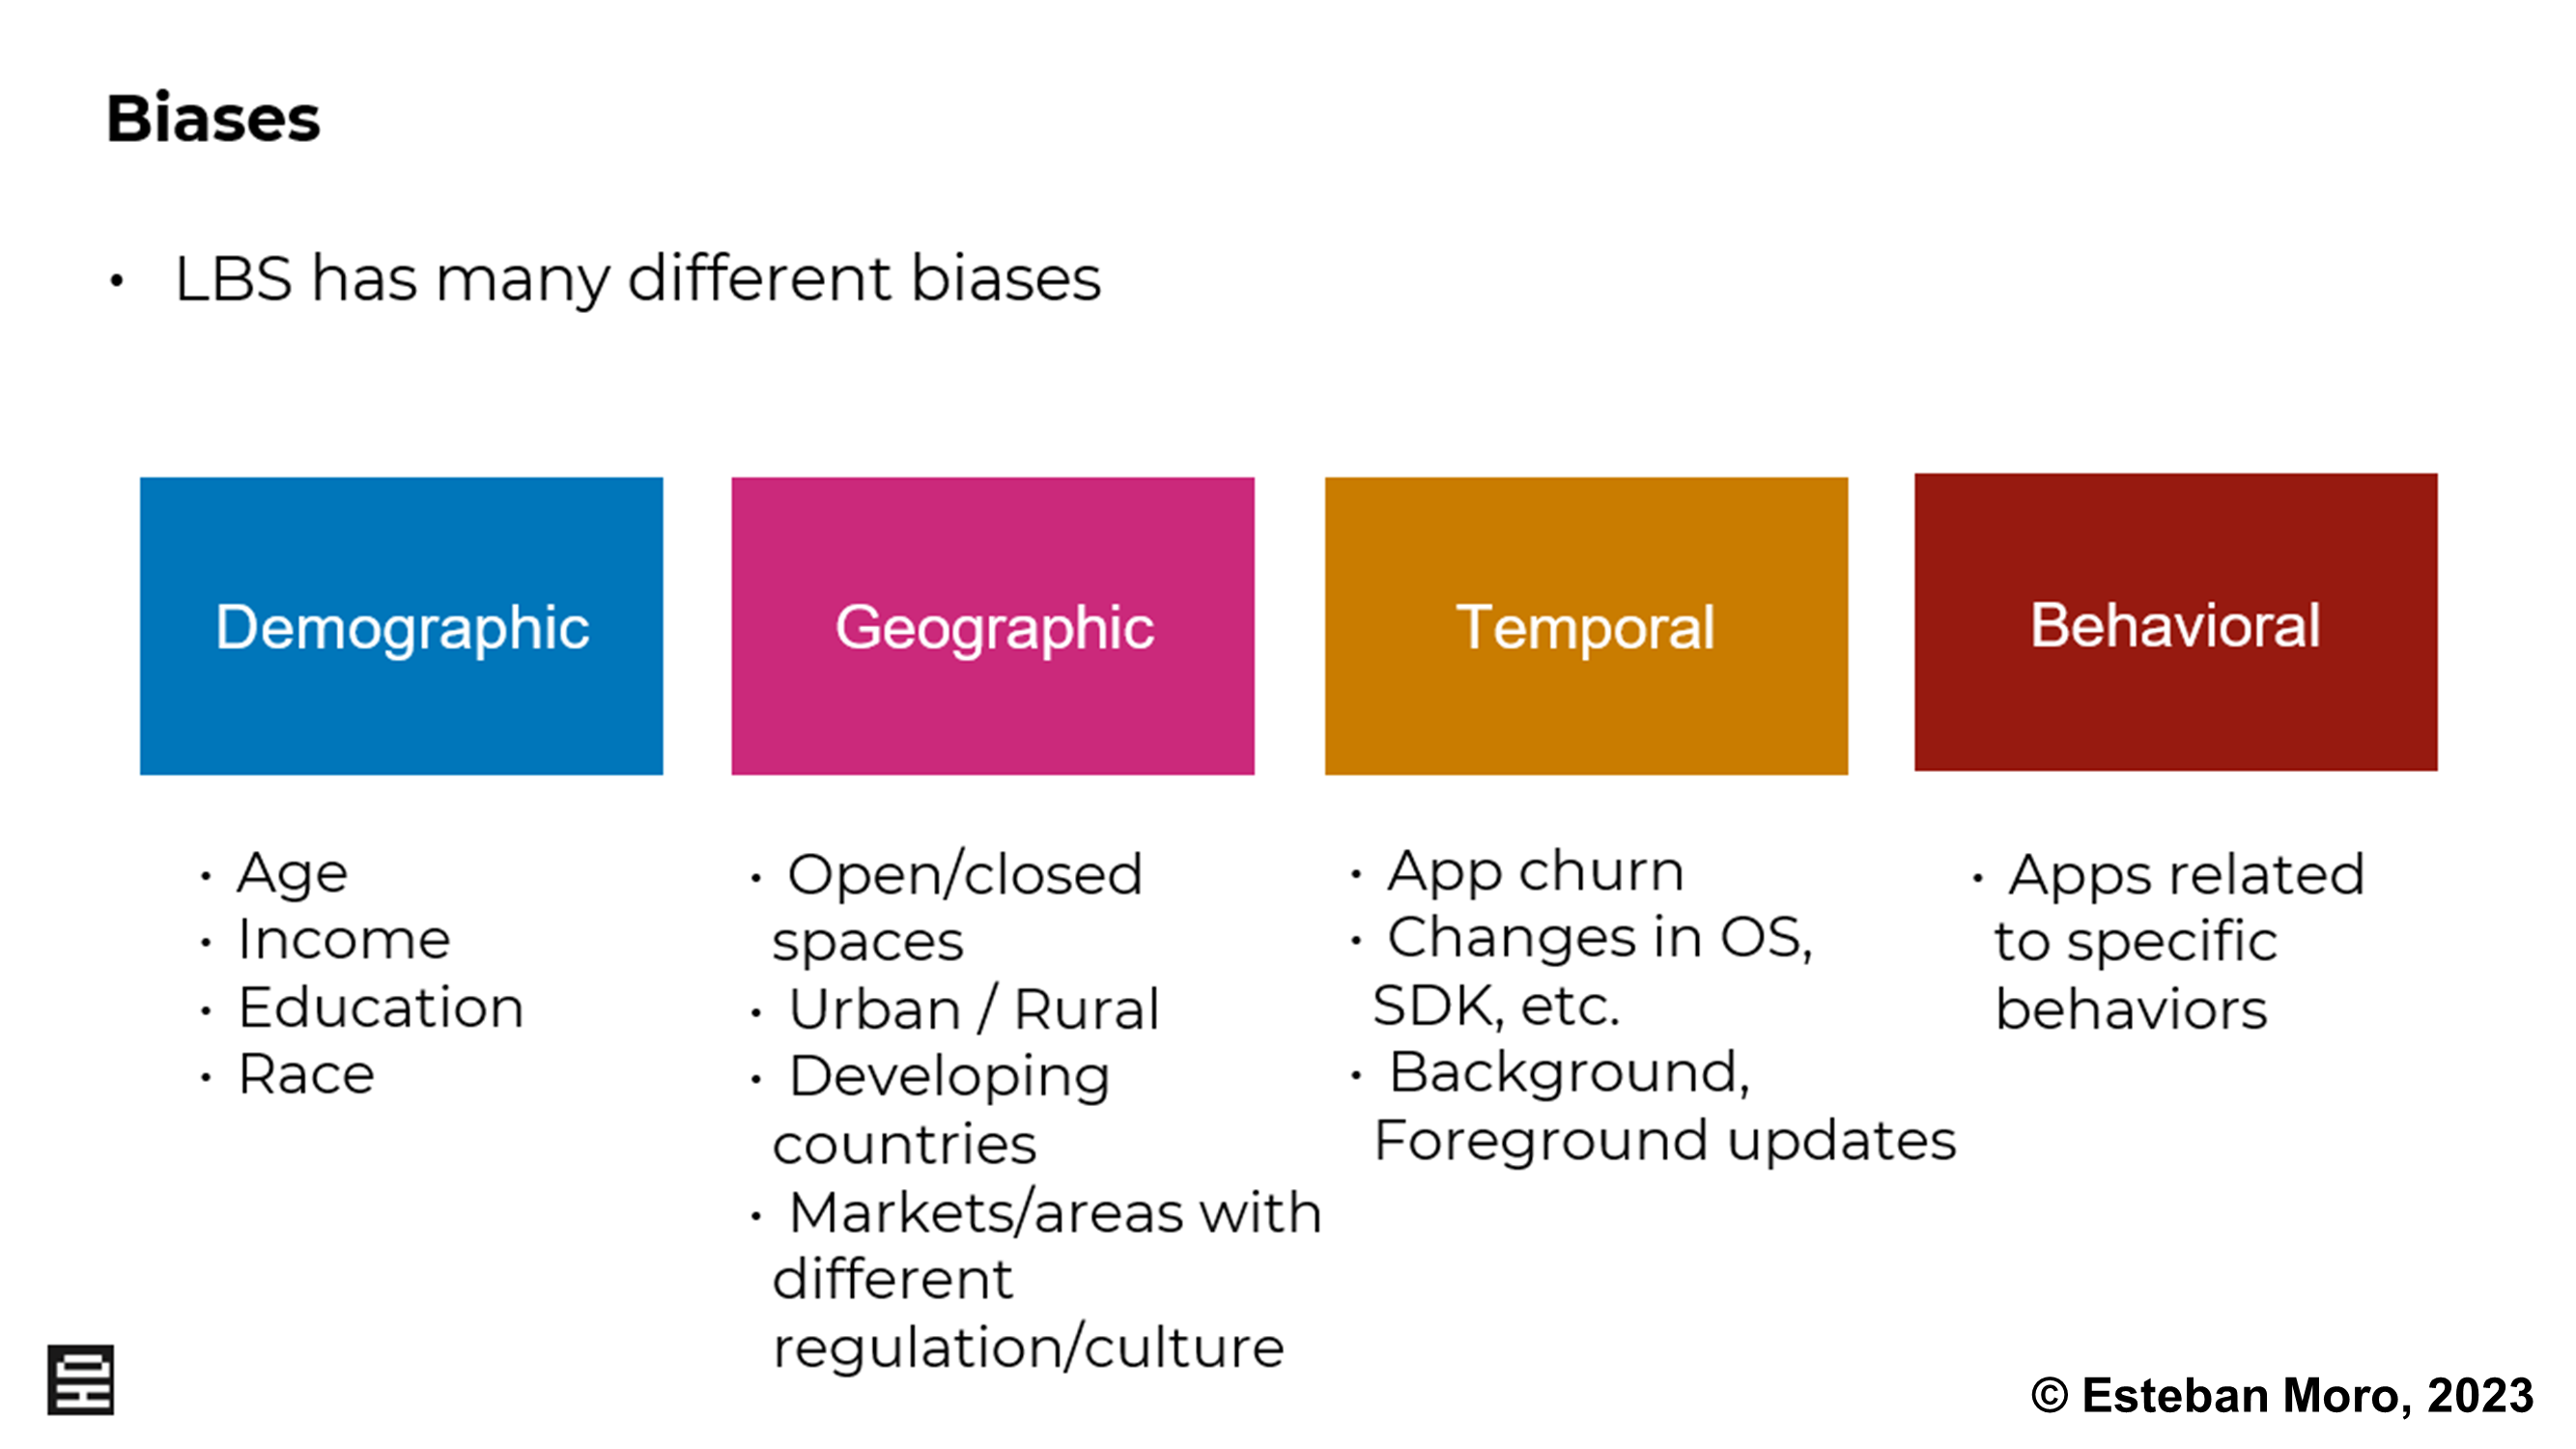
One concern we have around research using mobility data collected from mobile devices, is the lack of assessment of the sample biases and data representativeness. Mobile phone data - especially in its raw form - is known to contain various biases due to different reasons (see slide below). Without careful analysis and correction of the dataset, analysis could lead to misleading and even harmful conclusions. This is especially important in matters of public health, segregation, or inequality in our cities. If we want to alleviate those problems, finding the right demographic dimensions of those problems is crucial for successful policy interventions.

In our study, we conducted multiple checks and analysis to make sure the data represents the true population. One of the core techniques is post-stratification, which is a method to re-weight the importance of each user by how well the user’s area (census block group) is represented in the mobile phone dataset compared to census data. In simple words, we give larger weights to those who live in a 1% sampled area (e.g., 10 users observed out of 1000) than those who live in a 10% sampled area (e.g., 100 users observed out of 1000). The results in our paper are post-stratified to account for potential geographical and demographic biases.
Unfortunately, it is still common to see studies lack such calibration methods and produce results without careful inspection of mobility data. We strongly encourage researchers to conduct more thorough checks in data quality and not to dismiss data pre-processing and post-processing as a trivial and unimportant task, to ensure that we provide fair and accurate insights. Mobility data is an invaluable resource to understand human behavior, but only when insights come from representative data.
Summary
What’s next? Our methods have opened up a new way to understand the behavioral roots and societal impacts of urban changes. We are currently exploring the application of synthetic counterfactual methods to understand the impacts of long-term behavioral changes in various dimensions of urban challenges, including transportation equity, food accessibility, and business resilience. Stay tuned for more research from the MIT Media Lab Human Dynamics Group!
Follow the Topic
-
Nature Communications

An open access, multidisciplinary journal dedicated to publishing high-quality research in all areas of the biological, health, physical, chemical and Earth sciences.
Related Collections
With Collections, you can get published faster and increase your visibility.
Women's Health
Publishing Model: Hybrid
Deadline: Ongoing
Advances in neurodegenerative diseases
Publishing Model: Hybrid
Deadline: Mar 24, 2026


Please sign in or register for FREE
If you are a registered user on Research Communities by Springer Nature, please sign in