Beyond Standard Urinary Dilution Adjustments: A Novel Approach to Biomarker Normalization
Published in Healthcare & Nursing, Social Sciences, and Chemistry

Explore the Research
Variable power functional dilution adjustment of spot urine
Scientific Reports - Variable power functional dilution adjustment of spot urine
The Challenge of Urinary Biomarker Normalization
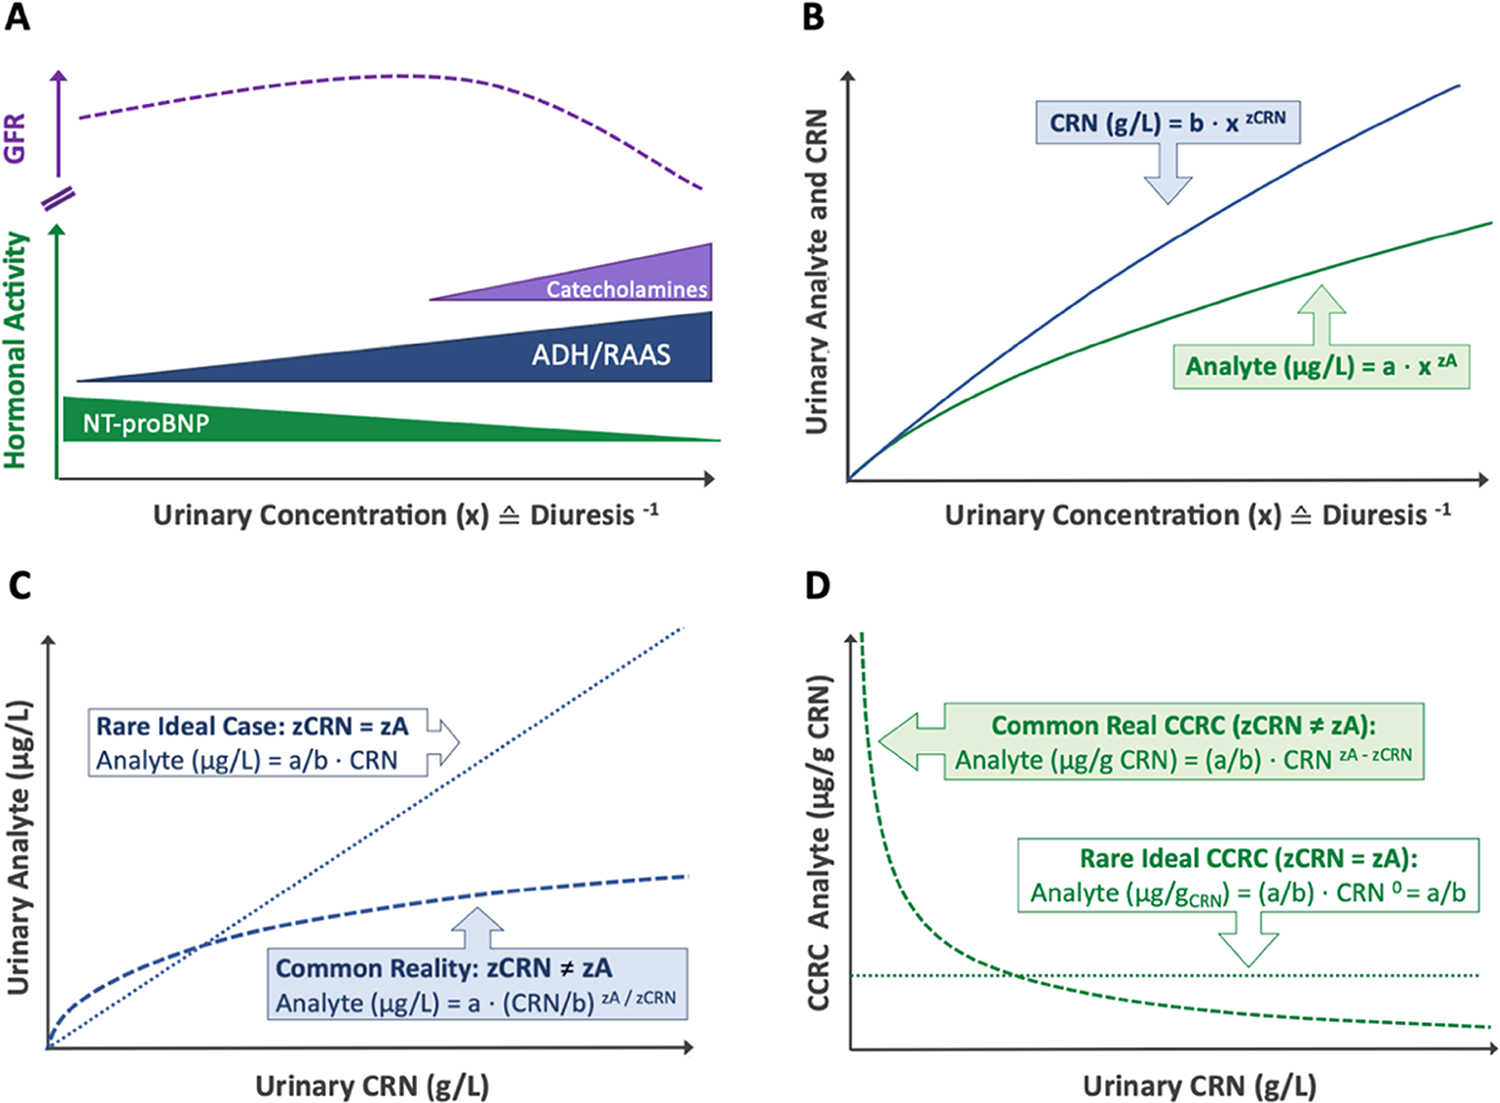
Urinary biomarkers are widely used in environmental health, toxicology, and clinical diagnostics to assess toxin exposure, kidney function, and metabolic health. However, interpreting these biomarkers is challenging due to variations in urinary flow rate (diuresis) and dilution. While hydration status is the primary driver of diuresis, renal function, hormonal regulation, and other physiological and pharmacological factors also play a modifying role 1-4.
Traditionally, creatinine correction has been used to account for these fluctuations. However, this method introduces systematic dilution errors due to a fundamental issue: creatinine (CRN) and most urinary biomarkers experience differential renal handling in response to urinary flow rate 1,2. Considering these discrepancies, applying a universal fixed correction factor (like CRN or CRNb) usually results in systematic biases.
The situation becomes even more intricate as total daily creatinine excretion is affected by various physiological factors, including muscle mass, diet, age, sex, hydration, and kidney function 3,4.
")
Bias in Creatinine Dilution Adjustment
Despite ongoing debate, urinary creatinine (CRN) remains the most widely used dilution corrector for spot urine samples. As a byproduct of muscle metabolism, CRN is produced at relatively stable rates, making it a practical normalization factor. Conventional creatinine correction (CCRC) adjusts analyte concentrations as a ratio per mass of CRN (µg analyte/g CRN), but this approach is fundamentally flawed due to three key assumptions:
1️⃣ Stable CRN Excretion – It assumes CRN excretion is primarily driven by diuresis and remains uniform across individuals, disregarding variability due to muscle mass, age, diet, and health status. In reality, CRN excretion rates fluctuate significantly based on these factors 3,4.
2️⃣ No Metabolic or Renal Interactions – It presumes CRN and analytes are metabolically and renally independent, neglecting potential interactions that introduce exposure-dependent bias 4.
3️⃣ Constant Analyte-to-Creatinine Ratios Across the Entire Dilution Spectrum – This assumption posits that diuresis proportionally affects creatinine (CRN) and other analytes, preserving a stable ratio across urine concentrations. However, it neglects distinct renal handling mechanisms, where solutes undergo active reabsorption, secretion, or hormonal regulation independent of creatinine excretion 1,2. Consequently, analyte-to-CRN ratios can fluctuate, particularly at dilution extremes, making this assumption an oversimplification of renal physiology that may distort biomarker interpretation.
To mitigate this systemic dilution-related bias, WHO guidelines restrict acceptable urine dilution ranges (CRN 0.3–3.0 g/L; relative density 1.010–1.030), beyond which correction methods become unreliable 5. However, this non-causal, threshold-based approach excludes a substantial portion of samples while permitting dilution-related imprecision within the accepted range.
Although advanced covariate methods enhance CRN adjustments by accounting for some CRN fluctuations (Assumption 1️⃣), they are still limited by dilution range constraints. These methods fail to fully capture the non-linear renal handling and biochemical interactions between correctors and analytes, allowing systemic biases in biomarker normalization to persist 4.
The V-PFCRC Approach
The need for improved dilution correction methods became evident through challenges encountered in our environmental medical practice. External diagnostic laboratories frequently reject urine samples due to excessive dilution, leading to unnecessary data loss and biased exposure assessments 5.
In response, Variable Power Functional Creatinine Correction (V-PFCRC) was developed as an adaptive solution. Unlike traditional approaches, V-PFCRC accounts for differential renal handling by dynamically adjusting correction factors to exposure levels. An associated study in BMC Nephrology further refined V-PFCRC by investigating age- and sex-dependent correction formulas for urinary arsenic.
The variable Power Functional Creatinine Correction (V-PFCRC) method was developed by integrating two physio-mathematical principles that became evident from the analysis of extensive empirical data sets. This model adjusts for dilution adaptively, making it more reliable and exposure-stratified than traditional ratio-based correction.

(D) Log-linear regression of arsenic at 1 g/L CRN (uAsN) and the corresponding exponents b, yielding the coefficients c and d for corrective V-PFCRC formulas.
How V-PFCRC Works
V-PFCRC corrects the so far unaddressed biases in dilution adjustment by:
-
Assessing dilution-specific percentile ranks of uncorrected analyte values and transforming them into a standardized value at 1 g/L CRN, ensuring comparability across varying dilution conditions.
-
Replacing flawed linear assumptions with a power-functional model reflecting differential renal handling of analytes and correctors.
-
Dynamically adjusting corrective exponents in response to exposure levels to account for biosynthetic, metabolic, and excretory interactions, mitigating inlayer distortions and ensuring biologically coherent correction.
By integrating non-linearity and empirical calibration, V-PFCRC has demonstrated its ability to provide a more robust and precise dilution adjustment, improving biomarker normalization and exposure assessment accuracy. For example, in the validation study using arsenic and iodine biomarkers, V-PFCRC consistently mitigated dilution bias compared to conventional correction methods. This is evidenced by reduced residual dependencies of adjusted results on CRN and improved correlations with blood-based reference values.
Beyond correcting the non-linear biases introduced by flawed Assumptions 2️⃣ and 3️⃣, V-PFCRC also improved biomarker normalization by substantially reducing result fluctuations linked to variations in creatinine excretion associated with Assumption 1️⃣.
The generalizability of V-PFRCRC to other biomarkers was further supported by efficient bias removal in both sexes for four additional urinary metals: cesium, molybdenum, strontium, and zinc.
The V-PFCRC Formula
Unlike conventional methods that use a fixed exponent for dilution correction, V-PFCRC dynamically calculates correction factors, adjusting to individual exposure levels rather than assuming a one-size-fits-all approach. In V-PFCRC, two analyte-specific coefficients (c and d) are determined from large datasets, describing the average variation of dilution behavior relation between analyte and CRN across exposure levels. The coefficients are then applied to each measurement by adopting the general V-PFCRC formula:
V-PFCRC formulas can be easily integrated into laboratory software, similar to classical ratio-based calculations. Additionally, machine learning algorithms may further refine and stratify the method in the future, enhancing its adaptability and precision. This approach allows for better accuracy across a wide range of exposures and reduced sample rejections due to extreme dilution or concentration.

Dilution-dependent result fluctuations of five arsenic exposure levels in uncorrected, conventional, and variable power-functionally corrected result mode. The shaded areas on the sides of Graph B indicate the usual range restriction imposed in conventional dilution corrections.
Why this matters
The study’s findings have broad implications for toxicology, epidemiology, environmental health, biomonitoring, forensic diagnostics, and clinical research:
- Improvements in accuracy and reliability of biomarkers and exposure assessment.
- Reduced bias in dilution correction in epidemiological studies, reducing the sample sizes needed for valid results in more extensive cohort studies.
- Operational and cost efficiencies achieved by reducing sample rejections due to dilution range restrictions imposed by the traditional simple ratio formulation approach 5.
Final Thoughts: Future Applications of V-PFCRC
Dilution correction remains a key challenge in biomonitoring. Embracing the non-linear nature of physiological relationships through V-PFCRC enhances exposure assessment accuracy, preventing the imposition of misleading linear assumptions and avoiding unnecessary arbitrary sample exclusions.
Future applications of V-PFCRC may further refine biomarker analysis across a broader range of exposure markers, improving risk assessments in both environmental and clinical settings. Additionally, its integration into regulatory frameworks for environmental monitoring and toxicology studies could enhance standardized exposure assessments and public health policies.
The full studies are available here, demonstrating how V-PFCRC improves dilution correction by addressing differential renal handling and optimizing exposure assessment. The Scientific Reports study focuses on developing and validating the method using arsenic and additional urinary biomarkers, while the BMC Nephrology study further investigates the influence of age and sex on V-PFCRC correction factors specifically for arsenic, reinforcing its adaptability and precision.
🔗 Scientific Reports, 2025: Variable power functional dilution adjustment of spot urine
🔗 BMC Nephrology, 2024 The role of age and sex in non-linear dilution adjustment of spot urine arsenic
Key References:
1. Middleton DRS, Watts MJ, Polya DA. A comparative assessment of dilution correction methods for spot urinary analyte concentrations in a UK population exposed to arsenic in drinking water. Environ Int. 2019;130:104721.
2. Araki S, Sata F, Murata K. Adjustment for urinary flow rate: An improved approach to biological monitoring. Int Arch Occup Environ Health. 1990;62(6):471-477.
3. Barr DB, Wilder LC, Caudill SP, et al. Urinary creatinine concentrations in the U.S. population: Implications for urinary biologic monitoring measurements. Environ Health Perspect. 2005;113(2):192-200.
4. O'Brien KM, Upson K, Cook NR, Weinberg CR. Environmental chemicals in urine and blood: Improving methods for creatinine and lipid adjustment. Environ Health Perspect. 2016;124(2):220-227.
5. World Health Organization (WHO). Biological monitoring of chemical exposure in the workplace. Vol. 1. Geneva: World Health Organization; 1996. Available at: https://iris.who.int/bitstream/handle/10665/41856/WHO_HPR_OCH_96.1.pdf
Thomas C. Carmine is an internist specializing in metal toxicology, focusing on advancing sensitive and reliable methodologies for detecting chronic metal exposure in patients. His research is dedicated to refining analytical techniques to improve the accuracy of exposure assessments and enhance clinical decision-making. He investigates associations between environmental pollution, including particulate matter, and diagnostic trends in exposed populations. His work is guided by clinical relevance and methodological precision, supported by an independent research setting.
Follow the Topic
-
Scientific Reports
An open access journal publishing original research from across all areas of the natural sciences, psychology, medicine and engineering.

Related Collections
With Collections, you can get published faster and increase your visibility.
Infectious disease diagnostics
Publishing Model: Open Access
Deadline: Sep 23, 2026
AI in Education
Publishing Model: Open Access
Deadline: Oct 09, 2026


Please sign in or register for FREE
If you are a registered user on Research Communities by Springer Nature, please sign in