Big database ecology to examine if size traits are driving population trends across the world
Published in Ecology & Evolution
Across the globe biodiversity is under enormous pressure. In this context, one of the more remarkable recent ecological findings has been the observation that species richness is remarkably stable at the assemblage level - despite considerable underlying turnover in species identity. This indicates that some kind of ecological diversity regulation lies behind community dynamics, however because these surveys focus just on the number of species at particular locations they can’t by themselves identify if there are underlying trends in the type of species that are present. Afterall, there are number of expectations that human-driven pressures (from climate change, habitat degradation and hunting/harvesting) may impact larger species more than smaller species. While there have been a few studies identifying trends between size and how well populations are performing, there simply aren’t enough to determine if there is a widespread pattern. With the amazing publicly available BioTIME database of community time series that lay behind many of the existing global studies and the increasing availability of trait databases, we set out to address this gap.
Inevitably, the first hurdle was a huge amount of data-wrangling spadework (although at least with the various lockdowns that this project was carried out under, there weren’t many more exciting things to be doing!). BioTIME is a collection of hundreds of ecological studies, and despite the very impressive efforts of the database curators to corral the data into a standard form, there is still a lot of variation in how the 10’000s of different taxa are labelled. While the majority are nice Linnean binomials, there are also English common names, species codes, vague descriptions, large numbers of morphospecies, plenty of misspellings, lots of superseded names, and more ways to say ‘unidentified’ than I would have imagined possible. Even with a nice binomial, because the database is universal and genus names are only unique within biological kingdoms, there were also several cases of cross-kingdom homonyms to disentangle. With so many different taxa names in the starting dataset, this all had to be automated (largely using the GBIF reference taxonomy as a skeleton), with manual cleaning reserved for only the trickiest of corner cases.
Fortunately, the other side of the equation, the size traits, was a little more straightforward - at least from a data wrangling perspective. Particularly for the vertebrates, there were data compilations that could be used pretty directly, and for plants the TRY database held a wealth of information. This still left some pretty large gaps amongst the invertebrates. With some reluctance, I didn’t try and bring in any insect traits, as there weren’t enough studies within the public BioTIME database to make it worthwhile. For the marine invertebrates there were many studies, so I turned to the WoRMS database, which holds a wealth of information on marine species, but also takes quite a bit more fiddling to boil the data down into a single representative value for each species.
After all of that, I had a very large database on my hands, but also one that was fundamentally patchy – although plenty of the studies in BioTIME had fairly good trait coverage, only a small fraction of the BioTIME studies had complete data. We did not think this would firmly support running what would arguably the ‘ideal’ analysis– looking at community level shifts in average trait values. What we could do ask instead was: does size influence the relative population dynamics of the species within a particular assemblage? The ‘within-assemblage’ part was quite important as it would allow some sense of looking at relative trends, separate to underlying trends caused by other external pressures or changes in sampling intensity. We could then look across the 100s of studies for general trends. Of course, summarising community dynamics into a single number is a fundamental challenge, and choices made about data transformation will emphasise different aspects of the complex system dynamics. In the end we present three different routes to get from the raw observation data to a population trend, which gave reassuringly consistent results.
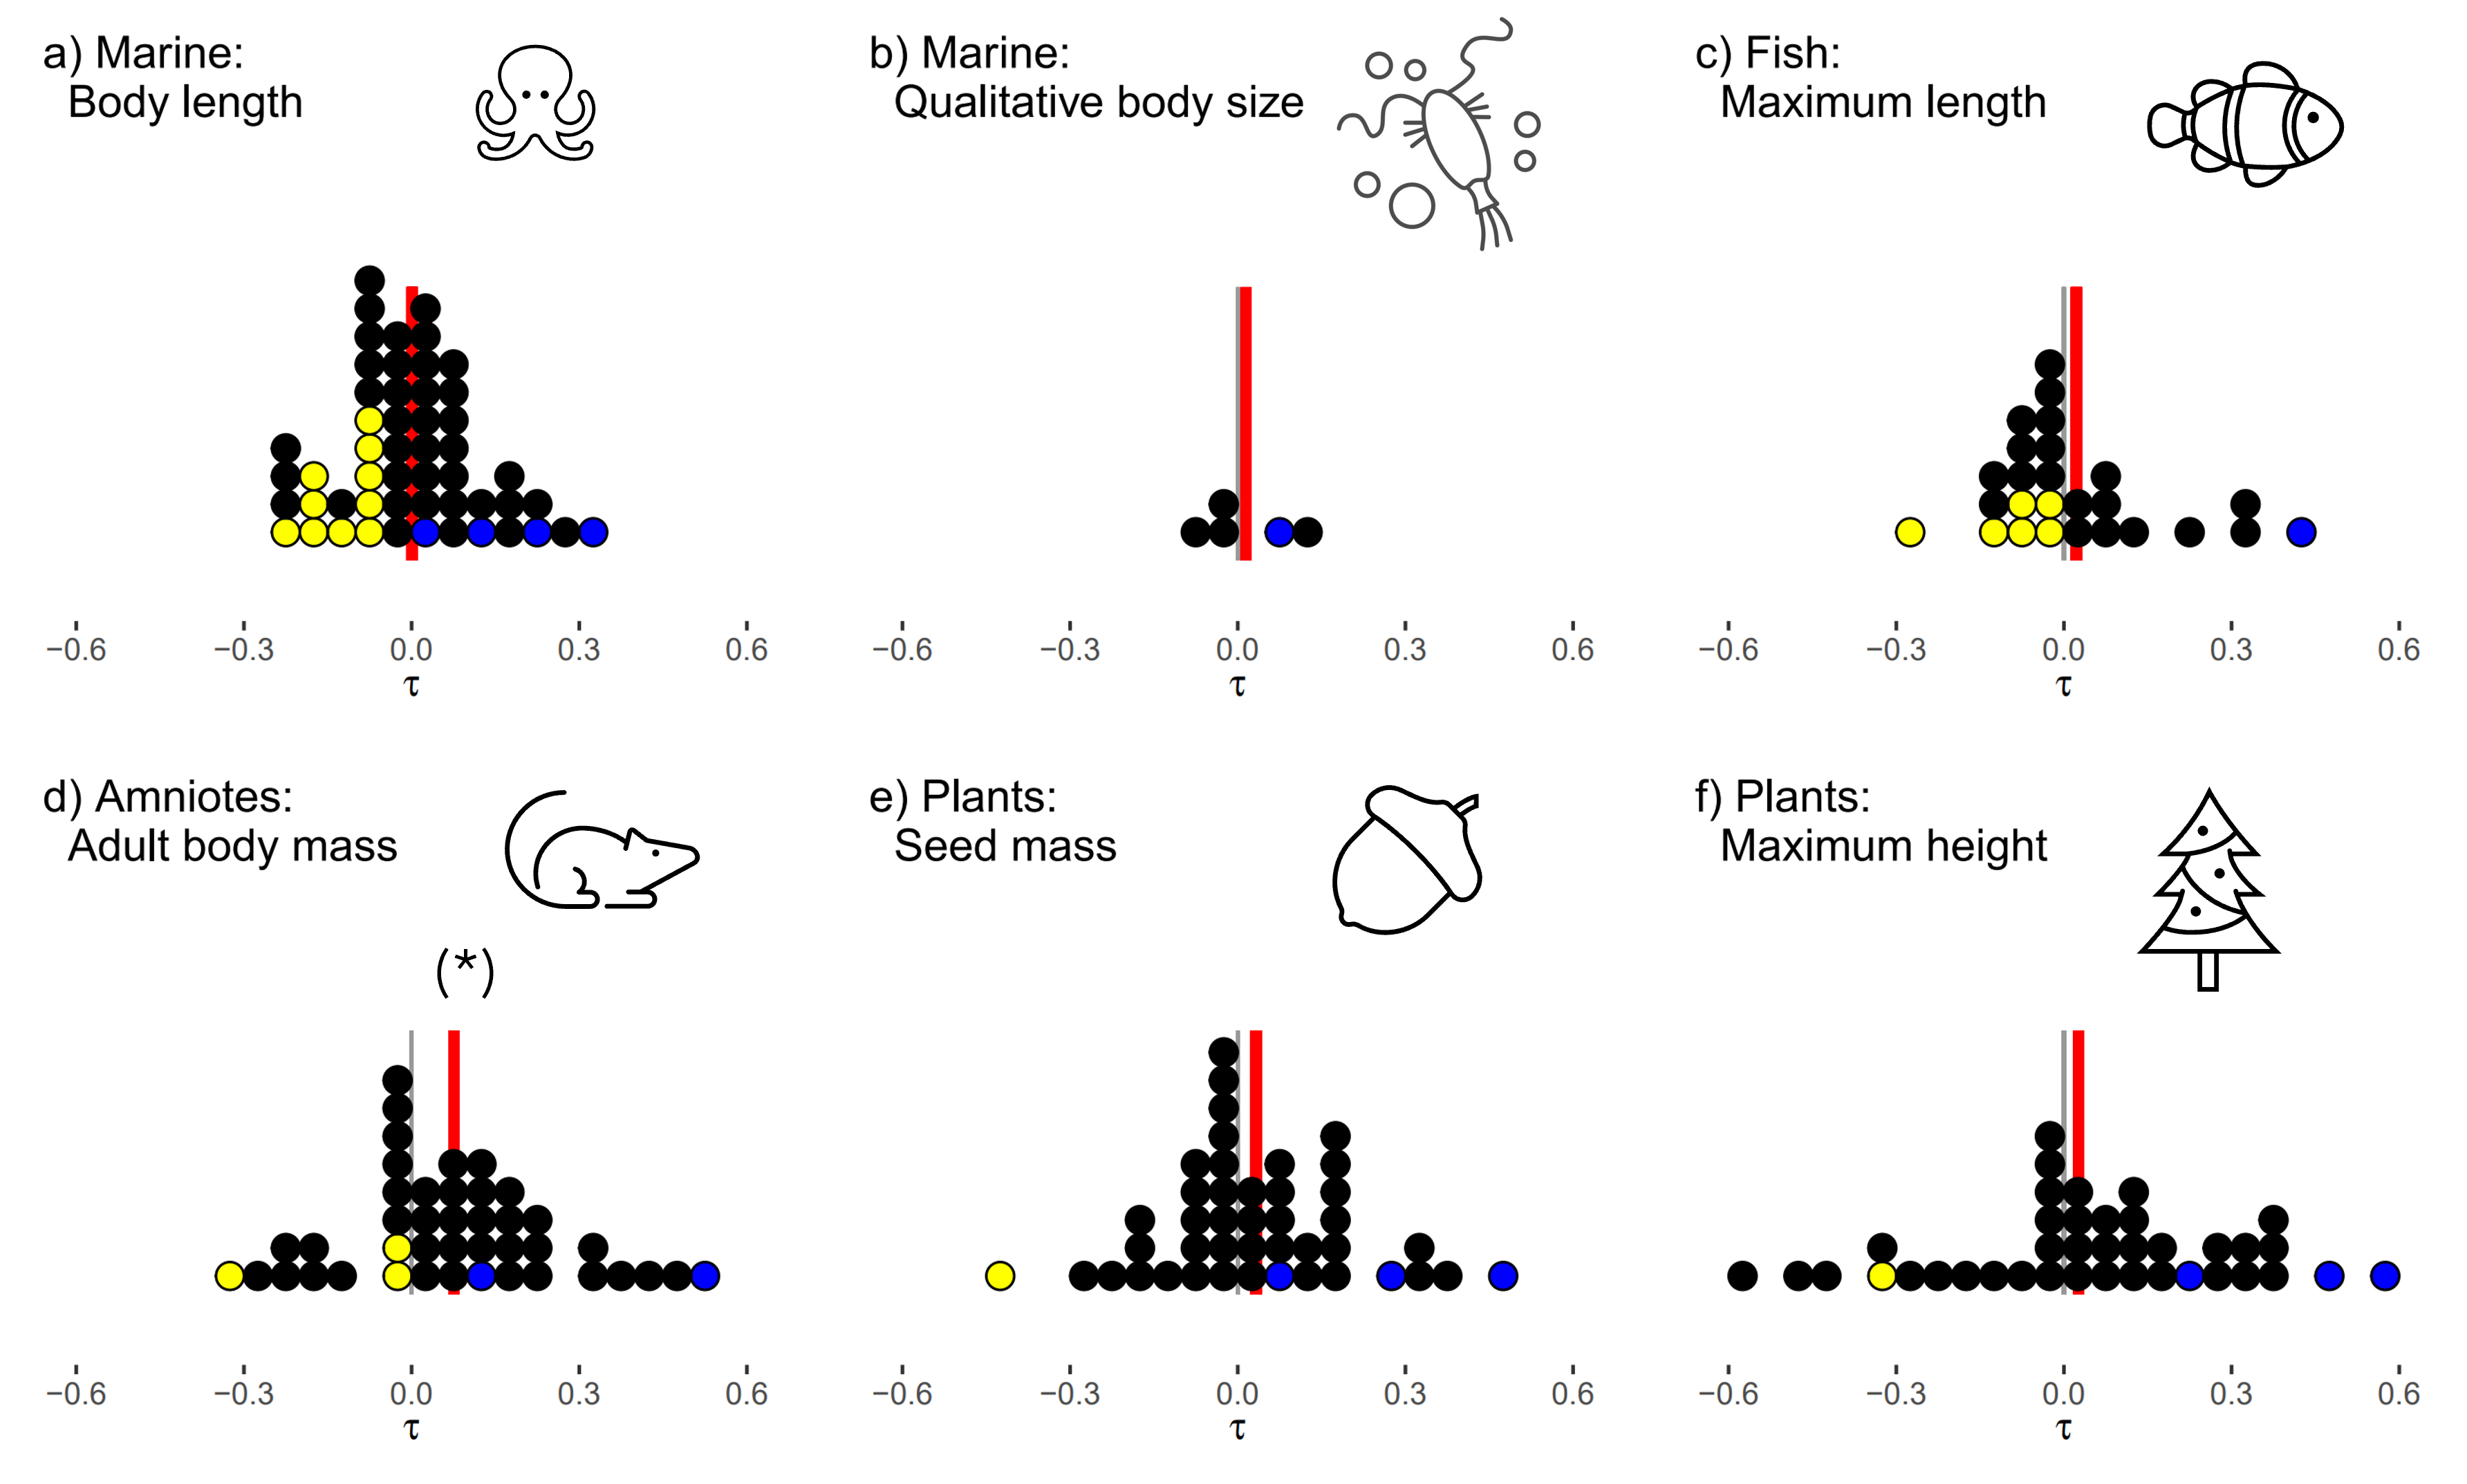
Dealing with this extremely messy dataset posed a significant analytical challenge. A lot of data inevitably ended up on the cutting room floor, filtered out for not meeting various data quality thresholds. While it would be technically feasible to pull it all together into an enormous hierarchical model, the assumptions that we would have to make regarding scaling diverse traits onto comparable scales, balancing the emphasis placed on studies of quite radically different diversities, durations and spatial scales (to name but a few!) would give a false sense of accuracy to any grand result that we could pull out. Throughout we took a conscious choice to keep our analyses as simple and non-parametric as we could: we took as our main response a rank correlation coefficient between the size-trait and the population trend, and present our main results with dots plots to illustrate our view that the results are best seen as a collective of many individual smaller analyses.
The grand result? Across the whole set of studies, the correlations between size and population trends were pretty plumly centred on zero. There is certainly no consistent trend for larger species to be performing worse than the smaller species.
Does this really mean that nothing at all is going on? Of course not! By reference to null models from randomised data, we can show that a fair number of the system do show identifiable correlations between species traits and their population trends – it is just that on balance there is no consistency.
Does this mean that we don’t have to worry? Also not! (unfortunately) With our local-assemblage focus, are results are really quite distinct to the multiple studies that show clear size correlations to global trend indicators such as Red List classification. Further, just because we can’t see a trend now, does not mean that it won’t occur in the future as impacts accelerate - or indeed that significant changes have not already occurred before the start of the data collection. Although we filtered out the shortest time series and we didn’t see a pattern of greater effects when there were longer datasets, much of the data is frustratingly short.
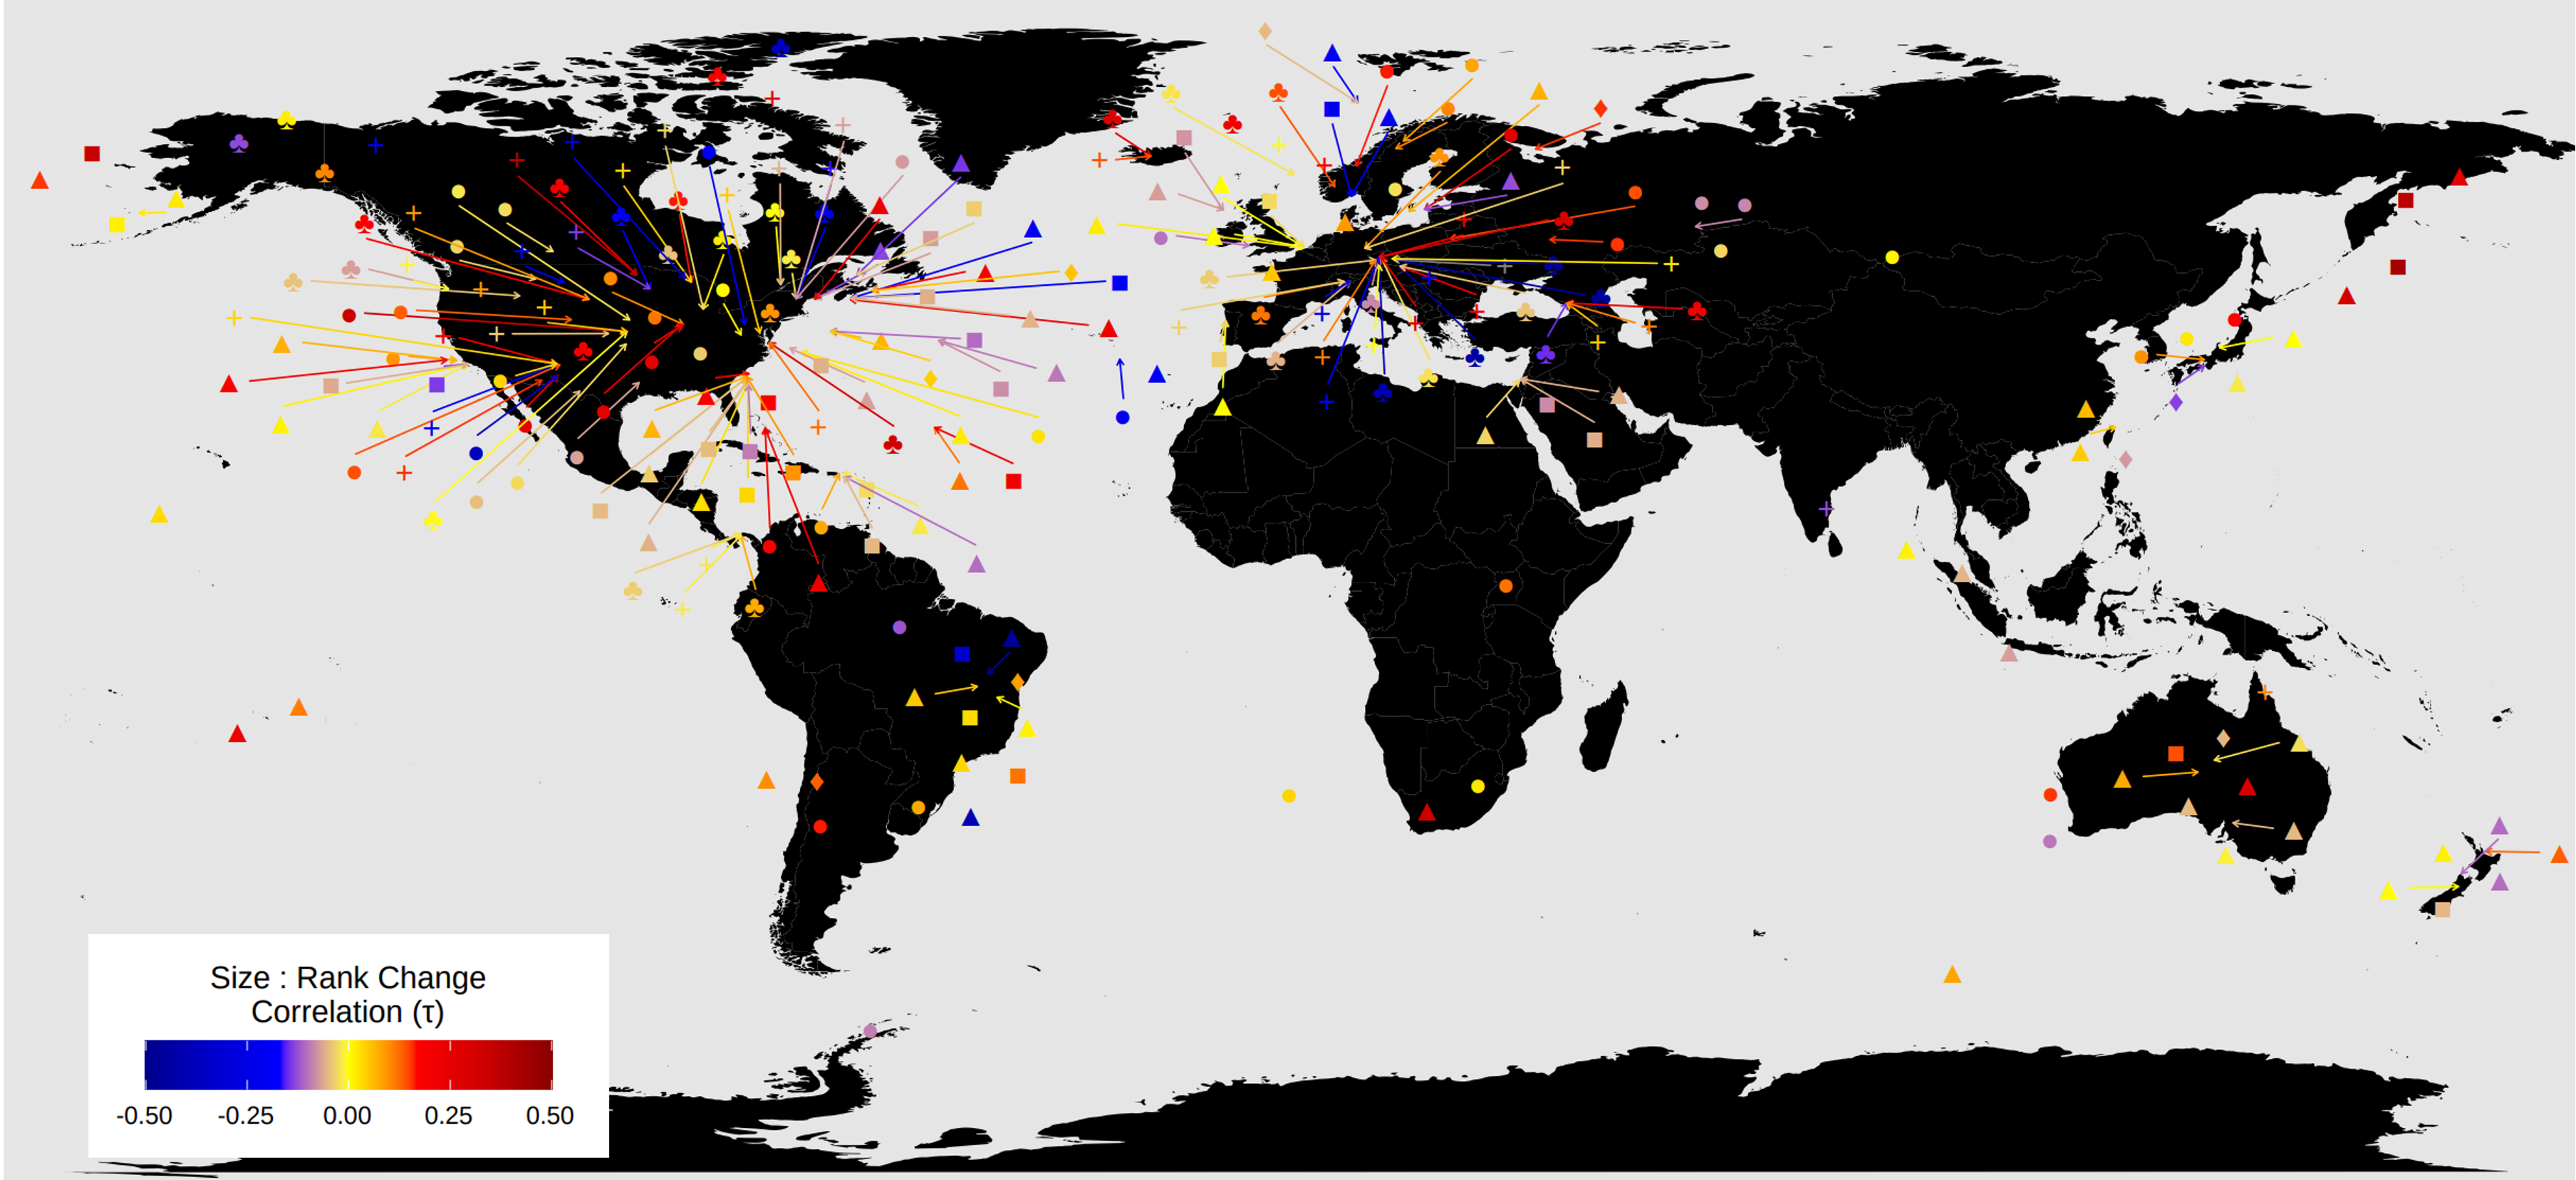
It is quite easy to identify holes in datasets we used (a glance at the study distribution maps shows the familiar extreme overemphasis on European and North American data, but the biases extend into lots of other directions too), and it is clear there are yawning gaps in our current capacity to truly quantify global trends. By taking as our core unit of analysis the ‘study’ as defined in the BioTIME database, we are essentially putting a good deal of trust in the authors that are studying a meaningful unit of diversity, that would encompass enough of range of species. Most studies use only a single sampling approach, with a consequently narrow scope at least compared to the entire size range of species that live at a site.

Nonetheless, the results demonstrate that local assemblages very often have a lot going on, and the signal of global patterns may be surprisingly hard to discern within them. I hope both the paper itself and this view from behind the scenes gives a sense of the necessary compromises in trying to get a truly global sense of how communities are responding.
Lastly, but probably most importantly, I must recognise all the hundreds of scientists whose work lies behind all the databases that fed into this analysis. Behind each of the dots in this study, lies an enormous foundation of work by researchers, likely with entirely different research goals. High-level overview studies only become feasible when data is both open and sufficiently curated to be amenable to further analysis - thanks to all of those who contributed to these databases!
Read the paper here: https://www.nature.com/articles/s41559-021-01624-8
Follow the Topic
-
Nature Ecology & Evolution

This journal is interested in the full spectrum of ecological and evolutionary biology, encompassing approaches at the molecular, organismal, population, community and ecosystem levels, as well as relevant parts of the social sciences.
Related Collections
With Collections, you can get published faster and increase your visibility.
Biodiversity and ecosystem functioning of global peatlands
Publishing Model: Hybrid
Deadline: Jul 27, 2026
Understanding species redistributions under global climate change
Publishing Model: Hybrid
Deadline: Jun 30, 2026


Please sign in or register for FREE
If you are a registered user on Research Communities by Springer Nature, please sign in