Commonly used heat stress indices disagree about the effect of moisture on heat stress
Published in Earth & Environment

Heat stress and moisture
The human body must keep within a certain range of internal temperature to survive. In hot conditions this means losing heat by sweating, but if humidity is high then the cooling effect of sweating is smaller. Heat stress indices, for example, the Heat Index used by NOAA, combine the effects of temperature and humidity into one number. Heat indices usually increase with both temperature and humidity. Heat stress impacts people’s health and ability to work, and is an increasing concern given the warming climate.
Irrigation and increased vegetation cover typically reduce air temperature. But this increases humidity, so it could increase heat stress. Several recent studies have argued that, in terms of heat stress, the effect of humidity outweighs the effect of temperature. We noticed that these studies might have reached different conclusions if they had used different heat stress indices.
This led us to wonder how previous findings depend on the choice of heat stress index. To answer our question, we examined a range of heat stress indices that are often used in studies on the effects of climate on health. The question of whether moisture near the land surface increases or decreases heat stress can be thought of as a trade-off: if we can increase humidity to lower the temperature, under what conditions will this reduce heat stress?
We aimed to achieve two things with this paper. Firstly, we want to encourage researchers to be more critical in how heat stress indices are chosen and presented. Secondly, we provide a simple method for understanding the conditions under which different heat stress indices will disagree.
What we did
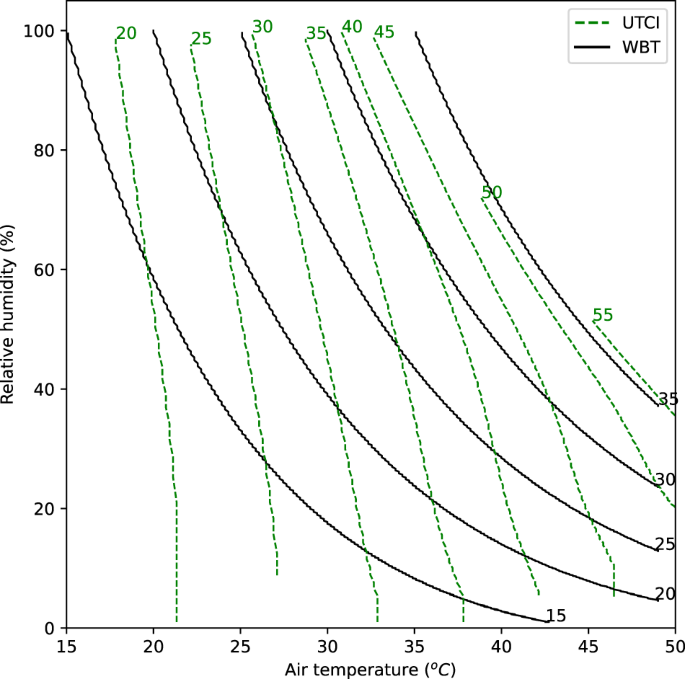
Comparing the values of different heat stress indices is difficult for two reasons. Firstly, there is no one-to-one relationship between them. For example, Figure 1 shows that each of the lines of constant value for two heat stress indices (universal thermal climate index (UTCI) and the wet-bulb temperature (WBT)) intersect at more than one point. Secondly, they are not measured on the same scale; even though they are both in degrees Celsius, 55 °C in UTCI is similar to 35 °C in WBT.
 of two heat stress indices, the universal thermal climate index (UTCI) and the wet-bulb temperature (WBT).")
Figure 1: Isopleths (lines of constant value) of two heat stress indices: the universal thermal climate index (UTCI) and the wet-bulb temperature (WBT).
We calculated the change in humidity that resulted in a change in each heat stress index equal to a 1 °C change in temperature, which we called M. This varied between different temperature and humidity conditions. A high M means a big change in humidity is equivalent to a small change in temperature when it comes to reducing heat stress.
We found that different heat stress indices had very different M values. This shows how different heat stress indices treat temperature and humidity in different ways. By comparing two different heat stress indices in the same conditions, we can see when they agree or disagree. This can be tested without having to do any modelling of the atmosphere. For example, in Figure 2 we show the difference in M between UTCI and WBT. UTCI places less emphasis on humidity at low temperature and low humidity compared to WBT. Differences between the two heat stress indices are small when temperature and humidity are both high. Studies of conditions in the dark blue shaded area of Figure 2 will find very different results if they use the UTCI versus if they use the WBT as indicators of heat stress. Researchers need to be aware of how their conclusions may be very different depending on their choice of heat stress index.
 more than UTCI does in those conditions.")
Figure 2: Differences in M between two heat stress indices UTCI and WBT in different temperature and humidity conditions. A large negative number (darker blue) means that WBT emphasizes humidity (as opposed to temperature) more than UTCI does in those conditions.
I am a researcher engaged in cross-disciplinary research into the health and economic impacts of climate. My current work focusses on urban adaptation to heat, and the health and economic case for modifications to the built environment.
Follow the Topic
-
npj Climate and Atmospheric Science
This journal is dedicated to publishing research on topics such as climate dynamics and variability, weather and climate prediction, climate change, weather extremes, air pollution, atmospheric chemistry, the hydrological cycle and atmosphere-ocean and -land interactions.

Related Collections
With Collections, you can get published faster and increase your visibility.
Atmosphere-Biosphere Interactions
Publishing Model: Open Access
Deadline: Oct 31, 2026
AI-Driven Innovation in Atmospheric Chemistry and Composition–Climate Interactions
Publishing Model: Open Access
Deadline: Oct 31, 2026
Please sign in or register for FREE
If you are a registered user on Research Communities by Springer Nature, please sign in