Cortex-wide excitation/inhibition topography in Parkinson’s disease
Published in Neuroscience

Explore the Research

Cortex-wide topography of 1/f-exponent in Parkinson’s disease - npj Parkinson’s Disease
npj Parkinson’s Disease - Cortex-wide topography of 1/f-exponent in Parkinson’s disease
Key role of computational models in the path towards brain disease treatment
Brain diseases have debilitating effects on both patients and caregivers because of lack of effective treatment and management strategies. Increasing longevity means that more people will be affected by a brain disease. Today, clinicians correlate the behavioral symptoms of brain diseases with changes in gene expression, chemistry and brain structure. Recently developed machine learning tools essentially mimic this approach to classify disorders based on high dimensional patient data. But this approach misses the full chain of events from the brain changes to the brain dynamics and then to behavior. This can only be understood through the theory of brain networks.
Computational models of the brain causally explain how genes and neural networks shape disease related brain activity and thereby behavior in different brain diseases such as Parkinson’s diseases (PD), Alzheimer and epilepsy. Previous work has revealed how these diseases may have common computational mechanisms. Of course, there is more to be done to use these ideas to develop ways to stimulate the brain and repair diseases-related brain activity.
Besides revealing the underlying causal mechanisms, computational models of the brain also suggest what we should read from the brain as a marker of the disease. Therefore, we are developing ‘model-driven data analysis’ approaches which go beyond mere classification and correlation as AI does, it helps us better understand the mechanisms underlying diseases. Our project is a nice example of that – we are extracting new features from brain imaging data which provides deeper insights into how local brain networks are affected in PD patients.
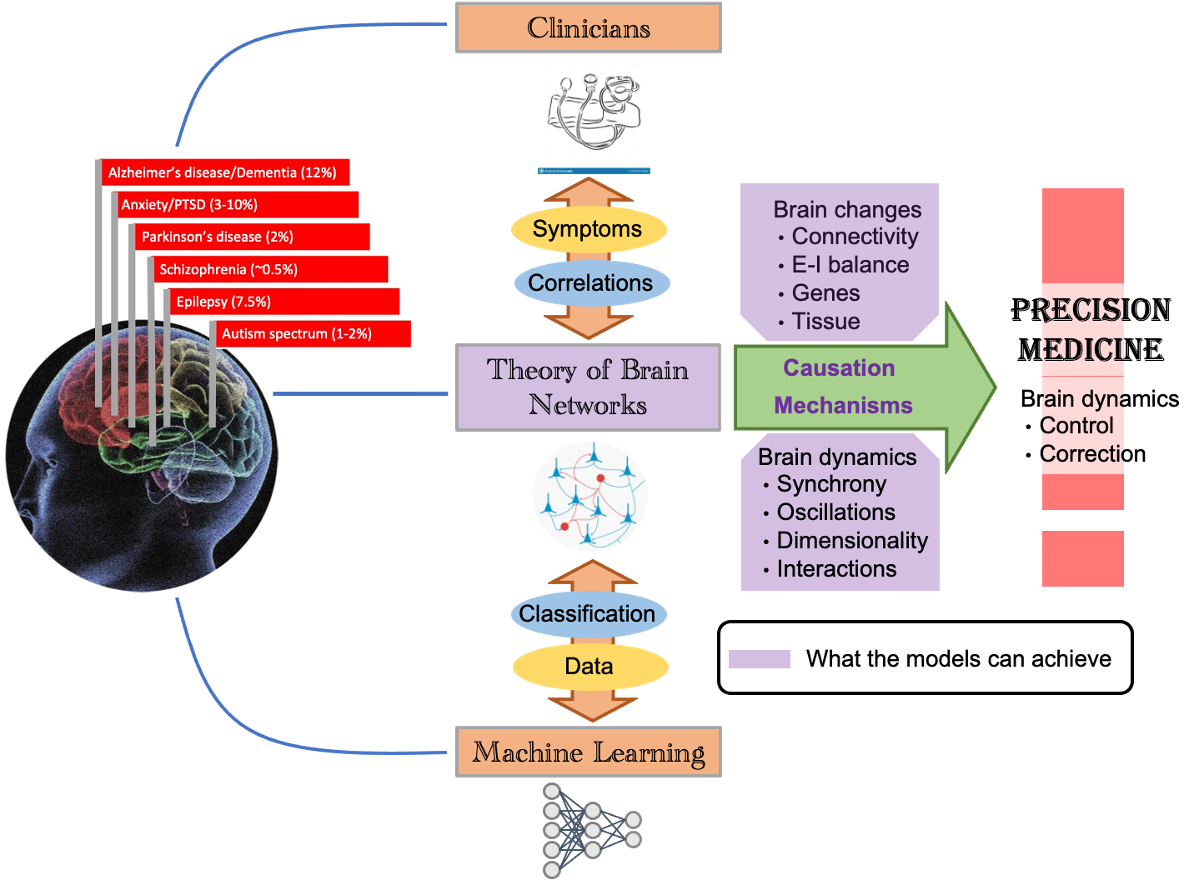
A model-driven data analysis of brain imaging data from PD patients
Coming to our study, we were interested in the neural dynamics in brain regions of PD patients that are commonly not investigated. Given prominent motor symptoms of PD, a major focus has been to understand the roles of basal ganglia and motor cortex in the pathophysiology of PD. However, accumulating evidence suggests that PD-related changes are distributed across the whole brain. For instance, PD patients show many non-motor symptoms (see Figure 2 and Kalia and Liang 2015 [2]). Moreover, among neurons altered in PD there are neurons that release neuromodulators such as dopamine, acetylcholine and noradrenaline projecting throughout the whole brain [1]. It has been a major challenge to non-invasively quantify changes in the cortical networks of PD patients.
![Figure 2: PD progression of (non-)motor symptoms and complications. Adapted from [2].](https://images.zapnito.com/cdn-cgi/image/metadata=copyright,format=auto,quality=95,fit=scale-down/https://images.zapnito.com/uploads/LJAuRhrPRge2fiFJFGZG_btpnpj2.png)
These changes can be revealed using brain imaging techniques like magnetoencephalography (MEG). Thanks to its really good time resolution (less than 1ms), MEG can catch small details on brain dynamics. Consequently, it has been employed to enhance our comprehension of neuronal activity across a range of domains, including cognition and various brain disorders like epilepsy, stroke, chronic pain [see Hari and Salmelin 2012 [3] for a review of some of these studies].
Initially, the analysis primarily relied on correlation tools, but advancements now allow for more detailed insights into cortical networks. The magnetic field detected in MEG originates from the magnetic field created by current flowing across neurons. Consequently, utilizing Maxwell electrodynamics, it becomes possible to construct a model of the neural activity responsible for the signal recorded by MEG sensors. Based on this model, mathematical tools can be used to inverse the problem of determining the origin of the signal in the brain [4]. This makes it possible to localize the sources and then infer the distribution of neural activity over the cortex (given that most MEG signals are derived from the cortex due to the rapid decrease of the magnetic field with distance).
Of particular interest and closely linked to the MEG signals is the excitation-inhibition (EI) balance. The dynamics of the latter can be inferred as MEG signals come from the summation of thousands of synaptic currents. Conveniently, excitatory and inhibitory synapses have different time constants with inhibition being slower than excitation and this can be seen in the spectrum of the MEG or other population signals [5]. Therefore, inhibition tends to increase the slope of the power spectral density (PSD) which is known to follow a power law (see Figure 3).
Fitting the PSD of the MEG signal from different groups with a power law of type 𝜅/f𝜆 enables us to infer how the relative EI balance may differ among different subjects. The brain topography of these changes may give us some insights into how PD affects the cortical networks. This is a nice example of model-driven data analysis as we oriented our analysis towards features (here EI balance) that are of utmost importance for the neuronal dynamics.
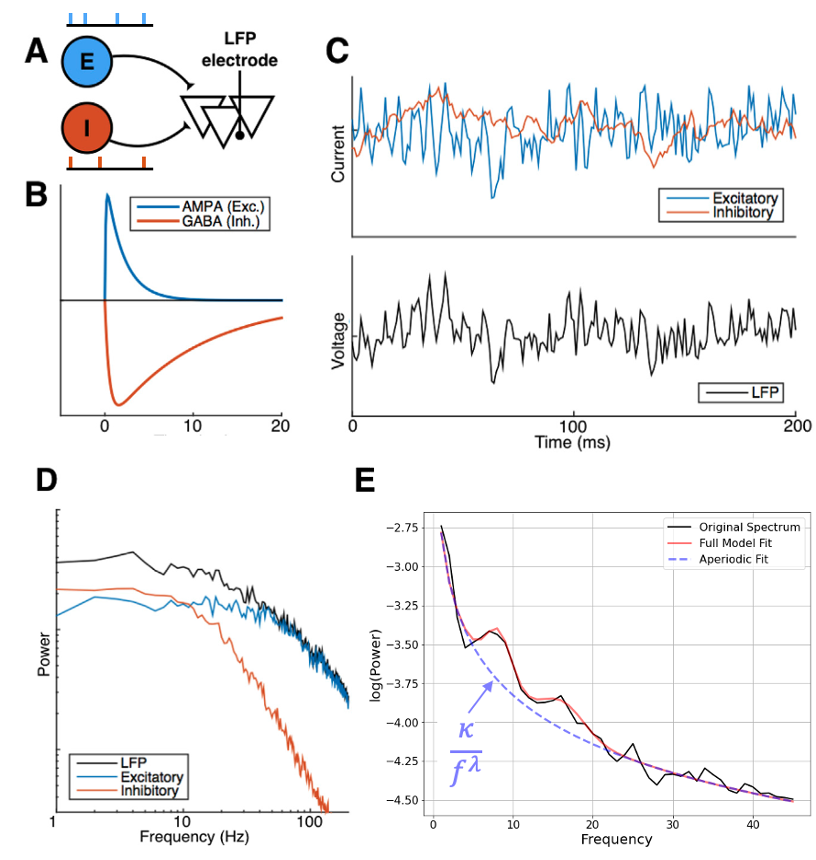
Adapted from [5].
EI balance changes over the cortex in PD
In this work we characterized the landscape of the 1/f-exponent of the aperiodic activity (𝜆) across the cortex. We observed that 𝜆 is in general higher in PD patients that in healthy controls. This increase was seen in all regions except in the frontal areas (see Figure 4). This increase may mean an increase of inhibition or decrease of excitation or both. The increase was mostly significant in the sensory areas (visual, auditory). Crucially, we found that dopamine replacement therapy (levodopa) does not affect the spatial distribution of the 1/f-exponent in the cortex.
The lack of prefrontal changes between PD and HC may be due to the structure of axonal projections of the dopaminergic neurons. Indeed, the main brain area producing dopamine and projecting to the cortex (in particular prefrontal cortex) is the ventral tegmental area, which is altered after the substantia nigra compacta in PD. Another possibility is the need of keeping the right balance in the frontal part as long as possible, as a result of a protecting process. On the other hand, the decrease of EI ratio in sensory areas suggest possible visual and auditory deficits in addition to the already known olfactory and proprioceptive ones.
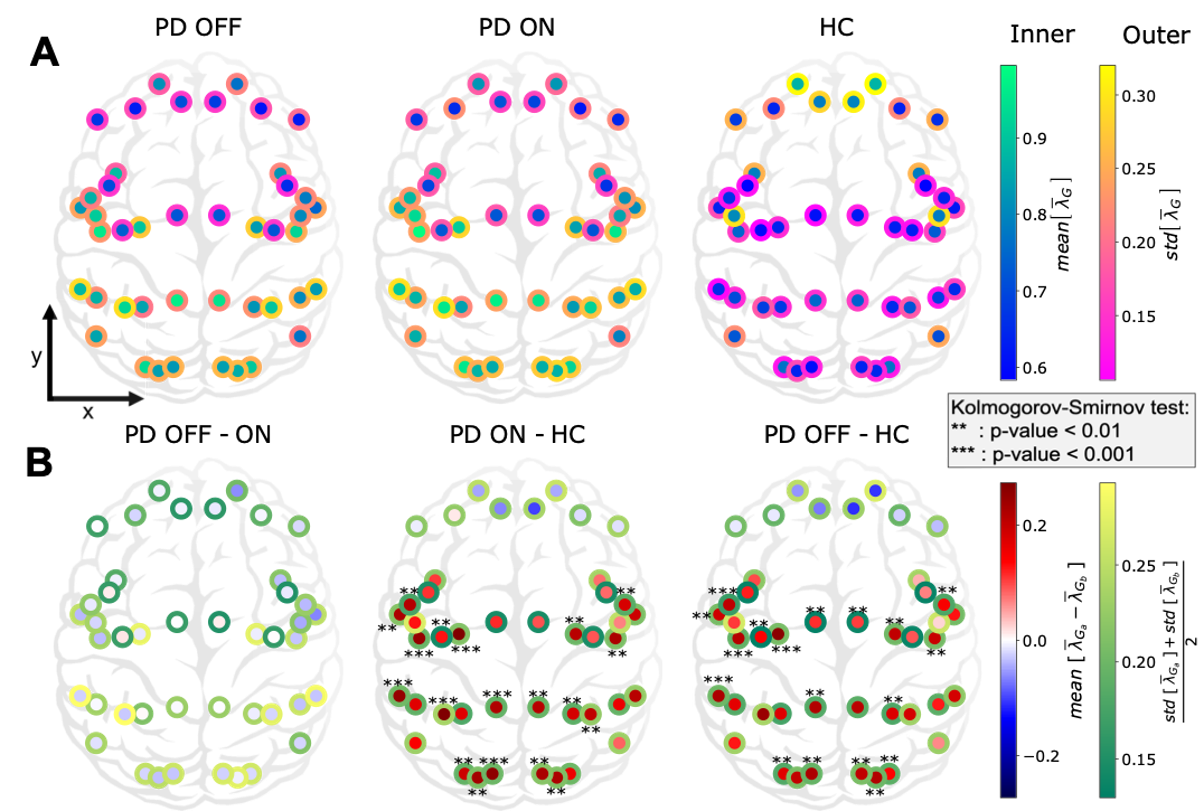
Figure 4: Cortex-wide distribution of the mean over time of 𝜆 within each group.
These changes in 1/f-exponent were not correlated with clinical assessment scores of PD patients (UPDRS-III). This is perhaps not surprising because UPDRS-III does not account for sensory symptoms. Surprisingly, 1/f-exponent changes were correlated with the age of the PD patients (see Figure 5) suggesting an acceleration of sensory ‘aging’ in PD. Indeed, despite a decline in the dopaminergic neuron function due to normal aging, these “normal” changes do not seem sufficient to affect the aperiodic component of cortical population activity, unlike in PD.
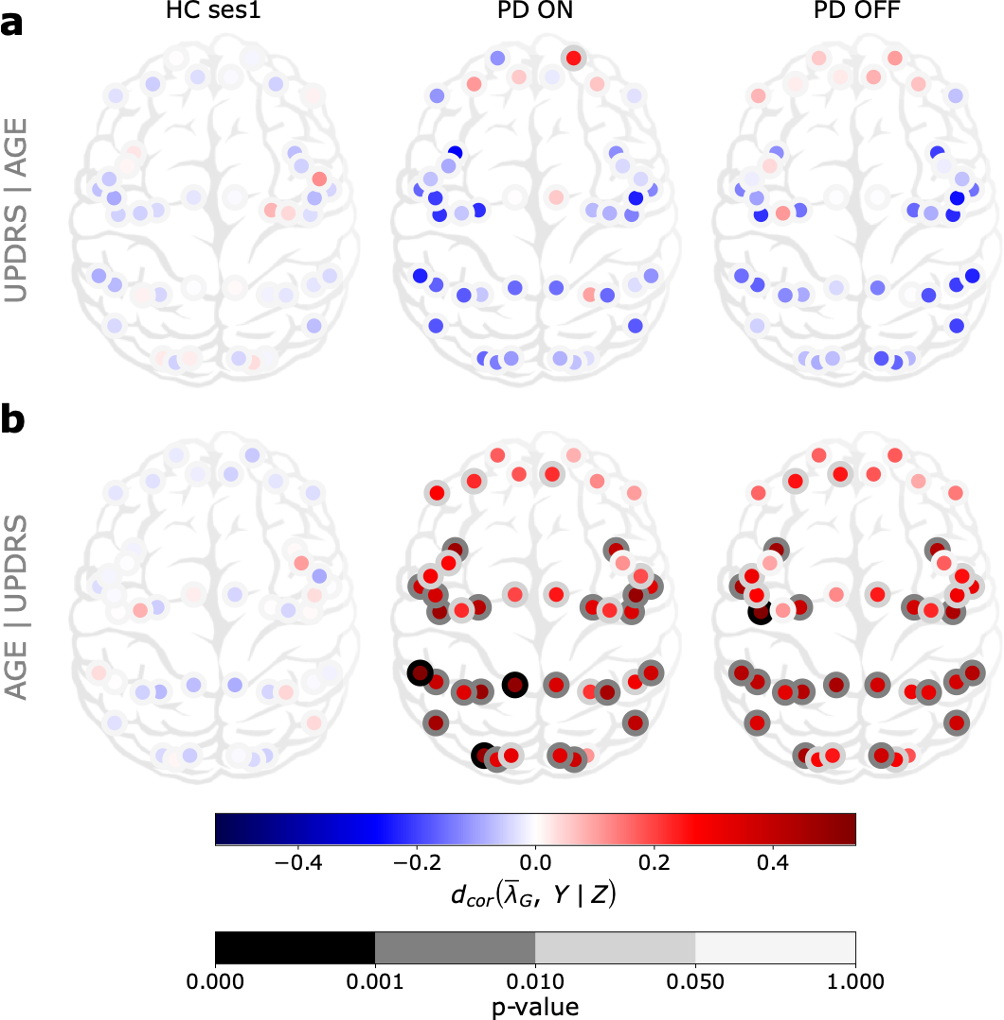
Figure 5: Cortex-wide distribution of partial distance correlation between the mean
over time of 𝜆G and Y knowing Z for each group G ∈ {HC ses1, PD ON, PD OFF }.
Concluding remarks
Overall, we show that the aperiodic activity, which usually has been considered as noise, gives new insights in PD and deserves more attention when analysing any neural field potentials like ECoG, LFP, EEG and MEG. Finally, previous studies showed frequency slowing in relation to cognitive decline rather than the motor symptoms. It could then be that the change in 𝜆 is a more general expression of neurodegeneration than only the dopamine affected systems.
Usually PD-related dynamics of cortical (especially that of sensory regions) is not studied much, neither in human patients nor in animal models. Our work makes a strong case to systematically study how neural dynamics and neural circuits are altered in the sensory regions using animal models of PD.
[1] McGregor, M. M. & Nelson, A. B. Circuit Mechanisms of Parkinson’s Disease. Neuron 101, 1042–1056 (2019).
[2] Kalia, L. V. & Lang, A. E. Parkinson’s disease. The Lancet 386, 896–912 (2015).
[3] Hari, R. & Salmelin, R. Magnetoencephalography: From SQUIDs to neuroscience. NeuroImage 61, 386–396 (2012).
[4] Baillet, S. Magnetoencephalography for brain electrophysiology and imaging. Nature Neuroscience 20, 327–339 (2017).
[5] Gao, R., Peterson, E. J. & Voytek, B. Inferring synaptic excitation/inhibition balance from field potentials. NeuroImage 158, 70–78 (2017).
Follow the Topic
-
npj Parkinson's Disease

This journal publishes original basic science, translational and clinical research related to Parkinson's disease, including anatomy, etiology, genetics, cellular and molecular physiology, neurophysiology, epidemiology and therapeutic development and treatments.
Your space to connect: The Psychedelics Hub
A new Communities’ space to connect, collaborate, and explore research on Psychotherapy, Clinical Psychology, and Neuroscience!
Continue reading announcementRelated Collections
With Collections, you can get published faster and increase your visibility.
Cognition - preclinical models, and preclinical unmet need
Publishing Model: Open Access
Deadline: Jul 27, 2026
Environmental risk factors for Parkinson’s disease
Publishing Model: Open Access
Deadline: May 13, 2026
Please sign in or register for FREE
If you are a registered user on Research Communities by Springer Nature, please sign in