dualGSEA: A New Tool for Unlocking Insights from Transcriptomic Data
Published in Cancer, Protocols & Methods, and Biomedical Research
Introduction:
Advances in sequencing technologies and the increasing availability of open, accessible data have transformed cancer research. Currently, researchers have access to a wide range molecular datasets derived from tumour tissue, alongside tools such as gene set enrichment analysis (GSEA) that help with interpretation of the data. These tools are used in combination with collections of gene signatures to highlight biological pathways involved in disease. While GSEA is great at identifying patterns across groups of samples, single sample enrichment methods often produce inconsistent results compared to pairwise methods when analysing the same data at the individual sample level.
Our study addressed this issue in a colon cancer (CC) patient cohort to look at the biology of relapse vs non-relapse disease. The data was analysed with both pairwise GSEA and single sample methods and the outputs were compared. We found that most results, while statistically significant in the pairwise methods, did not translate to meaningful biological differences when the same signatures were assessed using single sample methods, as the groups appeared biologically similar. To address this, we created dualGSEA (https://github.com/MolecularPathologyLab/Bull-et-al), a bioinformatics tool that helps researchers compare pairwise and single sample results side by side. By showing both the statistical and biological relevance of findings, dualGSEA makes it easier to identify true biological differences between groups.
Methods overview:
In this study, we investigated the similarity between different gene set enrichment methods by comparing pairwise GSEA and single sample methods. Using a CC transcriptomic dataset, we evaluated the consistency and biological relevance of results from both methods for the same biological gene signatures. The first aim of this study was to evaluate how variations of ranking metrics from differential expression analysis could influence downstream GSEA results and then compare tools for pairwise GSEA. Additionally, we aimed to determine whether single sample analyses would complement the findings from pairwise methods or reveal differences in the interpretation of results.
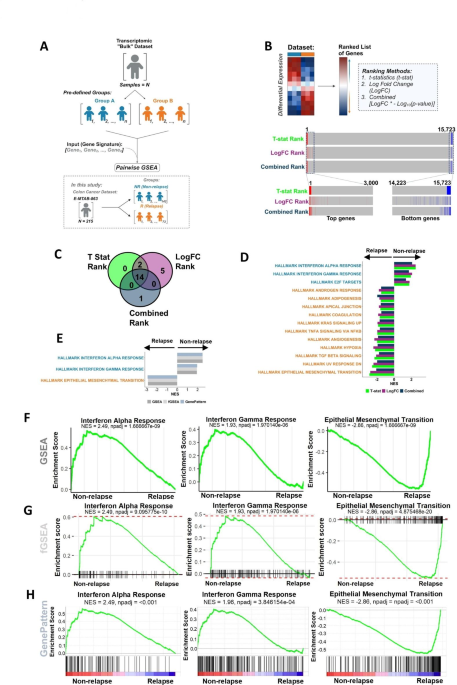
Pairwise GSEA was performed using three tools including two R packages, clusterProfiler and fgsea, and the online tool GenePattern’s GSEAPreranked (Figure 1A). From this analysis, three gene signatures that were consistently significant in pairwise analysis were then tested using two single sample methods, single sample GSEA (ssGSEA) and gene set variation analysis (GSVA) (Figure 1B). Visualisation of the single sample results revealed that between the two groups of interest, a high proportion of the samples overlapped. This led us to the development of dualGSEA, a tool that allows researchers to perform both pairwise and single sample analyses and visualise the results to see if the gene signatures are biologically relevant for the samples in the groups of interest.
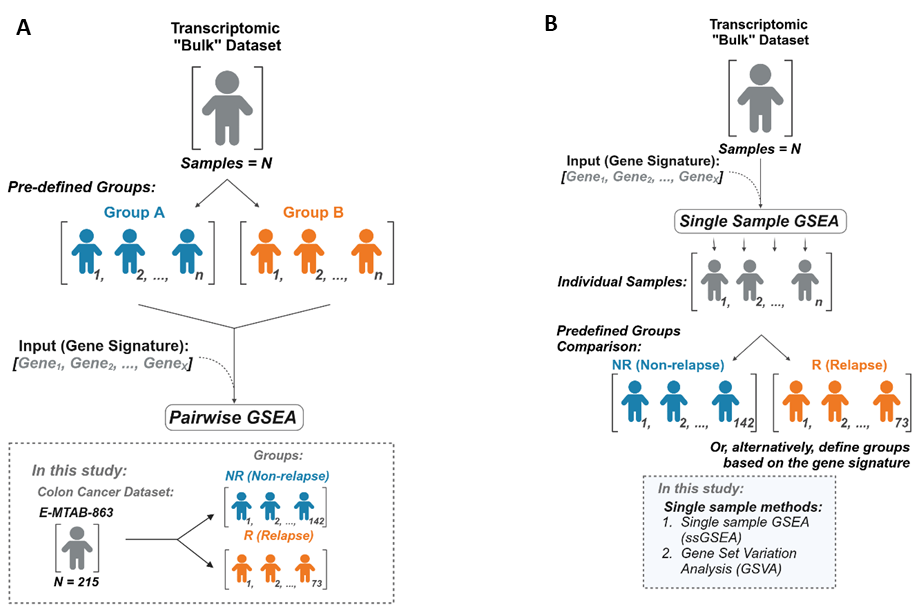
Figure 1. Pairwise and single sample workflow. (A) Overview of pairwise analysis and description of samples used in the study. (B) Overview of single sample workflow and description of samples and methods used in the study.
The dualGSEA tool uses the fgsea R package to perform pairwise analysis and the GSVA R package to perform ssGSEA as the single sample method of choice. We implemented these packages in dualGSEA as our study highlighted minimal differences between the choice of pairwise tool and minimal difference between the two single sample tools. Users can input their transcriptomic data, define their groups of interest and run the analysis with their chosen gene signatures.
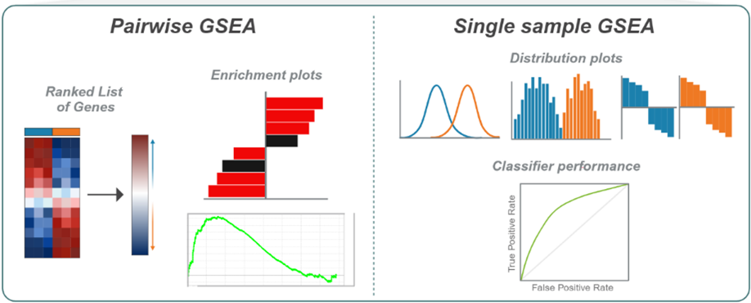
dualGSEA provides comprehensive visual outputs for both pairwise and single sample results including bar plots, enrichment plots, histograms, ridge plots, ROC curves and waterfall plots (Figure 2). These visualisations allow the user to accurately interpret their data and derive meaningful insights into the different underlying biology in their groups of interest.
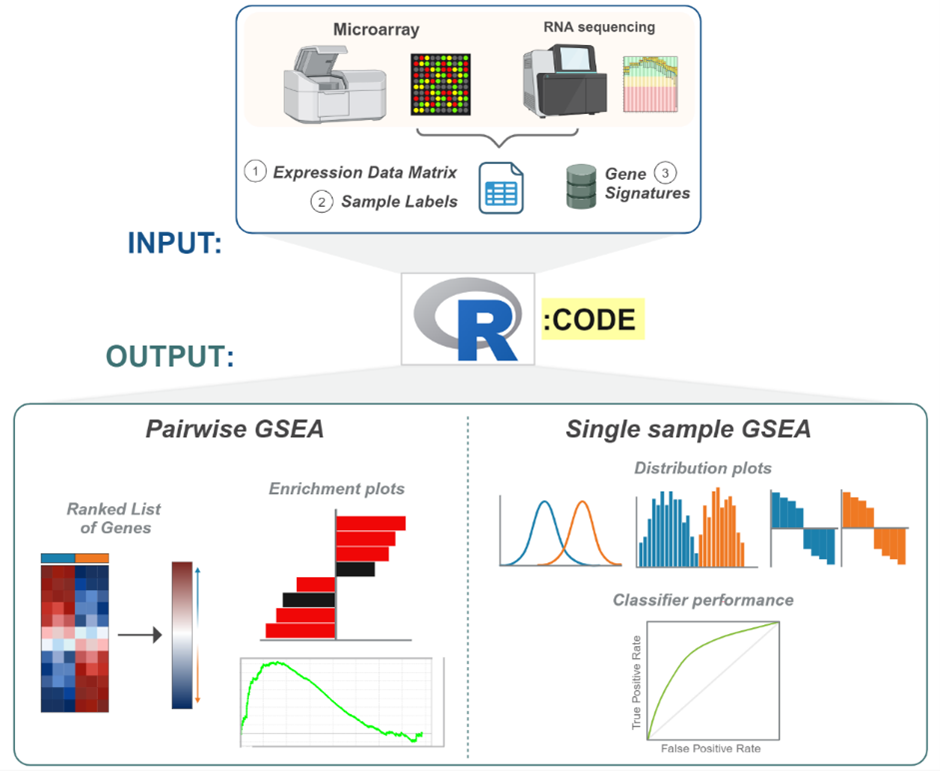
Figure 2. Schematic of dualGSEA. Inputs for dualGSEA include and expression data matrix of transcriptomic data, the sample labels and gene signatures. Pairwise outputs from dualGSEA include a ranked list of genes from differential expression analysis, bar plots of enrichment results and enrichment plots. Single sample outputs include ridge plots, histograms, waterfall plots and ROC curves.
Conclusions and Implications of this Study:
This study highlighted the importance of visualisation techniques to complement statistical results and validate biological relevance. We showed how a highly significant pairwise result does not always translate to a significant single sample result, with visualisation playing a key role in uncovering this inconsistency.
To address these challenges, we developed dualGSEA, an open-source R-based function that integrates pairwise and single sample analyses, providing comprehensive visual outputs to aid in the data interpretation. By combining both the statistical and biological insights, dualGSEA helps ensure meaningful conclusions are made from transcriptional data. This balanced approach not only reduces limitations from the using the individual methods but also supports researchers in uncovering nuanced biological insights and improving the strength of their findings.
Follow the Topic
-
Scientific Reports
An open access journal publishing original research from across all areas of the natural sciences, psychology, medicine and engineering.

Related Collections
With Collections, you can get published faster and increase your visibility.
Phytochemicals and health
Publishing Model: Open Access
Deadline: Jul 28, 2026
Health Policy and Systems Research
Publishing Model: Hybrid
Deadline: Jul 14, 2026


Please sign in or register for FREE
If you are a registered user on Research Communities by Springer Nature, please sign in