High-spatiotemporal-resolution mapping of global urban change from 1985 to 2015
Published in Sustainability

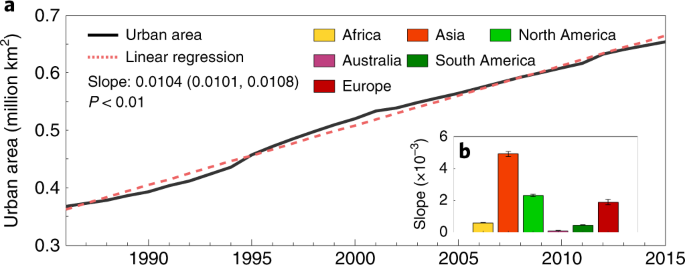
Urban land is densely populated places, and its rapid expansion is closely related to a series of environmental issues such as greenhouse effects, water pollution, heat island effects, ecosystem carbon losses, and so on. Mapping urban land changes with high spatial and temporal resolution can accurately capture the law, speed and impact of urban expansion, which is of great significance to the sustainable development of humans and nature.
For a long time, our team has been paying attention to and investigating urban land mapping with high spatial and temporal resolution, simulation of future urban land expansion, and its impact on the natural ecological environment. Examples of our work include “global projections of future urban land expansion under shared socioeconomic pathways” and “global urban expansion offsets climate-driven increases in terrestrial net primary productivity”.

High-spatiotemporal-resolution mapping of global urban change is the very foundation of studying its impacts, and thus we advanced the work step by step. Firstly, we proposed a Normalized Urban Areas Composite Index (NUACI), and proved its ability in mapping urban land in China. Then we proposed a method of NUACI and utilized the Google Earth Engine to facilitate the multi-temporal classifications of global urban land from an extensive number of Landsat images.
After the completion of previous works, our team naturally entered the annual mapping of urban land, which was more elaborate on the temporal scale. Having been proved to depict the current coverage of urban land, NUACI can also portray the progress of urban land changes with an S-shaped curve. Thus the clear change points of urban land can be detected with a regression-based method.
Having the method tested and worked in many experiments, then the accurate mapping work of the first- (1985) and last-year (2015) reference of global urban land came into our track. To solve this, many creative and constructive ideas were put forward and fully discussed, and finally a data fusion and re-classification approach was adopted. In the approach, high-confidence urban areas indicated by several other singe-phase products were collected as training samples, and other potential urban areas were classified with a random forest classifier. All these works greatly benefit from the cloud-computing, quick-programming, extensive-satellite-images-stored platform, and Google Earth Engine.
With the annual mapping of urban changes done, the urban expansion mode in continent, country and city level, occupation of land system, comparison with population growth were all taken as aspects to show the impacts of rapid urban land expansion. Moreover, such maps would also help urban planners make informed decisions regarding urban expansion in areas exposed to natural hazards, such as landslides, earthquakes, tsunamis, floods and disease. These follow-up researches are ongoing or in preparation.
At last, we are greatly thankful of all colleagues, who raise many good ideas and comments, write the paper version by version, do so much data processing, validation and mapping job.
More details please refer to: https://www.nature.com/articles/s41893-020-0521-x.
The data is free available from: https://doi.org/10.6084/m9.figshare.11513178.v1.
Follow the Topic
-
Nature Sustainability

This journal publishes significant original research from a broad range of natural, social and engineering fields about sustainability, its policy dimensions and possible solutions.
What are SDG Topics?
An introduction to Sustainable Development Goals (SDGs) Topics and their role in highlighting sustainable development research.
Continue reading announcement

Please sign in or register for FREE
If you are a registered user on Research Communities by Springer Nature, please sign in
Welcome all kinds of discussion here