Improving access to clean water and sanitation: the Water Health Open Knowledge Graph
Published in Healthcare & Nursing, Earth & Environment, and Ecology & Evolution
Explore the Research
The Water Health Open Knowledge Graph - Scientific Data
Scientific Data - The Water Health Open Knowledge Graph
Addressing the world’s water challenges demands both vision and coordination. In the context of the Water Health Open KnoWledge project (Connecting Europe Facility programme), we developed the Water Health Open Knowledge Graph (WHOW-KG) to meet one central goal: to help everyone, from policymakers to researchers, access and interpret critical data on water consumption, water quality, and health impacts more easily. By bringing datasets from the Italian National Institute of Environmental Research (ISPRA) and the Lombardy Region together under a single open, interoperable framework, we are paving the way for more informed decisions that can significantly improve access to clean water and sanitation.
A Shared Language for Urgent Problems
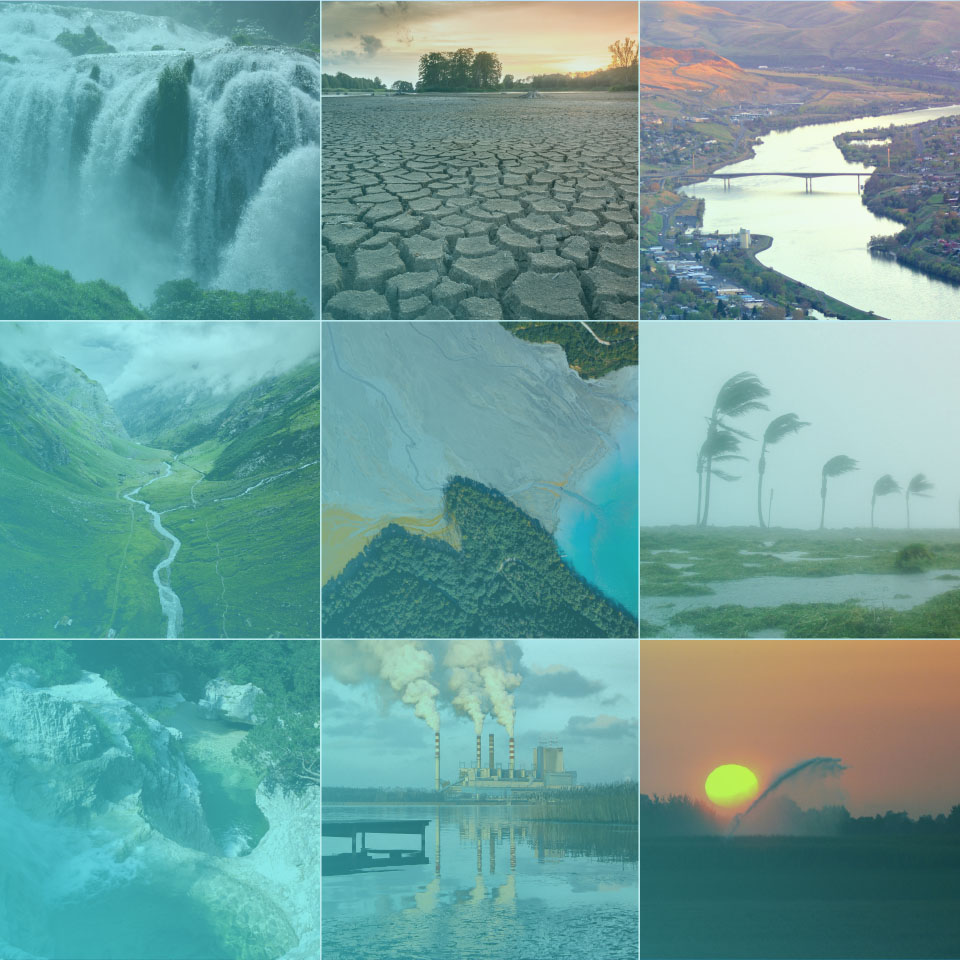
In many regions, pollution threats and rising water demands are compounded by a lack of reliable, openly shared information. Historically, each dataset on water consumption and local disease trends remained siloed within individual agencies. To break down these barriers, we created a linked data resource that harmonises information in order to gain a clearer view of how water scarcity, extreme weather, and public health are interconnected.
Why Integration Matters
Clean water is a cornerstone of human well-being, essential for sanitation, drinking, and agriculture. When local bodies or entire countries can analyse water quality parameters side by side with disease incidence, they gain new insights into the environmental drivers of public health. For example, a sudden uptick in a harmful algal bloom can be matched with a spike in respiratory conditions: the more finely we can see these connections, the better positioned we are to prevent crises and protect communities.
Use Cases: Where Water Meets Health
We focused on three main use cases when developing the WHOW-KG:
- Contaminants in Marine Waters: Coastal areas face increasing challenges, such as algal blooms like Ostreopsis Ovata or chemical pollutants. Through the WHOW-KG, we provide a unifying semantic model to integrate data on which contaminants appear in marine environments.
- Water Quality for Human Consumption: Safe drinking water lies at the heart of the United Nations’ Sustainable Development Goals. The knowledge graph records the levels of harmful chemicals and bacteria in water used for human consumption, aligning these data with recognised standards and directives. By doing so, we give users of the WHOW-KG a way to quickly verify information, for example whether a specific water body meets potability thresholds.
- Extreme Meteorological Events: Climate-induced weather extreme events are redefining how we manage water resources. By adding rainfall, snowfall, and temperature anomalies into our knowledge graph, we make it possible to investigate if these events exacerbate pollutant levels or put certain regions at higher risk for disease outbreaks.
Our Distributed, Sustainable Approach
Rather than forcing all data into one massive, centralised repository, we maintain a distributed system of SPARQL endpoints. In practice, this means data remains under the direct control of each provider who can update records without sacrificing local autonomy. This fosters a stronger sense of ownership, while ensuring that data remain accurate and timely. Because we built the WHOW-KG on open, FAIR-compliant principles (Findable, Accessible, Interoperable, Reusable), our platform serves the broader community: existing datasets can keep expanding, and new partners can join without starting from scratch.
A Bridge to Better Policy
The potential impact of the WHOW-KG extends well beyond academic research. Over the course of our co-creation program, involving 77 participants across different EU nations, we consistently found that policymakers and environmental practitioners lack immediate access to connected, up-to-date data. We recognised that the key to more robust decision-making lies in having a complete overview, from chemical pollutants to local public health trends. By uniting these data into the WHOW-KG, with more than 100 millions RDF triples, we help create a more precise evidence base for drafting water protection laws, regulating pollutants, and planning for climate resilience.
Next Steps: Scaling Up for Greater Impact
We encourage water agencies, public health institutions, journalists, and others to adopt and adapt our framework, enrich it with their own local data, and collectively raise the visibility of hidden trends or potential hazards.
Our knowledge graph simply binds these efforts together. Moving forward, we want to enhance multilingual coverage for all European (and potentially global) regions, refine validation steps for data ingestion, and create simpler dashboards so that local leaders can read complex datasets at a glance. We are also experimenting with AI-driven approaches for various aspects of Knowledge Graph generation and enrichment, from entity linking to ontology generation.
Redefining Access to Water and Health Data
At its core, the WHOW-KG represents a move toward more accessible, comprehensive water and health data. By bridging once-disconnected silos and empowering data owners to publish openly, we amplify our collective ability to safeguard clean water and promote equitable sanitation. This shared resource is a catalyst for forward-thinking policies, cross-border collaborations, and, ultimately, measurable improvements in public health and environmental resilience.
Useful Resources:
- Project Website: https://whowproject.eu/
- GitHub Repository: https://github.com/whow-project
Follow the Topic
-
Scientific Data
A peer-reviewed, open-access journal for descriptions of datasets, and research that advances the sharing and reuse of scientific data.

Related Collections
With Collections, you can get published faster and increase your visibility.
Computer vision in plant science and agriculture
Publishing Model: Open Access
Deadline: Oct 10, 2026
Wearable and Computer Vision Data for Health and Behaviour Research
Publishing Model: Open Access
Deadline: Aug 08, 2026

Please sign in or register for FREE
If you are a registered user on Research Communities by Springer Nature, please sign in