It’s not all bad news for UK biodiversity!
Published in Ecology & Evolution

When we think of trends in biodiversity, we automatically think that everything is going down. And of course, there are examples species or groups of species are declining. For example, for UK biodiversity, we know that the index of farmland bird abundance has dropped by 50% since 1970 and that the index of specialist butterfly abundance has dropped by 45% since 1976. And similar trends have been shown worldwide for other groups and species. However, what we have been able to show in our recent paper is that it is not all bad news!
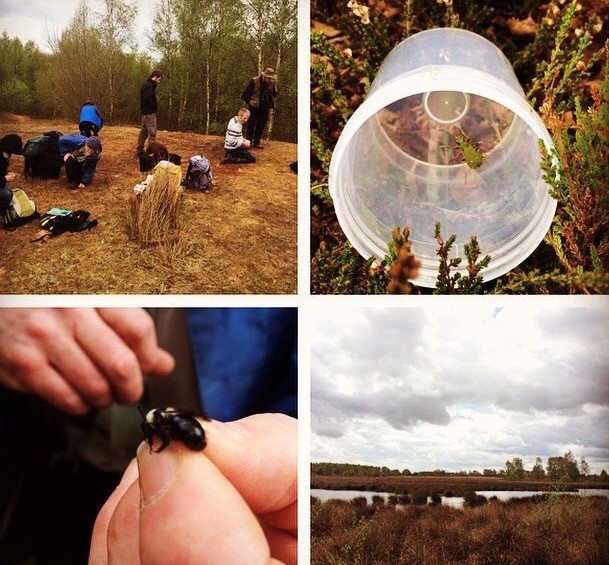
Using a dataset that estimated the annual occupancy of over 5000 species that myself and co-authors published last year (see paper and associated blog), we were able to look at the patterns over time in the distribution, or occupancy, of UK species. Specifically, we looked at various invertebrate groups, mosses and lichens. These groups are generally understudied in terms of large-scale, long-term trends, and for a lot of these groups this was the first attempt to determine annual estimates of occupancy.
Our species were separated into four groups:
- Freshwater species – this includes things like caddisflies, mayflies and freshwater molluscs.
- Bryophytes and lichens – only 2 things in this group but there were over 1000 species of moss and lichen that we had data for.
- Terrestrial insects – this contained a lot of different groups including ladybirds, wasps, soldierbeetles, fungus gnats and weevils.
- Other invertebrates – this group was made up of spiders, centipedes, millipedes and terrestrial molluscs.
For each of these groups, we looked at the change in occupancy over time from 1970 to 2015 and looked at the variation in responses within and between groups. Of course, we did find that a lot of species and one of the main groups, the “other invertebrates”, that were, on average, declining. This is what we expected since we know that the major drivers of biodiversity change, such as land-use change and climate change, have a negative effect on biodiversity. However, we also found that some species and groups showed an increase in occupancy since 1970.
The most striking response was that seen for the freshwater species. This group showed a strong decline between 1970 and the mid-90s and since then has recovered back to 1970 levels. This U-shaped response in not something that we often see when we look at biodiversity trends, but it suggests that this group is starting to recover after experiencing a large decline. We weren’t able to test what exactly caused this decline and subsequent recovery, however, the timing of the change towards a positive trend coincides with the implementation of the European Urban Wastewater Treatment Directive. This was legislation that was put in place in the UK to ensure that wastewater was treated in a specific way to reduce the levels of pollutants in rivers.
We also saw an average increase in the occupancy of mosses and lichens since 1970. Mosses and lichens are known to be sensitive to air pollution. In the UK, policy such as the Clean Air Act has led to reduction in air pollutants and it looks like these sensitive species have benefitted from the improvements in air quality over time.
Within the terrestrial insect group, there was a lot more variation in trends than was seen in the other groups. Since this is such a diverse group, it is likely that they are affected by a number of different drivers. Work will be needed to identify what these drivers are. However, it is clear that if measures are put in place to limit the drivers responsible for the impacts, then positive change can occur.
See the paper for a more in-depth look at how biodiversity in the UK has changed since 1970!
Follow the Topic
-
Nature Ecology & Evolution
This journal is interested in the full spectrum of ecological and evolutionary biology, encompassing approaches at the molecular, organismal, population, community and ecosystem levels, as well as relevant parts of the social sciences.

Related Collections
With Collections, you can get published faster and increase your visibility.
Understanding species redistributions under global climate change
Publishing Model: Hybrid
Deadline: Dec 31, 2026

Please sign in or register for FREE
If you are a registered user on Research Communities by Springer Nature, please sign in