Mapping anxiety disorder-associated genes in space and time
Published in Neuroscience, Protocols & Methods, and Genetics & Genomics

A primer on anxiety disorders
Anxiety disorders (ADs) are one of the top ten most prevalent health-related disabilities in the world, affecting more than 280 million people. ADs have a substantial genetic basis. This can be seen from their moderate tendency to get inherited within families. There are different AD subtypes characterized by specific clusters of clinical symptoms. People with a specific AD subtype often have another subtype at the same time, with this comorbidity risk going up to 68%. This shows that the genetic basis is often shared between the subtypes.
What did we investigate?
Geneticists and genomic scientists across the globe have used targeted gene sequencing and genome-wide association studies to discover mutations that predominantly occur in patients diagnosed with AD or anxiety-associated personality traits. These genetic variations have been mapped to specific genes in the human genome. At the same time, neurophysiologists have used neuroimaging techniques such as fMRI and PET to identify how activity in specific neural circuits is predictive of anxious temperament – a natural tendency for heightened nervousness or worry – in rhesus macaques. They have even used microstimulation techniques in these monkeys to implicate specific neural circuits in the production of AD symptoms such as pessimistic decision-making, a tendency to make decisions based on a negative outlook, and anticipate unfavorable outcomes.
Our team sought to bridge the gap between the genes identified in genetic studies and the neural circuitries identified in physiological studies. Specifically, we were interested in asking whether AD-associated genes are expressed in the same neural circuits identified by the imaging and microstimulation techniques.
Past studies have shown that the gene expression patterns in the brain closely correspond to how its different regions communicate (i.e., functional connectivity). This naturally leads to the exciting prospect that examining the expression patterns of disease-associated genes in various parts of the brain can help us figure out the underlying neural circuits. We hypothesized that the regions where AD-associated genes are expressed could reveal the AD neurocircuitry. To examine this hypothesis, we analyzed the spatiotemporal transcriptomic data of over 200 genes linked to four AD subtypes – generalized anxiety disorder, social anxiety disorder (SAD), obsessive-compulsive disorder (OCD), and panic disorder (PD) – in over 200 brain structures of normal human brains available in the Allen Brain Atlas.
What did we find?
Bifurcation of AD genes based on their expression patterns in three key areas of the brain
The samples from Allen Brain Atlas can be classified into two higher tiers based on brain anatomy. For example, tier 3 anterior amygdaloid area samples can be classified under tier 1 cerebral nuclei and tier 2 amygdala. Using statistical tests, we found that AD-associated genes are highly expressed in tier 3 structures belonging to three specific tier 1 structures: cerebral nuclei, midbrain, and the limbic system. We concluded that these areas are likely critical to understanding ADs and decided to examine them more closely.
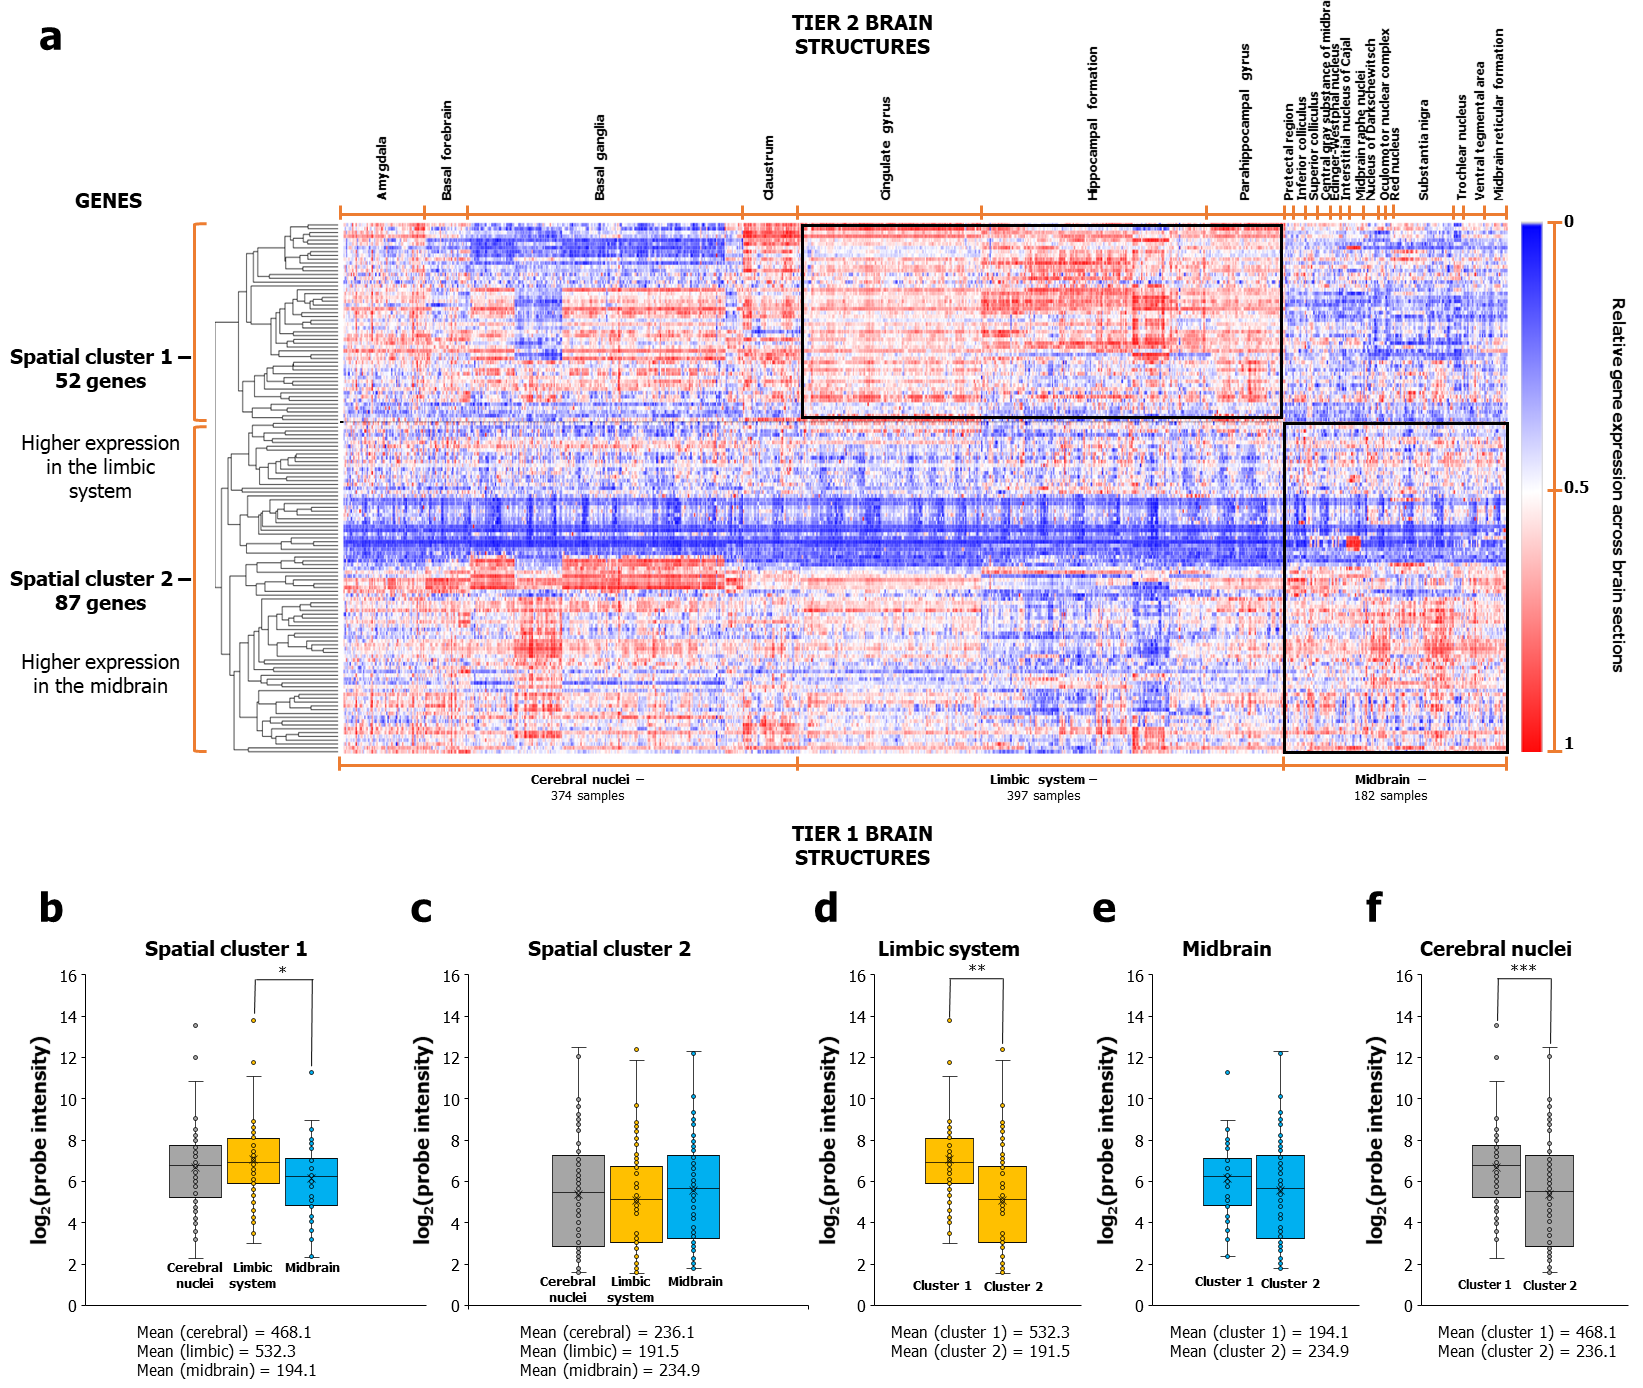
The most critical piece of our study emerged when we examined the expression patterns of the AD-associated genes in cerebral nuclei, midbrain, and limbic systems using hierarchical clustering. We immediately detected two AD gene clusters with distinct spatial expression profiles (Figure 1), the 'limbic-associated spatial cluster 1' highly expressed in the limbic system and a specific set of cerebral nuclei and the 'midbrain-associated spatial cluster 2' highly expressed in the midbrain and a different set of cerebral nuclei. Encouragingly, this bifurcation could be replicated using three additional clustering methods, two independent expression datasets, and even when restricting the AD gene set to only those genes confirmed to be impacted by AD-associated variants (through eQTL studies) or differentially expressed in post-mortem brain samples from individuals with AD.
Figure 1: AD-associated genes bifurcated into two clusters based on differential expression patterns in the limbic and midbrain regions.

a The figure shows the dichotomized expression of 139 AD-associated genes across 374 cerebral nuclei, 397 limbic system, and 182 midbrain samples in the Human Adult Microarray Data (Allen Brain Atlas). The two spatial clusters that emerge, marked on the left vertical axis as 'spatial cluster 1' and 'spatial cluster 2', show high expression in the limbic system and midbrain structures, respectively (see the expression levels enclosed in black boxes). In b, note the higher mean expression of spatial cluster 1 in limbic samples than in midbrain samples. This trend persists even when contrasted with the limbic expression of spatial cluster 2, as seen in d. Spatial cluster 2 showed higher mean expression in midbrain samples than limbic samples, as seen in c, albeit in a statistically non-significant manner, possibly due to greater expression variance compared to spatial cluster 1.
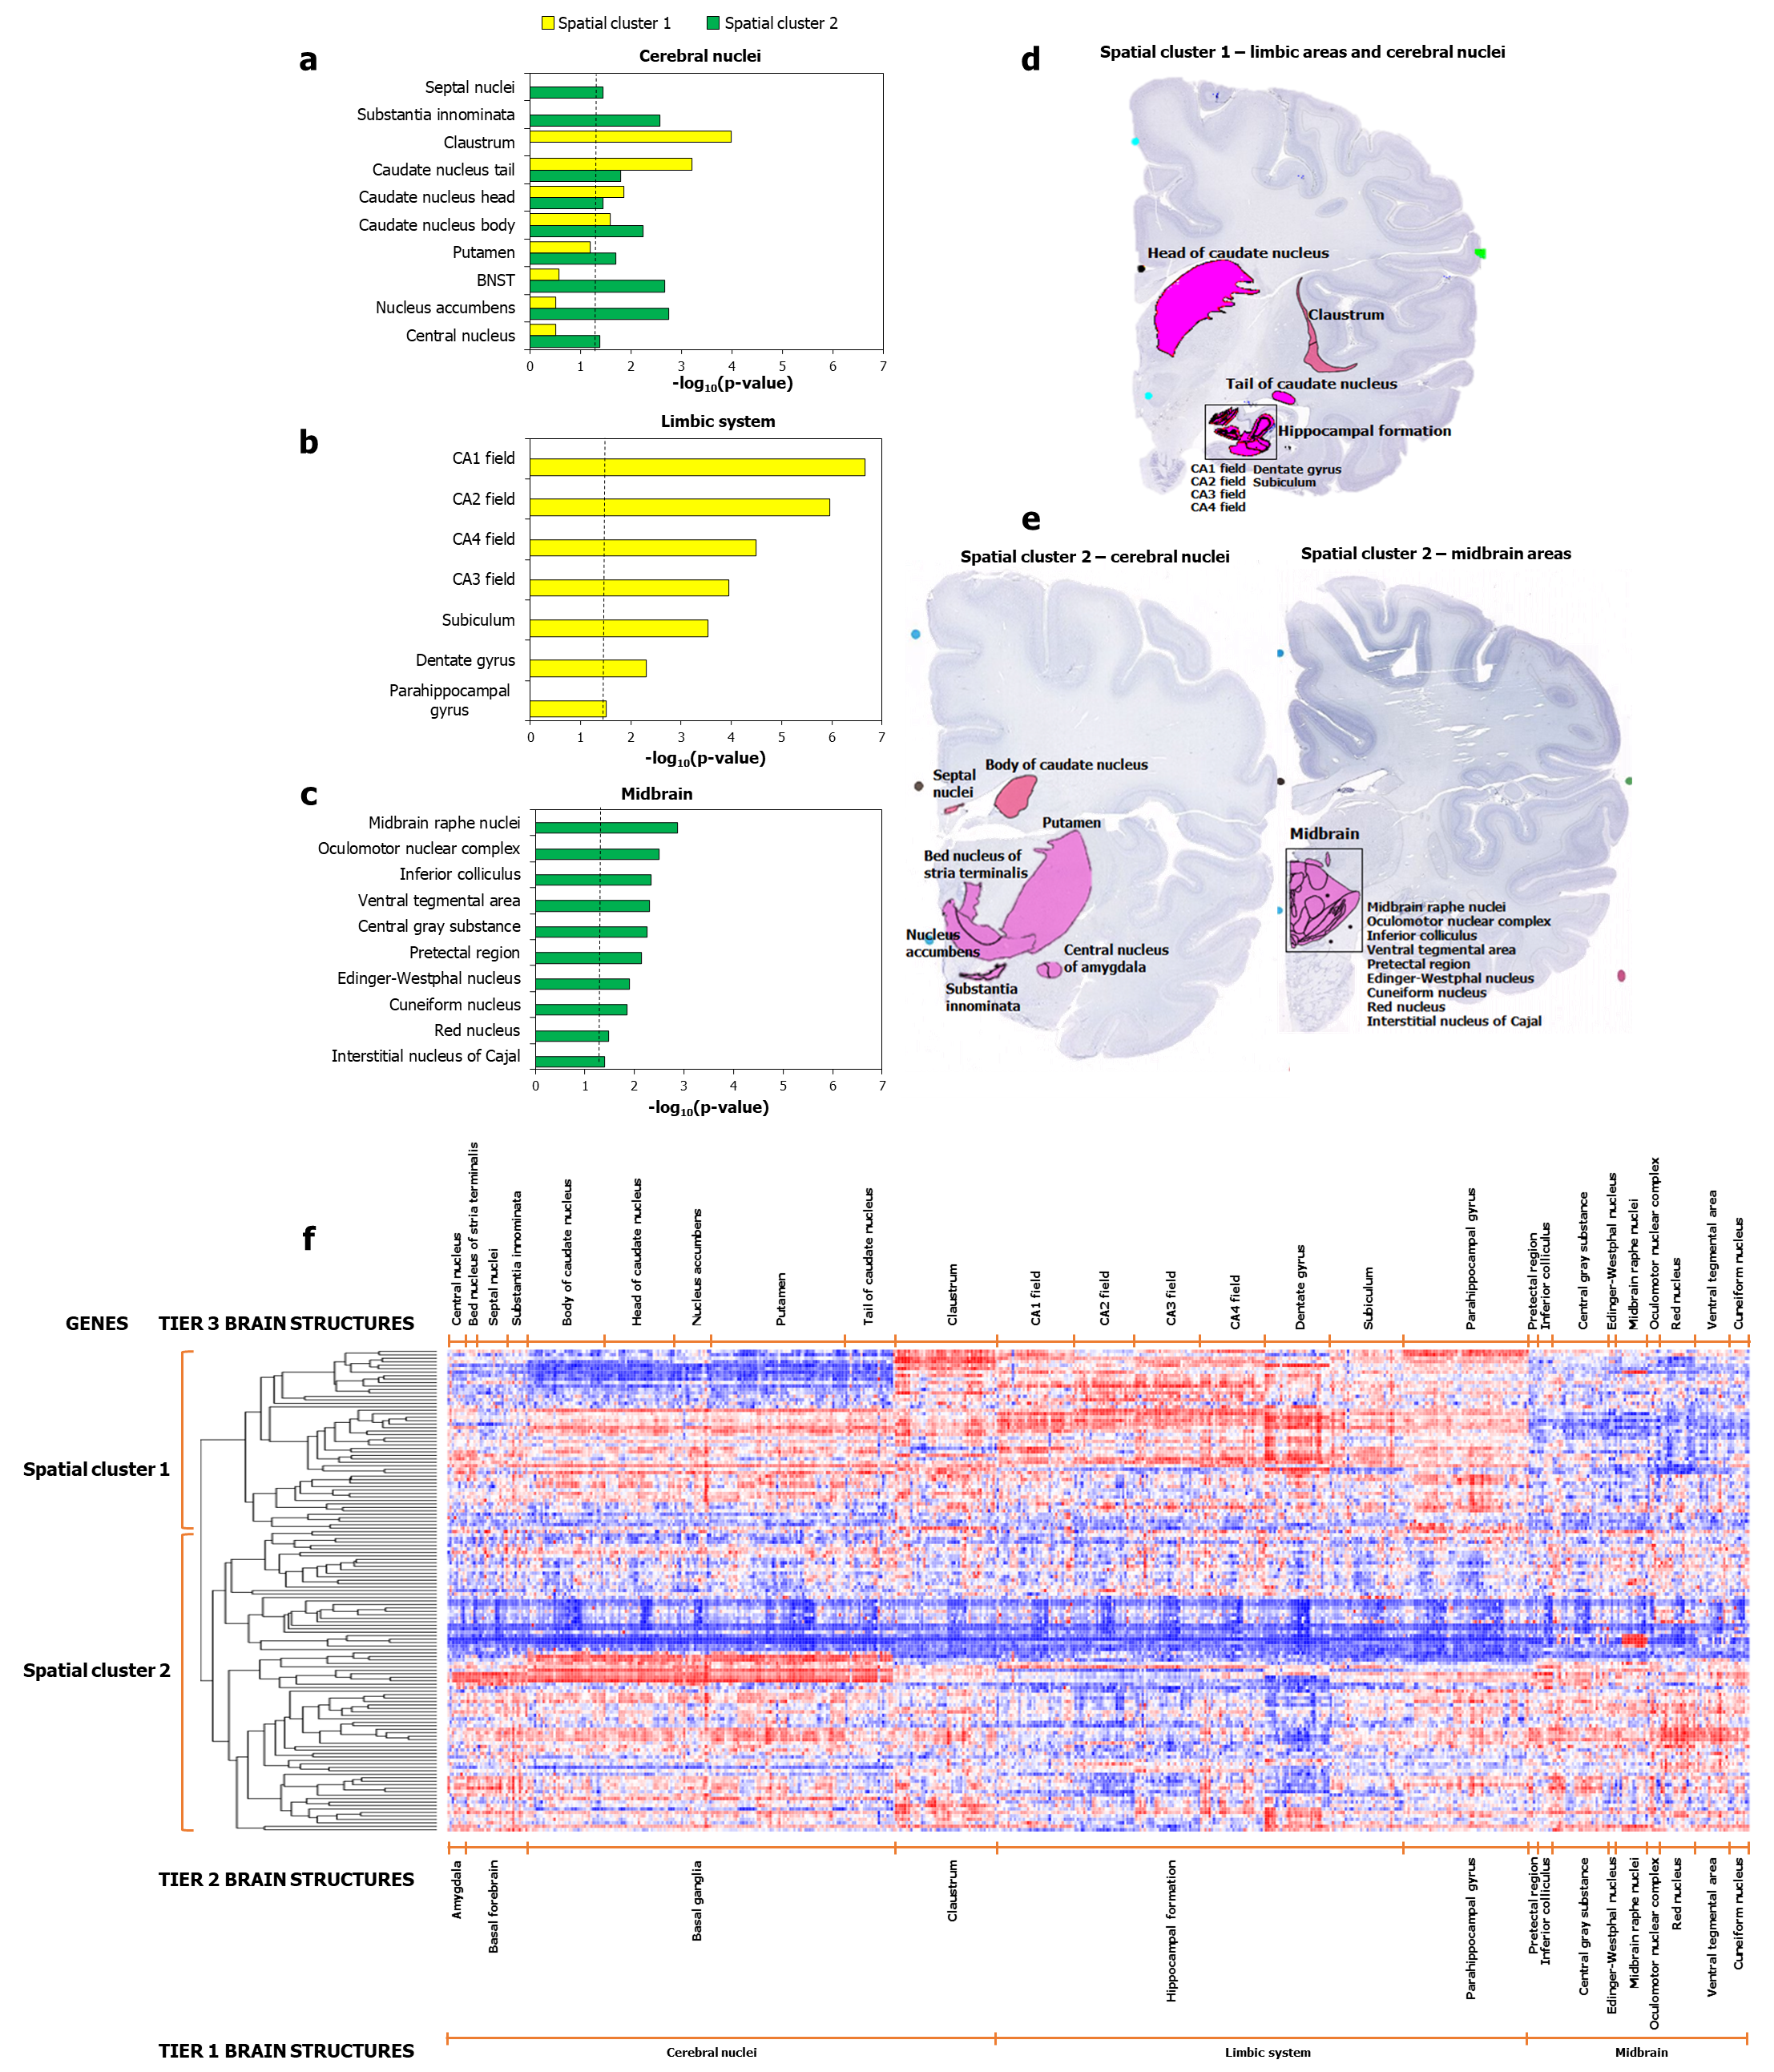
We observed the exclusive enrichment of spatial clusters 1 and 2 in specific tier 3 limbic and midbrain areas, respectively (Figure 2). This further clarified the distinction between the two spatial clusters. In addition, we found that specific cerebral nuclei were either preferentially or exclusively enriched in spatial cluster 1 or spatial cluster 2. Most importantly, earlier physiology research suggested that these brain structures are involved in regulating AD behaviors, specifically, the ventral tegmental area and the striatum in pessimistic decision-making [1, 2] and the bed nucleus of stria terminalis, the hippocampal system and the periaqueductal gray in anxious temperament in rhesus monkeys [3, 4]. Intriguingly, pessimistic decision-making and anxious temperament in monkeys align with state and trait anxiety states in humans. State anxiety is a temporary and situational feeling of worry that arises in response to a specific event. On the other hand, trait anxiety is a consistent tendency to experience anxiety across various situations.
Figure 2: Spatial cluster 1 and spatial cluster 2 showed differential enrichment patterns in specific regions.

The figure shows the enrichment of spatial cluster 1 and spatial cluster 2 for genes showing relatively higher expression in a cerebral nuclei samples, b limbic systems samples, and c midbrain samples, compared to other regions. Note the exclusive enrichment of spatial cluster 1 and spatial cluster 2 genes in b limbic and c midbrain areas and the preferential enrichment of the two clusters for a specific cerebral nuclei. The dotted black line in a-c indicates the cut-off value for –log10(p-value) after correction for multiple hypotheses using the Benjamini-Hochberg method. d-e show the specific areas in which spatial cluster 1 and cluster 2 genes are highly expressed, highlighted against the background of Nissl-stained images. f Dichotomized expression of 139 AD-associated genes across the enriched regions shown in a-c.
Altogether, our findings indicated that neural systems underlying the spatial clusters were distinct. We further hypothesized that when these gene groups are disrupted, they could produce different behaviors and impact different signaling pathways, gene networks, and cell types. We investigated these aspects through enrichment analyses.
Functional characterization of the AD gene clusters
Upon closely examining the expression patterns with additional techniques, we found that the segregation of spatial clusters 1 and 2 was influenced by OCD and PD genes, linking them to different behaviors. The two clusters also showed distinct, though statistically non-significant, enrichment patterns for subtype-specific genes. Adding genes linked to post-traumatic stress disorder (PTSD) revealed the bifurcation of spatial cluster 2 into two clusters associated with specific subsets of midbrain structures. Notably, one of these clusters showed strong enrichment signals for PTSD and SAD, establishing a clear link between one of our spatial clusters and specific AD subtypes.
Spatial cluster 1 was involved in glutamatergic receptor signaling, while spatial cluster 2 was associated with serotonergic and dopaminergic signaling, supporting their regional and subtype specificities. Hence, there likely existed a dichotomy in AD neurophysiology. We noted that the proteins encoded by the spatial cluster genes were highly interconnected in the human protein-protein interaction network, indicating their functional cohesion. Also, we independently identified sub-networks enriched for the two spatial clusters from the 'AD network', composed of functional associations and physical interactions among proteins encoded by AD-associated genes. These sub-networks recapitulated the region-specific and pathway-related characteristics of the spatial clusters. Additionally, spatial cluster 1 was enriched for excitatory cell markers, aligning with its association with glutamate signaling, while spatial cluster 2 was enriched for astrocyte and microglial markers.
Lastly, we examined the developmental transcriptome data in the BrainSpan Atlas to track the expression patterns of the AD genes over brain development. We found that the two spatial clusters have two distinct and negatively correlated temporal identities with twin peaks at specific developmental stages. Spatial cluster 1 is highly expressed during late infancy and adulthood, and spatial cluster 2 during late prenatal stage and early childhood. Hence, mutations in AD genes might disrupt the normal timing of their expression, potentially impacting the development of signaling pathways and neural circuits, and producing AD symptoms.
In summary, we discovered two sets of AD genes. These gene clusters are enriched in distinct locations and functions and have differently timed expression patterns within the brain. Investigating these gene clusters further could provide valuable insights into the underlying causes of AD.
References
- Amemori, K.-i. and A.M. Graybiel, Localized microstimulation of primate pregenual cingulate cortex induces negative decision-making. Nature neuroscience, 2012. 15(5): p. 776-785.
- Amemori, S., et al., Microstimulation of primate neocortex targeting striosomes induces negative decision‐making. European Journal of Neuroscience, 2020. 51(3): p. 731-741.
- Fox, A.S., et al., Intergenerational neural mediators of early-life anxious temperament. Proceedings of the National Academy of Sciences, 2015. 112(29): p. 9118-9122.
- Oler, J.A., et al., Amygdalar and hippocampal substrates of anxious temperament differ in their heritability. Nature, 2010. 466(7308): p. 864-868.
Follow the Topic
-
Translational Psychiatry

This journal focuses on papers that directly study psychiatric disorders and bring new discovery into clinical practice.
Your space to connect: The Psychedelics Hub
A new Communities’ space to connect, collaborate, and explore research on Psychotherapy, Clinical Psychology, and Neuroscience!
Continue reading announcementRelated Collections
With Collections, you can get published faster and increase your visibility.
Moving towards mechanism, causality and novel therapeutic interventions in translational psychiatry: focus on the microbiome-gut-brain axis
Publishing Model: Open Access
Deadline: May 19, 2026
From mechanism to intervention: translational psychiatry of childhood maltreatment
Publishing Model: Open Access
Deadline: Feb 28, 2026


Please sign in or register for FREE
If you are a registered user on Research Communities by Springer Nature, please sign in