Mapping future dry and humid heat risks in a warming world
Published in Earth & Environment and Ecology & Evolution
By Emily Williams, Chris Funk, Cascade Tuholske, and Pete Peterson
As the fraction of the Earth’s surface experiencing very warm temperatures increases rapidly (Figure 1), the impacts of human-caused climate change are becoming clear. From flash floods in China to heat waves in Europe to drought in the Amazon, much more frequent hydrological and thermal extremes are affecting human health and wellbeing worldwide. In recent years, globally, we’ve seen impact after impact on communities around the world due to heat-related extremes.

Figure 1. Annual estimates of the fraction of the Earth’s surface experiencing extremely warm temperatures. Results are based on standardized NASA GISS 2° land/sea temperatures anomalies, with very warm areas defined as grid cells exceeding a 1.5 standardized anomaly, based on a 1991-2020 baseline period. The three most recent strong El Niños (defined as events with Nino3.4 sea surface temperature anomalies of +2°C or greater) are indicated in red. During the 2016 and 2023 El Niño years, the area of the Earth’s surface exposed to extreme warmth was unprecedented. Inset: Estimates of extremely warm (99th percentile) daily maximum air temperatures in July. Based on 1983-2016 CHIRTS data.
The geographical scope of extreme warmth is increasing at an alarming rate (Figure 1). Coarse temperature grids, like the NASA GISS dataset, provide compelling evidence that extremely rapid increases have already occurred in the fraction of the planet exposed to very warm air temperatures. During the 2016 and 2023 El Niños, about 17 and 23 percent of the planet experienced extreme warmth, respectively. As the global combustion of fossil fuels continues, such events will intensify in the near future (2030), and even more so by mid-century (2050).
Reducing harm from future climate extremes requires work from many different disciplines and sectors. However, the ability to accurately monitor and project the intensity and relative frequency of these extremes is a particularly important tool to support these efforts. Yet, as with many other resources, there is a highly inequitable distribution of infrastructure to monitor hydrological and thermal extremes. Indeed, while many countries in the Global North have high densities of weather station data, there are large swaths of the Global South with only a handful of stations for an entire country. As a result, because they require historical observations to calibrate, climate projections do not provide sufficiently detailed information to anticipate future extremes for many places in the Global South. Yet the cruel irony is that for some of these places, both dry heat and humid heat extremes are currently the most intense, and are projected to further intensify.
To help us understand and quantify risks in poorly instrumented regions, the Climate Hazards Center has spent years developing the monthly and daily satellite-enhanced ‘Climate Hazards Infrared Temperature with Stations’ (CHIRTS) data sets. These data sets begin with very high resolution (0.05°) long term mean fields. Long time series of geostationary thermal infrared weather station observations are then combined with interpolated station data to produce monthly CHIRTS fields. ERA5 reanalysis fields are then used to generate daily temperature fields, by adding a set of ERA5-based intra-monthly variations to the monthly CHIRT5 mean.
ERA5 relative humidity values are then used with the daily temperature values to calculate ‘Wet Bulb Globe Temperatures’ (WBGT), a measure of humid heat extremes, and ‘Vapor Pressure Deficits’ (VPD), which quantify atmospheric moisture demand and dry heat stress. VPD, as a measure of hot-dry conditions, is strongly related to drought conditions. High VPD is associated with poor vegetation conditions, reduced crop yields, and increased drought conditions. Conversely, WBGTmax measures the intensity of humid heat and is widely used to measure occupational heat stress, as well as humid heat extremes related to increased morbidity and mortality. We have recently explored the rapid increases in WBGT exposure in urban areas, and negative impacts of increasing VPD on rangeland health.
The key advantage of the CHIRTS archive is its low bias and high spatial and temporal resolution. A map of July 99th percentile Tmax values, for example (inset in Figure 1), identifies extremely warm temperatures in low-lying, densely populated and humid areas of South Asia. Intersecting such extreme heat regions with areas of high population or agricultural production, supports informative risk assessments.
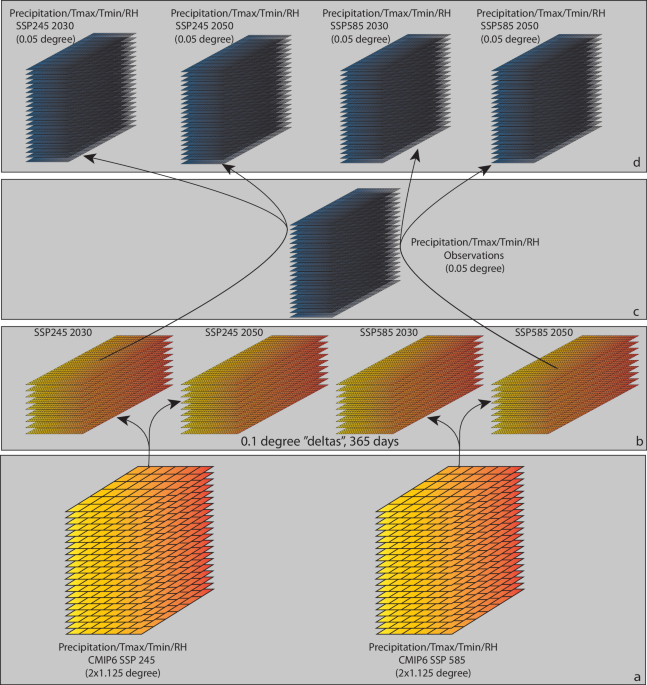
To carry such risk assessments into the near future, we have created the Climate Hazards Center Coupled Model Intercomparison Project Phase 6 climate projection dataset (CHC-CMIP6). This archive begins with daily observed, 1983-to-2016, 0.05° Tmin, Tmax, and relative humidity (RH) values, and WBGT and VPD derived from these fields. For each variable (Tmin, Tmax, and RH) we then estimated four sets of high-resolution daily climate change perturbations based on two time periods (2025-2035 and 2045-2055) and two climate change scenarios - the ‘most likely’ Shared Socioeconomic Pathway (SSP) 2-4.5 and ‘worst case scenario’ SSP 5-8.5 Scenarios. The observations and climate change perturbations are then combined. For a given location and day, the observed Tmin, Tmax, and RH values were shifted up or down based on associated climate change perturbation. In effect, this provides a set of observations situated in a warmer world.
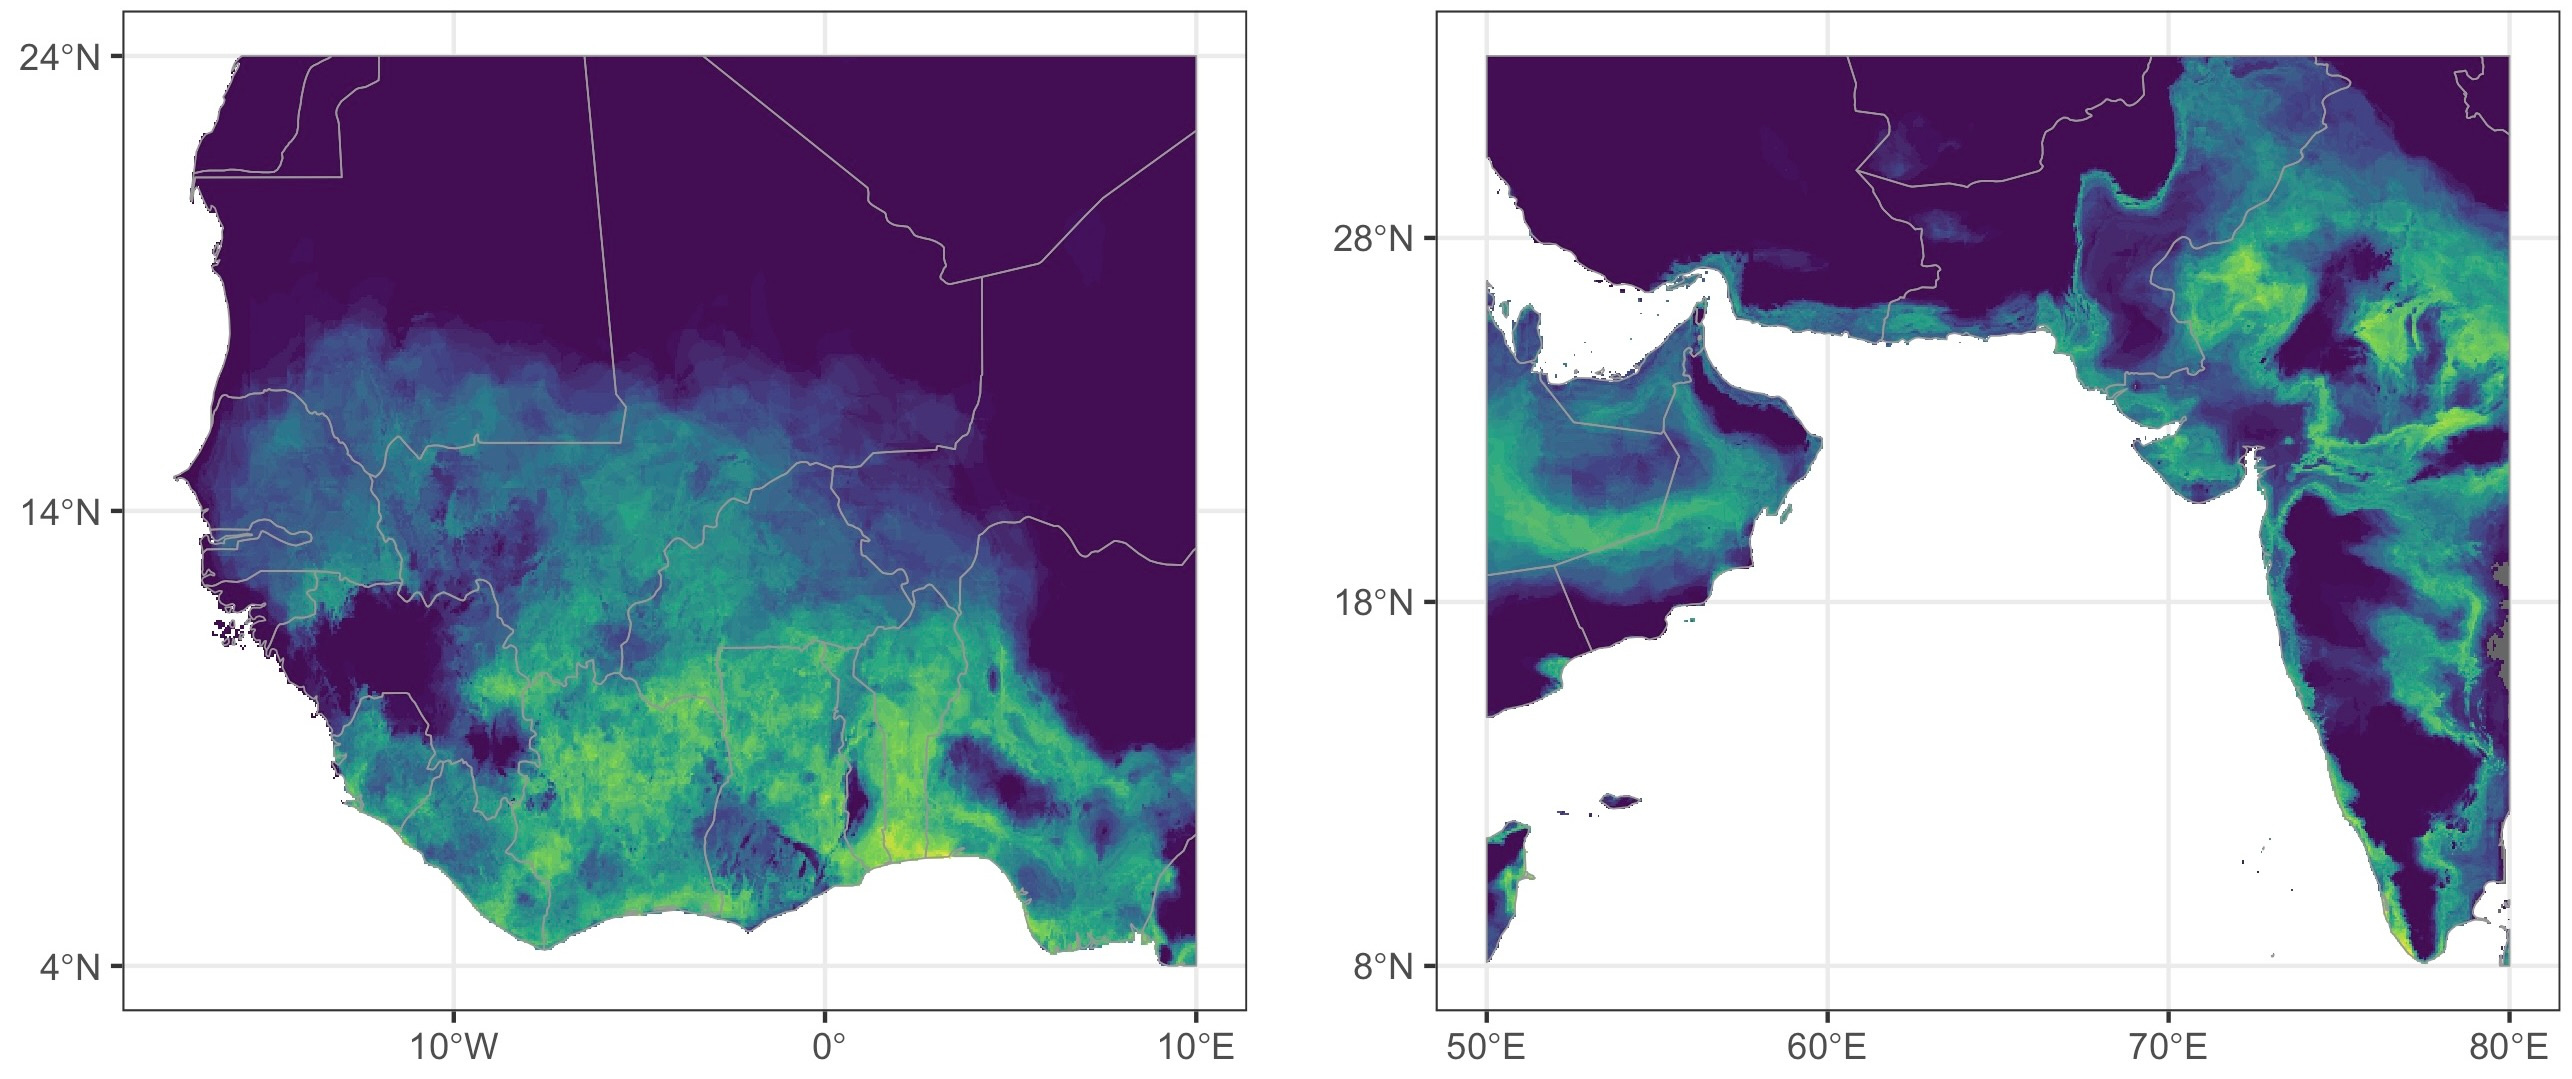
Thus, CHC-CMIP6 allows us to estimate what daily weather from 1983-2016 would look like under 2030 and 2050 climates for SSP 2-4.5 and SSP 5-8.5 scenarios. For example, Figure 2 illustrates how the number of extreme WBGTmax days are expected to increase in hot seasons under the SSP 5-8.5 scenario. In many areas of western Africa and southern Asia, these regions are anticipated to experience a substantial increase in the number of extreme WBGTmax days during the local hottest month of the year. Extreme counts from the CHC-CMIP6 dataset thus allows for identifying unique regions where people are projected to be exposed to much more hot-humid extreme conditions, in a way that coarse resolution data might otherwise miss.

Figure 2. Changes in the number of WBGTmax days warmer than 30C in West Africa in April (left) and South Asia during May (right), during 1983. Based on Fig. 6 from our Scientific Data paper.
These data are freely available for anyone to access in examining heat-related extremes, and can be downloaded from our ftp site as compressed GeoTIFFs: https://doi.org/10.21424/R47H0M
Also published on the Climate Hazards Center blog: https://blog.chc.ucsb.edu/
Follow the Topic
-
Scientific Data
A peer-reviewed, open-access journal for descriptions of datasets, and research that advances the sharing and reuse of scientific data.

Related Collections
With Collections, you can get published faster and increase your visibility.
Computer vision in plant science and agriculture
Publishing Model: Open Access
Deadline: Oct 10, 2026
Wearable and Computer Vision Data for Health and Behaviour Research
Publishing Model: Open Access
Deadline: Aug 08, 2026

Please sign in or register for FREE
If you are a registered user on Research Communities by Springer Nature, please sign in