Measuring FRET on samples with high or spatially varying autofluorescence and/or low (physiological) expression level? No need to fret anymore!
Published in Protocols & Methods
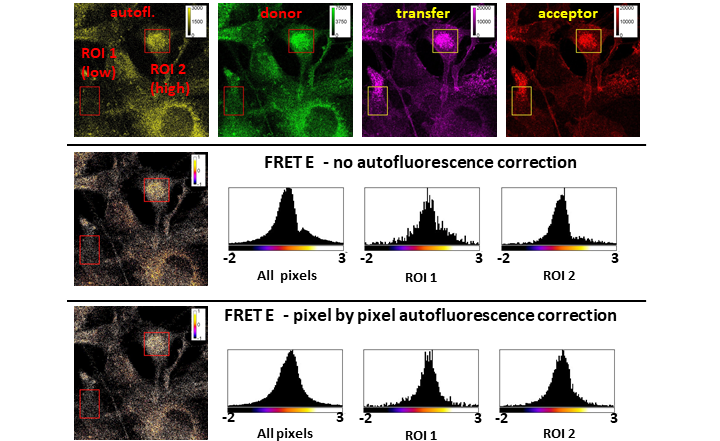
The actual interaction between signaling species in cellular processes is often more important then their expression levels. Förster resonance energy transfer (FRET) is a popular tool for studying molecular interactions, since it is highly sensitive to proximity in the range of 2-10 nm [1-3]. Spectral spillover-corrected quantitative (3-cube) FRET is a cost effective and versatile approach, which can be applied in flow cytometry and various modalities of fluorescence microscopy, but may be hampered by varying levels of autofluorescence and/or low signal to autofluorescence ratio [4]. In response to this challenge, we have developed a method for pixel-by-pixel autofluorescence correction in microscopy FRET measurements. The approach is made feasible by using a novel calibration standard slide that can be easily produced alongside the samples. Analysis of images, including automatic batch processing is supported by our ImageJ plugin available through the FIJI updater.
The 3-cube FRET method is based on measuring fluorescence in three spectrally distinct channels: the donor channel, which should be spectrally appropriate for the donor dye; the transfer channel with donor excitation and acceptor detection range, and the acceptor channel with excitation and detection suitable for the acceptor dye. Correctly describing the fluorescence intensities in each channel, both that native to the channel and the contributions from spectral spillover allows for determining quantitatively the FRET efficiency and the actual donor acceptor stoichiometry provided that spectral spillover factors and the instrument sensitivity factor are determined beforehand. As implemented earlier, this method relies subtracting an average autofluorescence contribution from each of the three channels’ signal[5]. However, when autofluorescence is high compared to the signal and/or spatially distributed unevenly, this approach can lead to under or overestimation of the FRET efficiency.
Our working hypothesis was that autofluorescence often has a spatially stable spectral signature, so by acquiring fluorescence data in a spectral channel independent of the three usual FRET channels enables us to correct each FRET channel signal by a proportional amount on a pixel by pixel basis.
Using this approach, we first showed that on a label free sample the pixel by pixel autofluorescence correction resulted in a lower standard deviation of residual values (expected to be distributed with zero mean) compared to correcting with average autofluorescence. This implied that pixel by pixel correction could also improve the reliability of FRET measurements.
Next we have developed and tested a cell-free calibration standard having close to 0 autofluorescence in the visible spectrum, allowing the precise determination of spectral spillover factors and the α calibration factor. This standard is easy and economical to make and has a long shelf life. It obviates the use of cellular samples for calibration purposes, which would contribute to each fluorescence channel with a mixture of labels and autofluorescence of unknown (and undecipherable) proportions.
We also further developed our freely available ImageJ plugin RiFRET. The new v2.0 is updated for the latest Java and Fiji releases, and is available from Fiji’s FRET Imaging update site. It not only allows for interactive, pixelwise autofluorescence corrected analysis of single images, but also for the automatic creation of quantitative FRET efficiency maps from large image sets. This latter capability is based on its use image data from the cell free calibration standards.
We tested the pixel by pixel autofluorescence correction method on bead and cell based FRET models covering a range of signal to autofluorescence ratios and FRET efficiencies and compared the approach with conventional average autofluorescence / background correction. We found, using flow cytometry measurements as a reference, that as the signal to autofluorescence ratio decreased below ~100, the microscopic determination of FRET E became increasingly inaccurate without pixel-by-pixel AF correction regardless of the actual FRET efficiency. Since in biological systems of interest signal to autofluorescence is often in this range, we next investigated such models, featuring pathologically important EGFR - integrin interactions. Here we have shown that pixel-by-pixel AF correction increases the accuracy of FRET E calculation and abolishes the bias, which is inversely proportional to the signal to AF ratio.
Overall, we conclude that the pixel-by-pixel autofluorescence correction approach is particularly recommended for cases of highly variable cellular autofluorescence and for samples with low signal to autofluorescence ratio, which is typical for physiological expression levels.
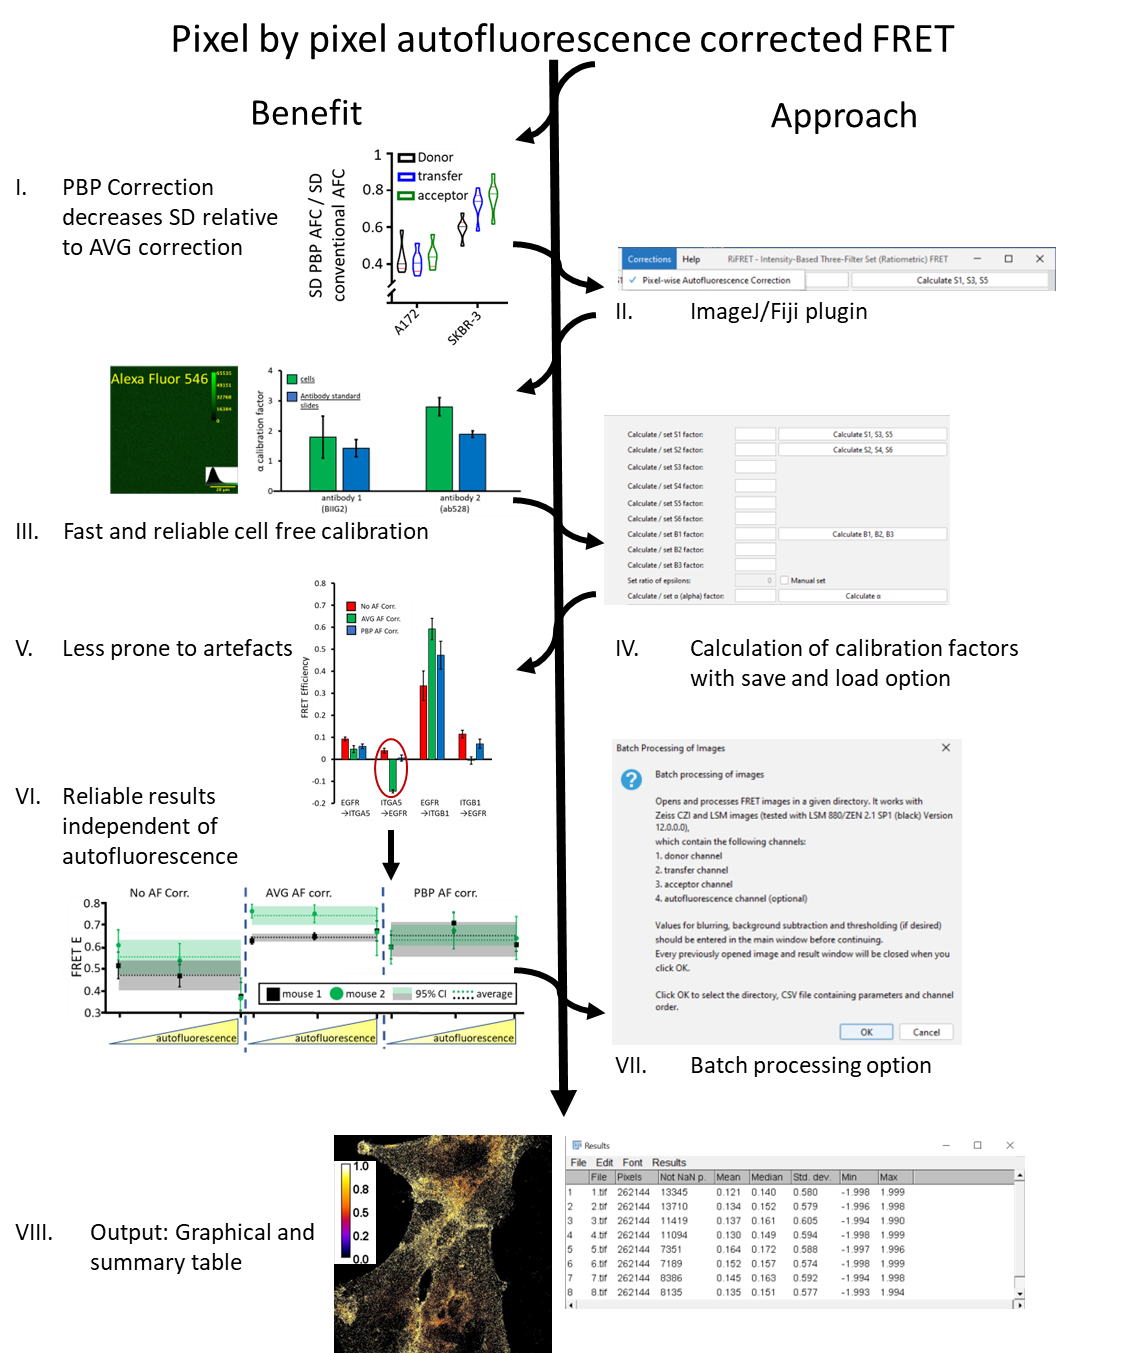
Figure 1. PBP AF corrected FRET: The approach and the benefits
I.: Ratio of the standard deviation ratio of pixel-by-pixel corrected to average corrected autofluorescence distributions on unlabeled cells. II.: Toggle switch to enable pixel by pixel autofluorescence correction in the RiFRET plugin. III.: Images of Alexa Fluor 546 conjugated trastuzumab film with pixelwise intensity distributions as inset, and α calibration factor determined on these standard slides and on A172 cells using two different antibodies. Error bars are ±SD IV.: Calibration factor menu of the plugin. V.: FRET measured between EGFR and ITGA5 or ITGB1 in both directions, with no AF correction, average AF correction and pixel-by-pixel AF correction. Red circle indicating strong artefact with average AF correction. VI.: Pixels of 12 images each from samples prepared with EGFR and ITGB1 (low and high signal, respectively) were pooled and split into low (-10—1.200), mid (1.200—2.400) and high (2.400—max) autofluorescence ranges. Average FRET E calculated with the three AF correction options (error bars representing ± 95% confidence interval) are plotted for each range and each sample. The global average for each sample and each correction method is also plotted (dashed lines) with its 95% confidence interval shown as bands of the same color. VII.: Batch processing window of the plugin. VIII.: FRET map of positive controls on A172 cells. and result table of a batch processing.
References
- Stryer, L. and R.P. Haugland, Energy transfer: a spectroscopic ruler. Proc Natl Acad Sci U S A, 1967. 58(2): p. 719-26.
- Vereb, G., et al., Cytometry of fluorescence resonance energy transfer. Methods Cell Biol. 2004.75: p. 105-52.
- Szabo, A., et al., Quo vadis FRET? Forster's method in the era of superresolution. Methods Appl Fluoresc, 2020. 8(3): p. 032003.
- Sebestyen, Z., et al., Long wavelength fluorophores and cell-by-cell correction for autofluorescence significantly improves the accuracy of flow cytometric energy transfer measurements on a dual-laser benchtop flow cytometer. Cytometry, 2002. 48(3): p. 124-35.
- Roszik, J., et al., Evaluation of intensity-based ratiometric FRET in image cytometry--approaches and a software solution. Cytometry A, 2009. 75(9): p. 761-7.
Follow the Topic
-
Scientific Reports

An open access journal publishing original research from across all areas of the natural sciences, psychology, medicine and engineering.
Related Collections
With Collections, you can get published faster and increase your visibility.
Reproductive Health
Publishing Model: Hybrid
Deadline: Mar 30, 2026
Women’s Health
Publishing Model: Open Access
Deadline: Feb 28, 2026
Please sign in or register for FREE
If you are a registered user on Research Communities by Springer Nature, please sign in