Networks become (virtual) reality
Published in Protocols & Methods
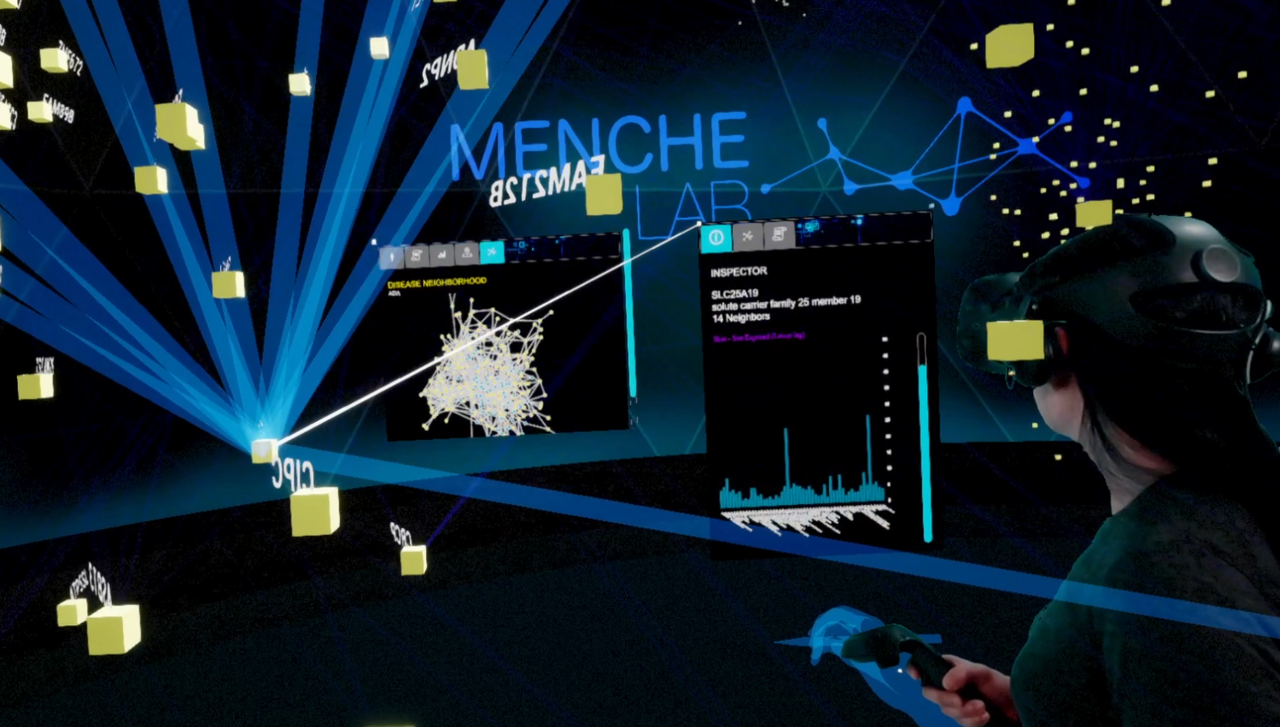
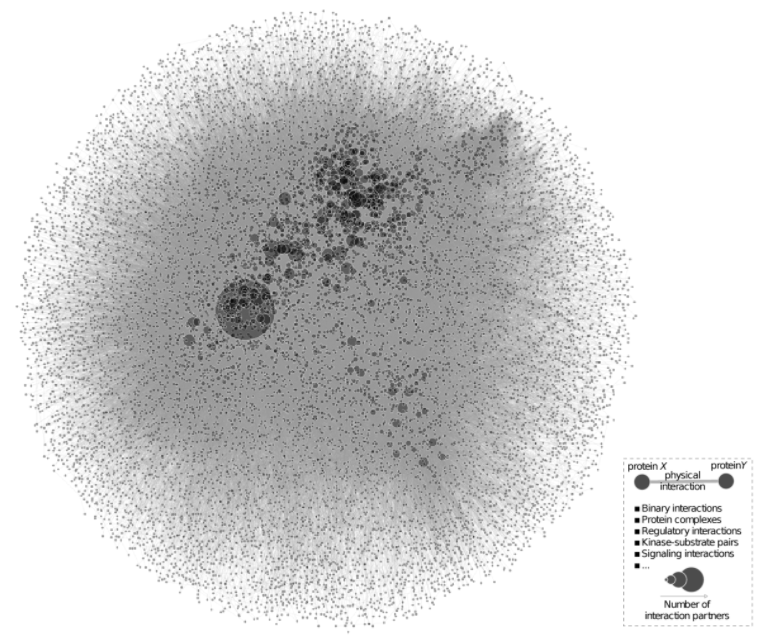
Data, data, data. It was predicted that almost 60 zettabytes of data were created, captured, copied or consumed in the last year, almost an increase of 5000% from 2010(Rydning 2017). As network scientists, we are most interested in the relationships between the data, and how different components in a complex system interact with each other. There’s a problem, though. Most interesting networks are simply too large and too complex to be visualized in a meaningful way -- most of the time we only see hairballs.
What if we could blow up this network to the size of a cathedral and stand in the middle of it? And zoom into specific parts to understand the details, or zoom out for a more global bird’s-eye view? Our goal is to connect the intuitive visual nature of networks with the powerful computational analysis tools of network theory. With virtual reality this is possible -- in our immersive VR platform, we can explore and navigate seamlessly through networks, with full six degrees of freedom and infinite scaling of network size.
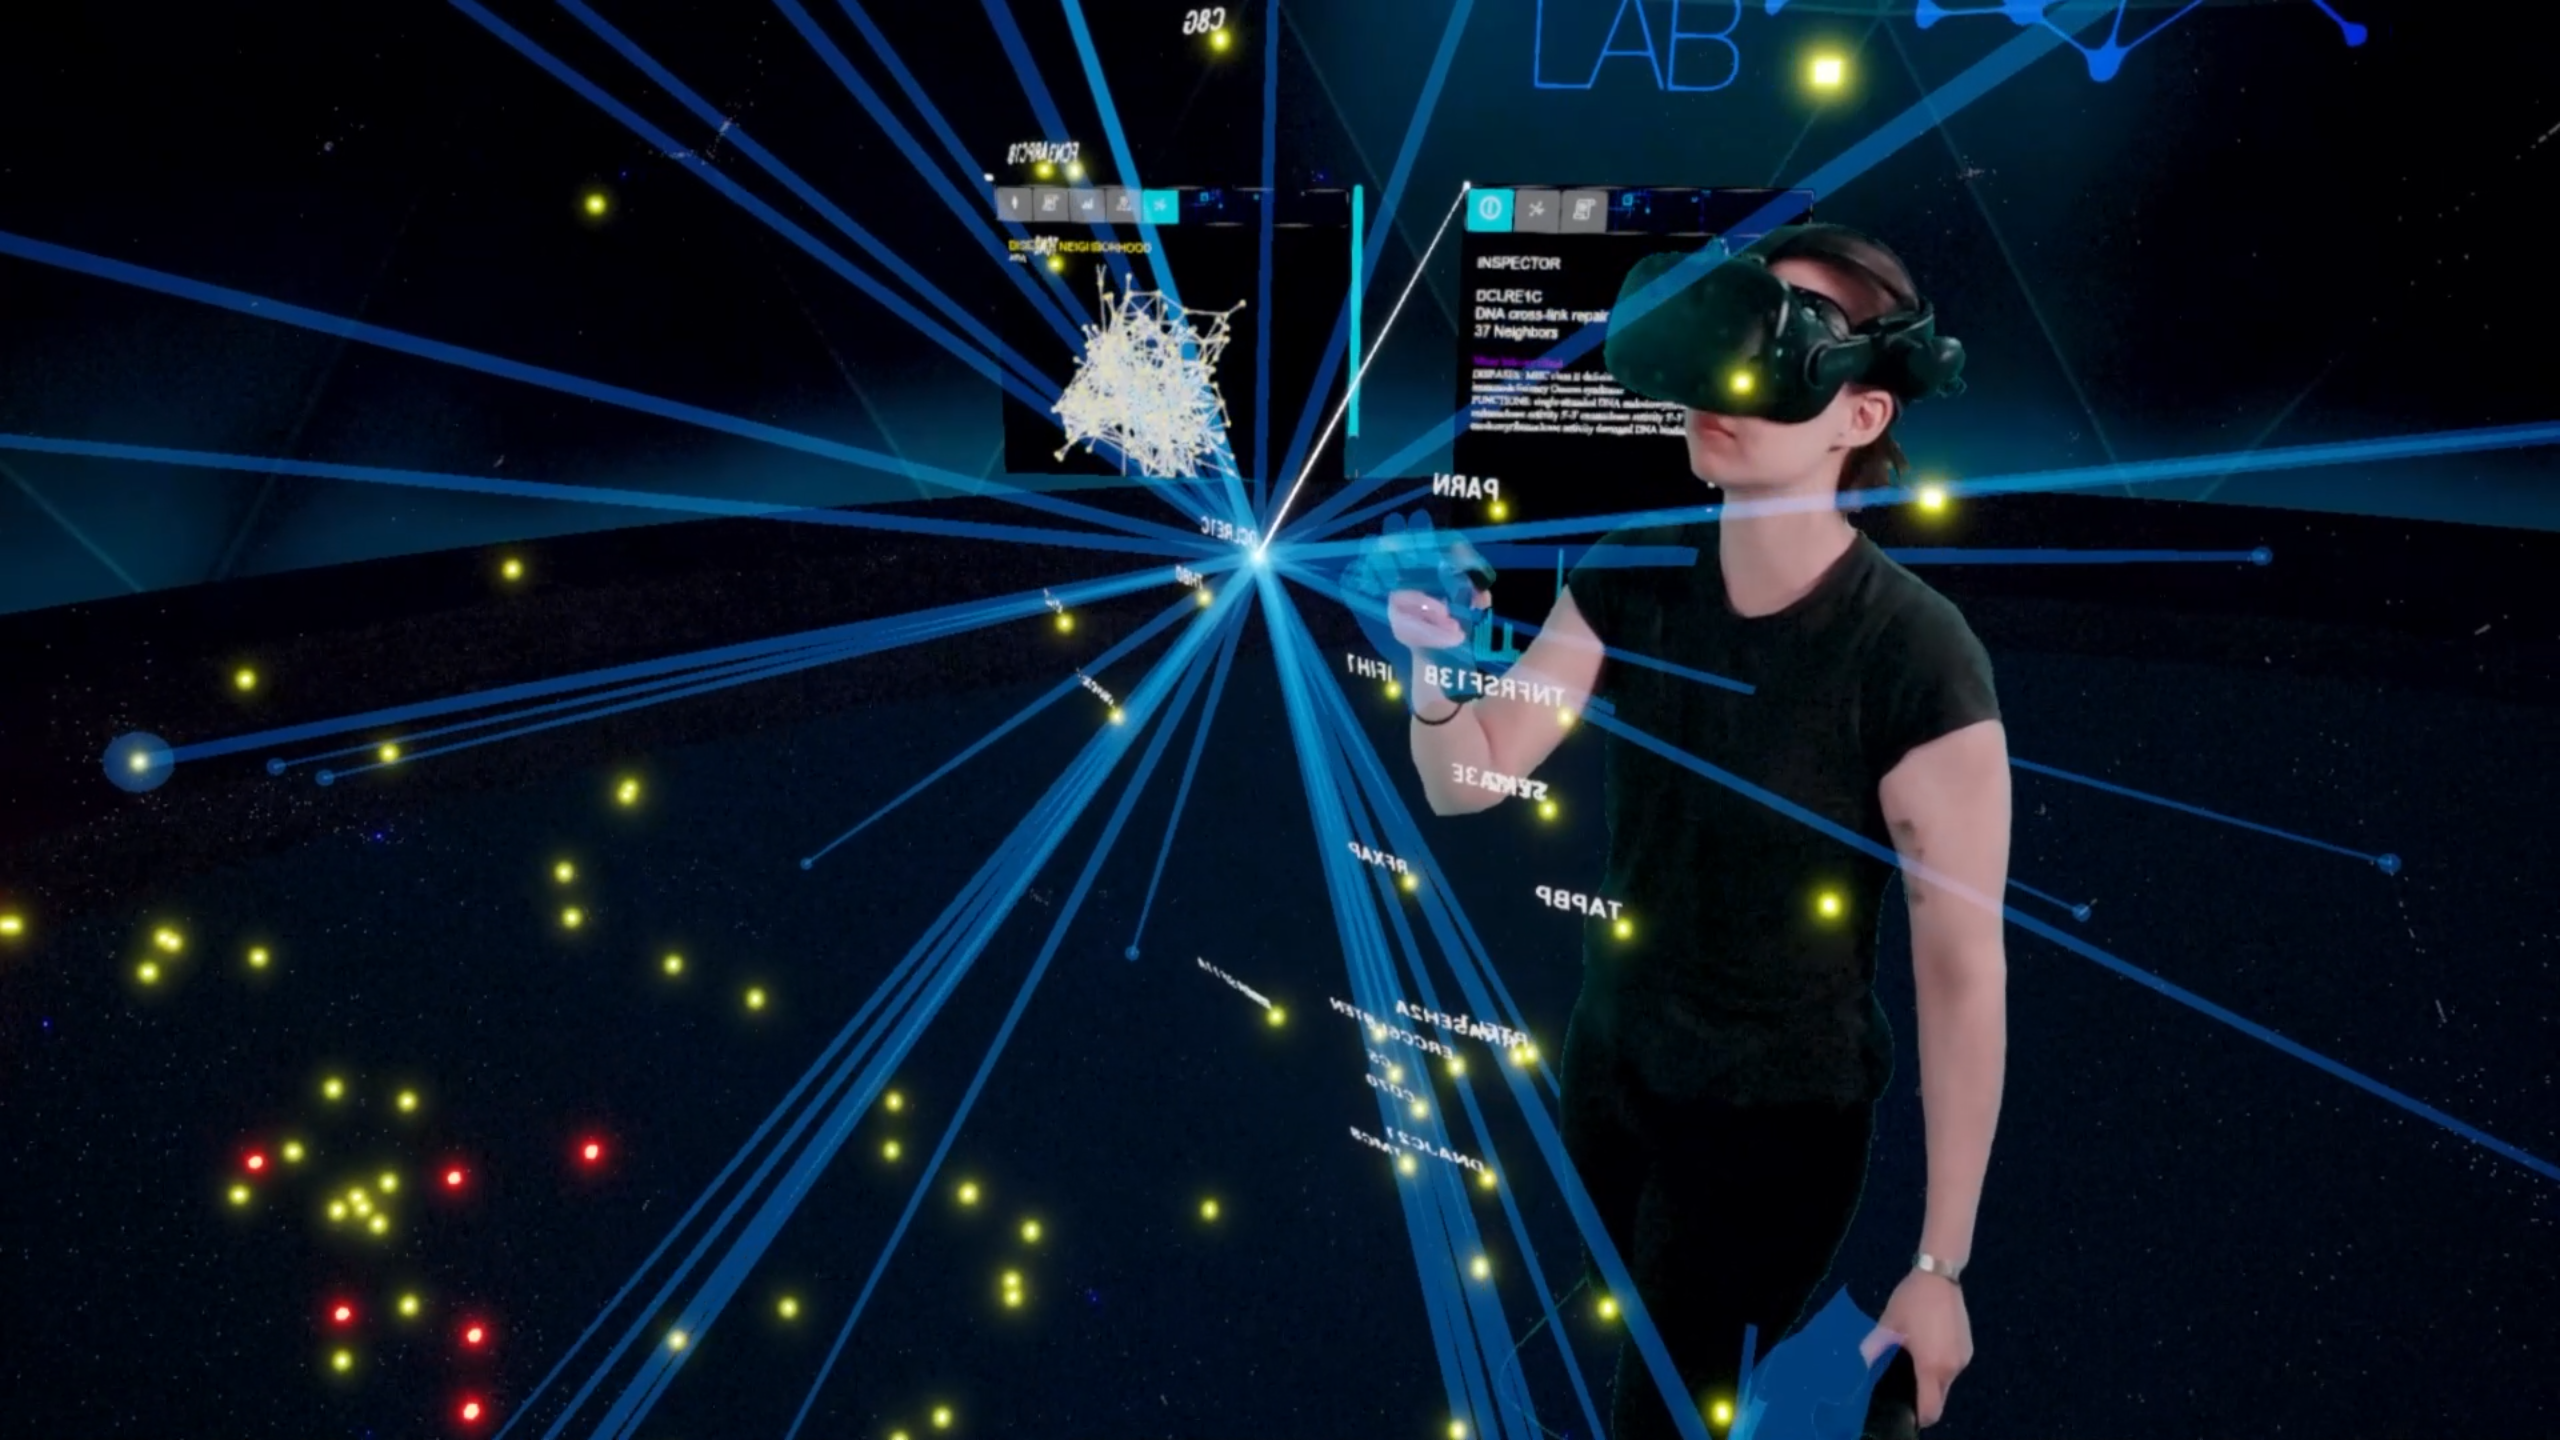
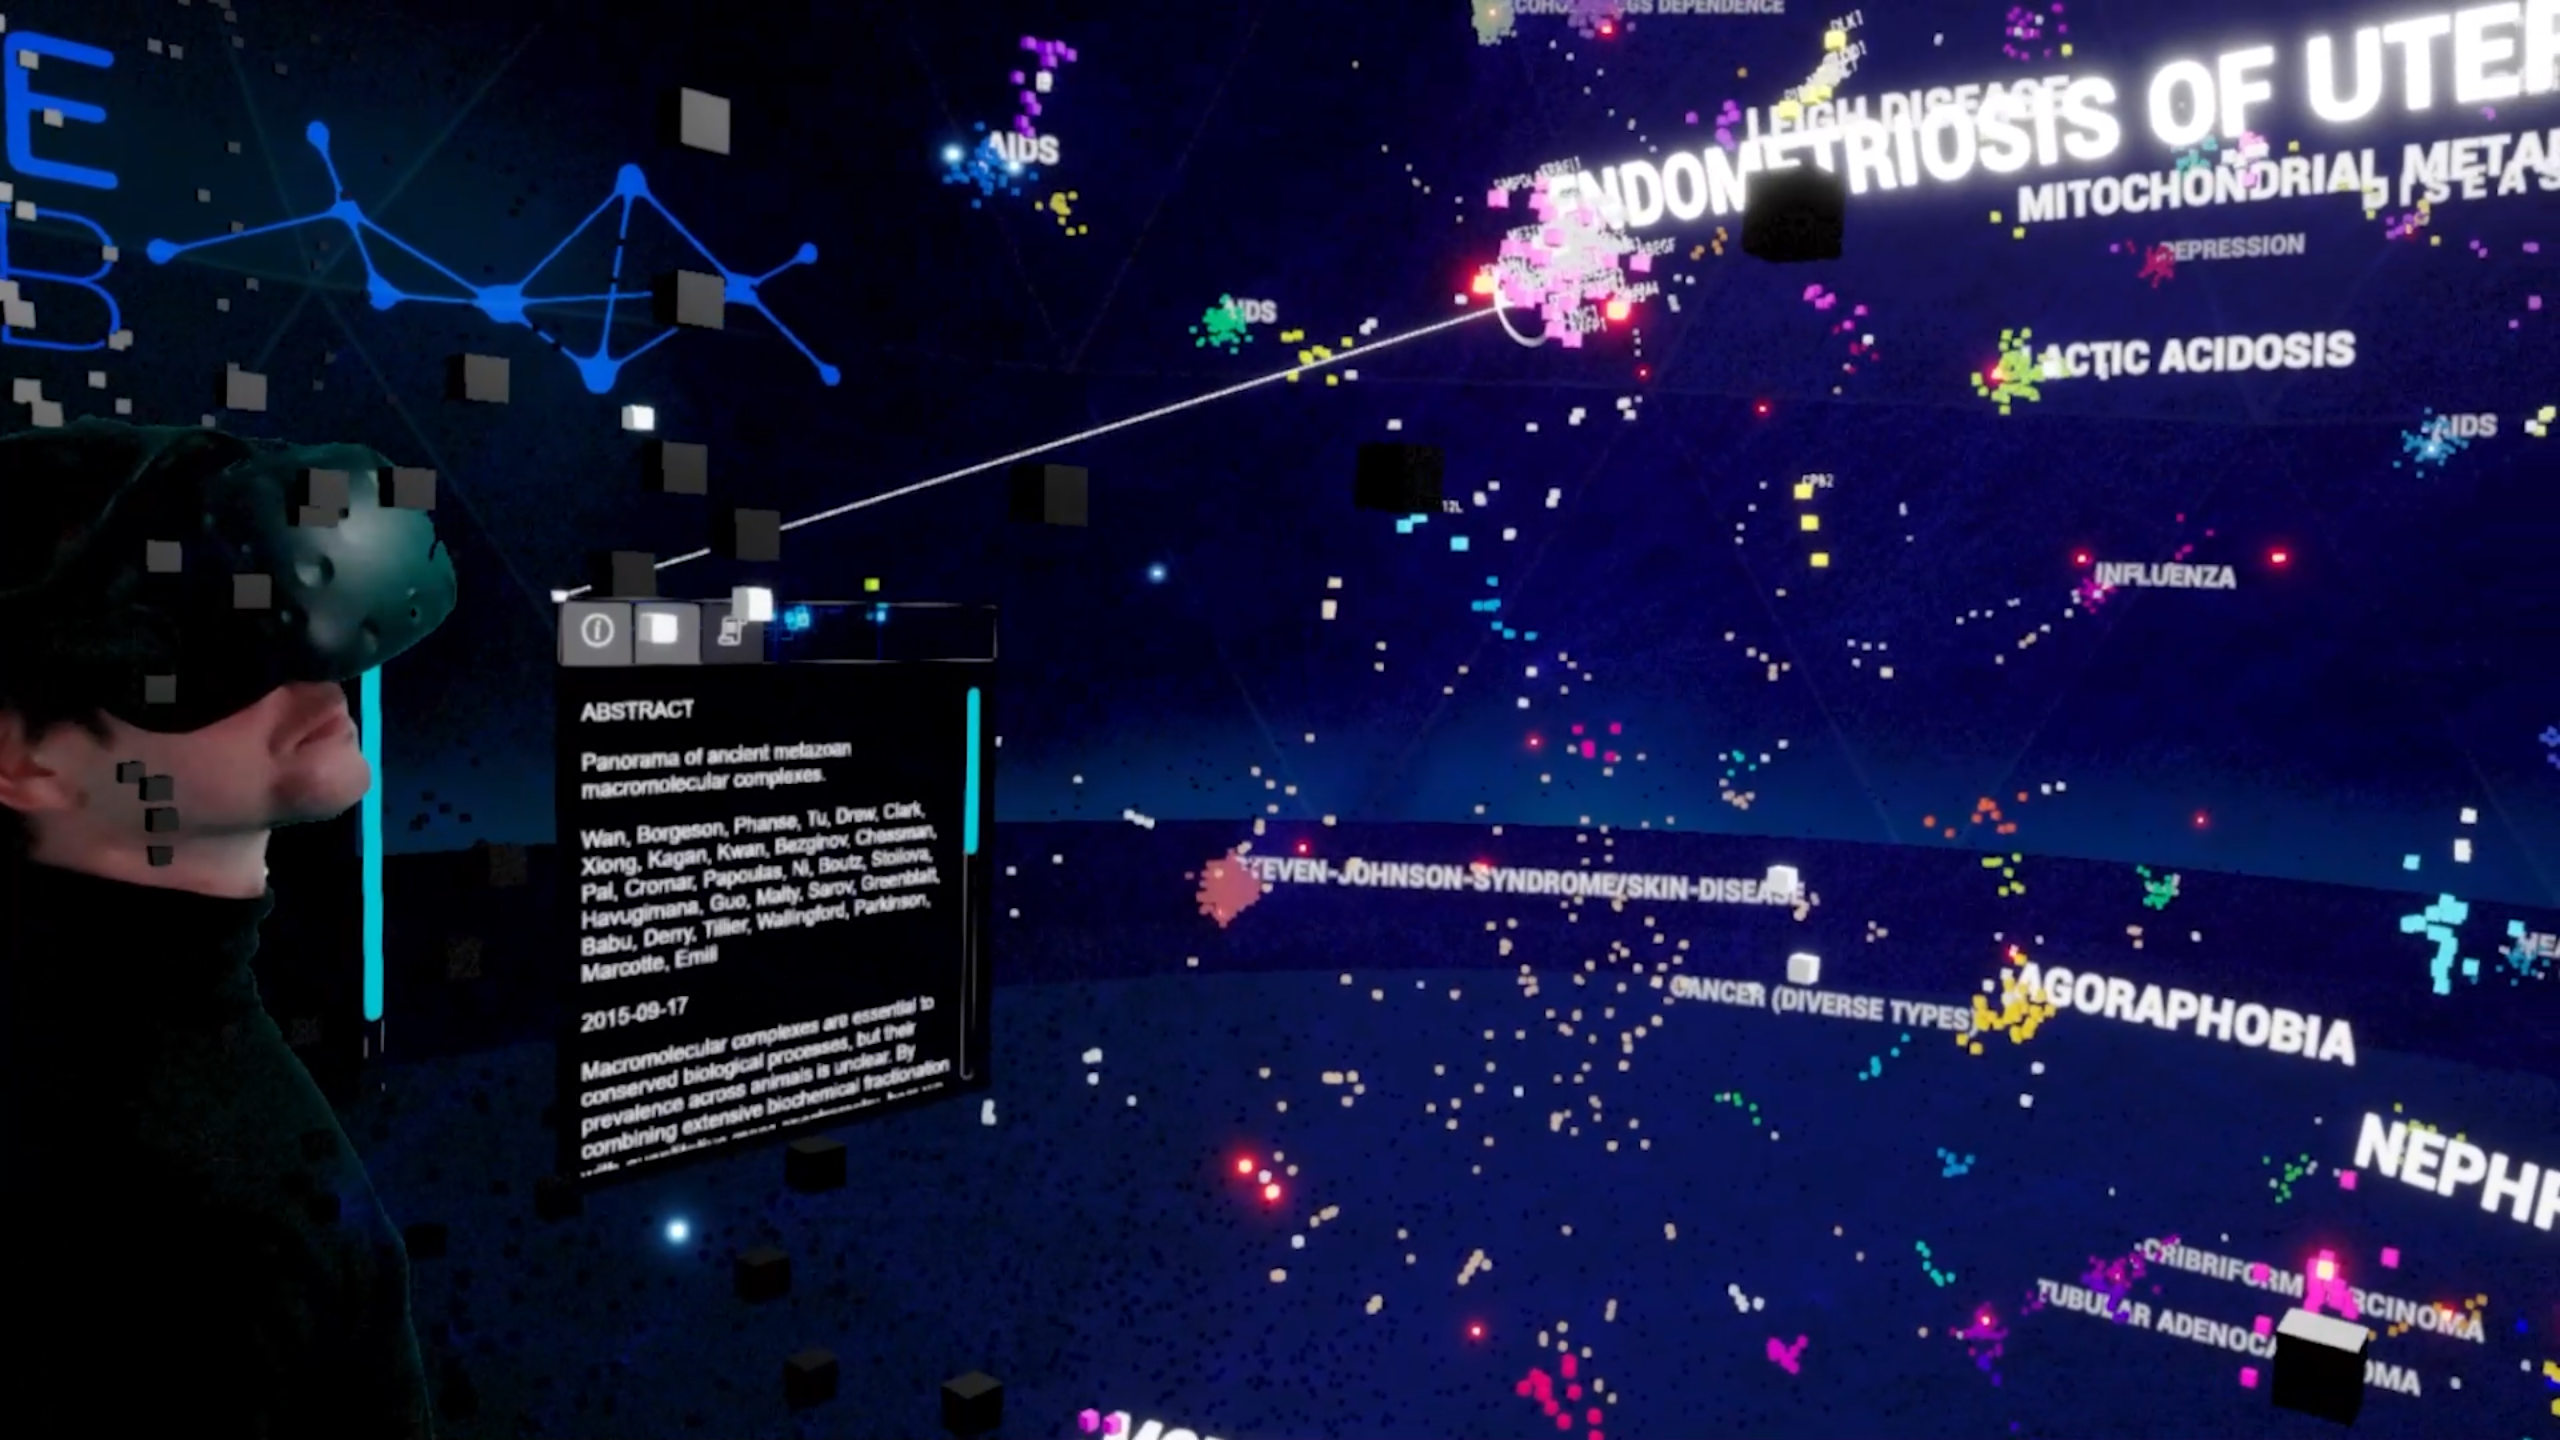
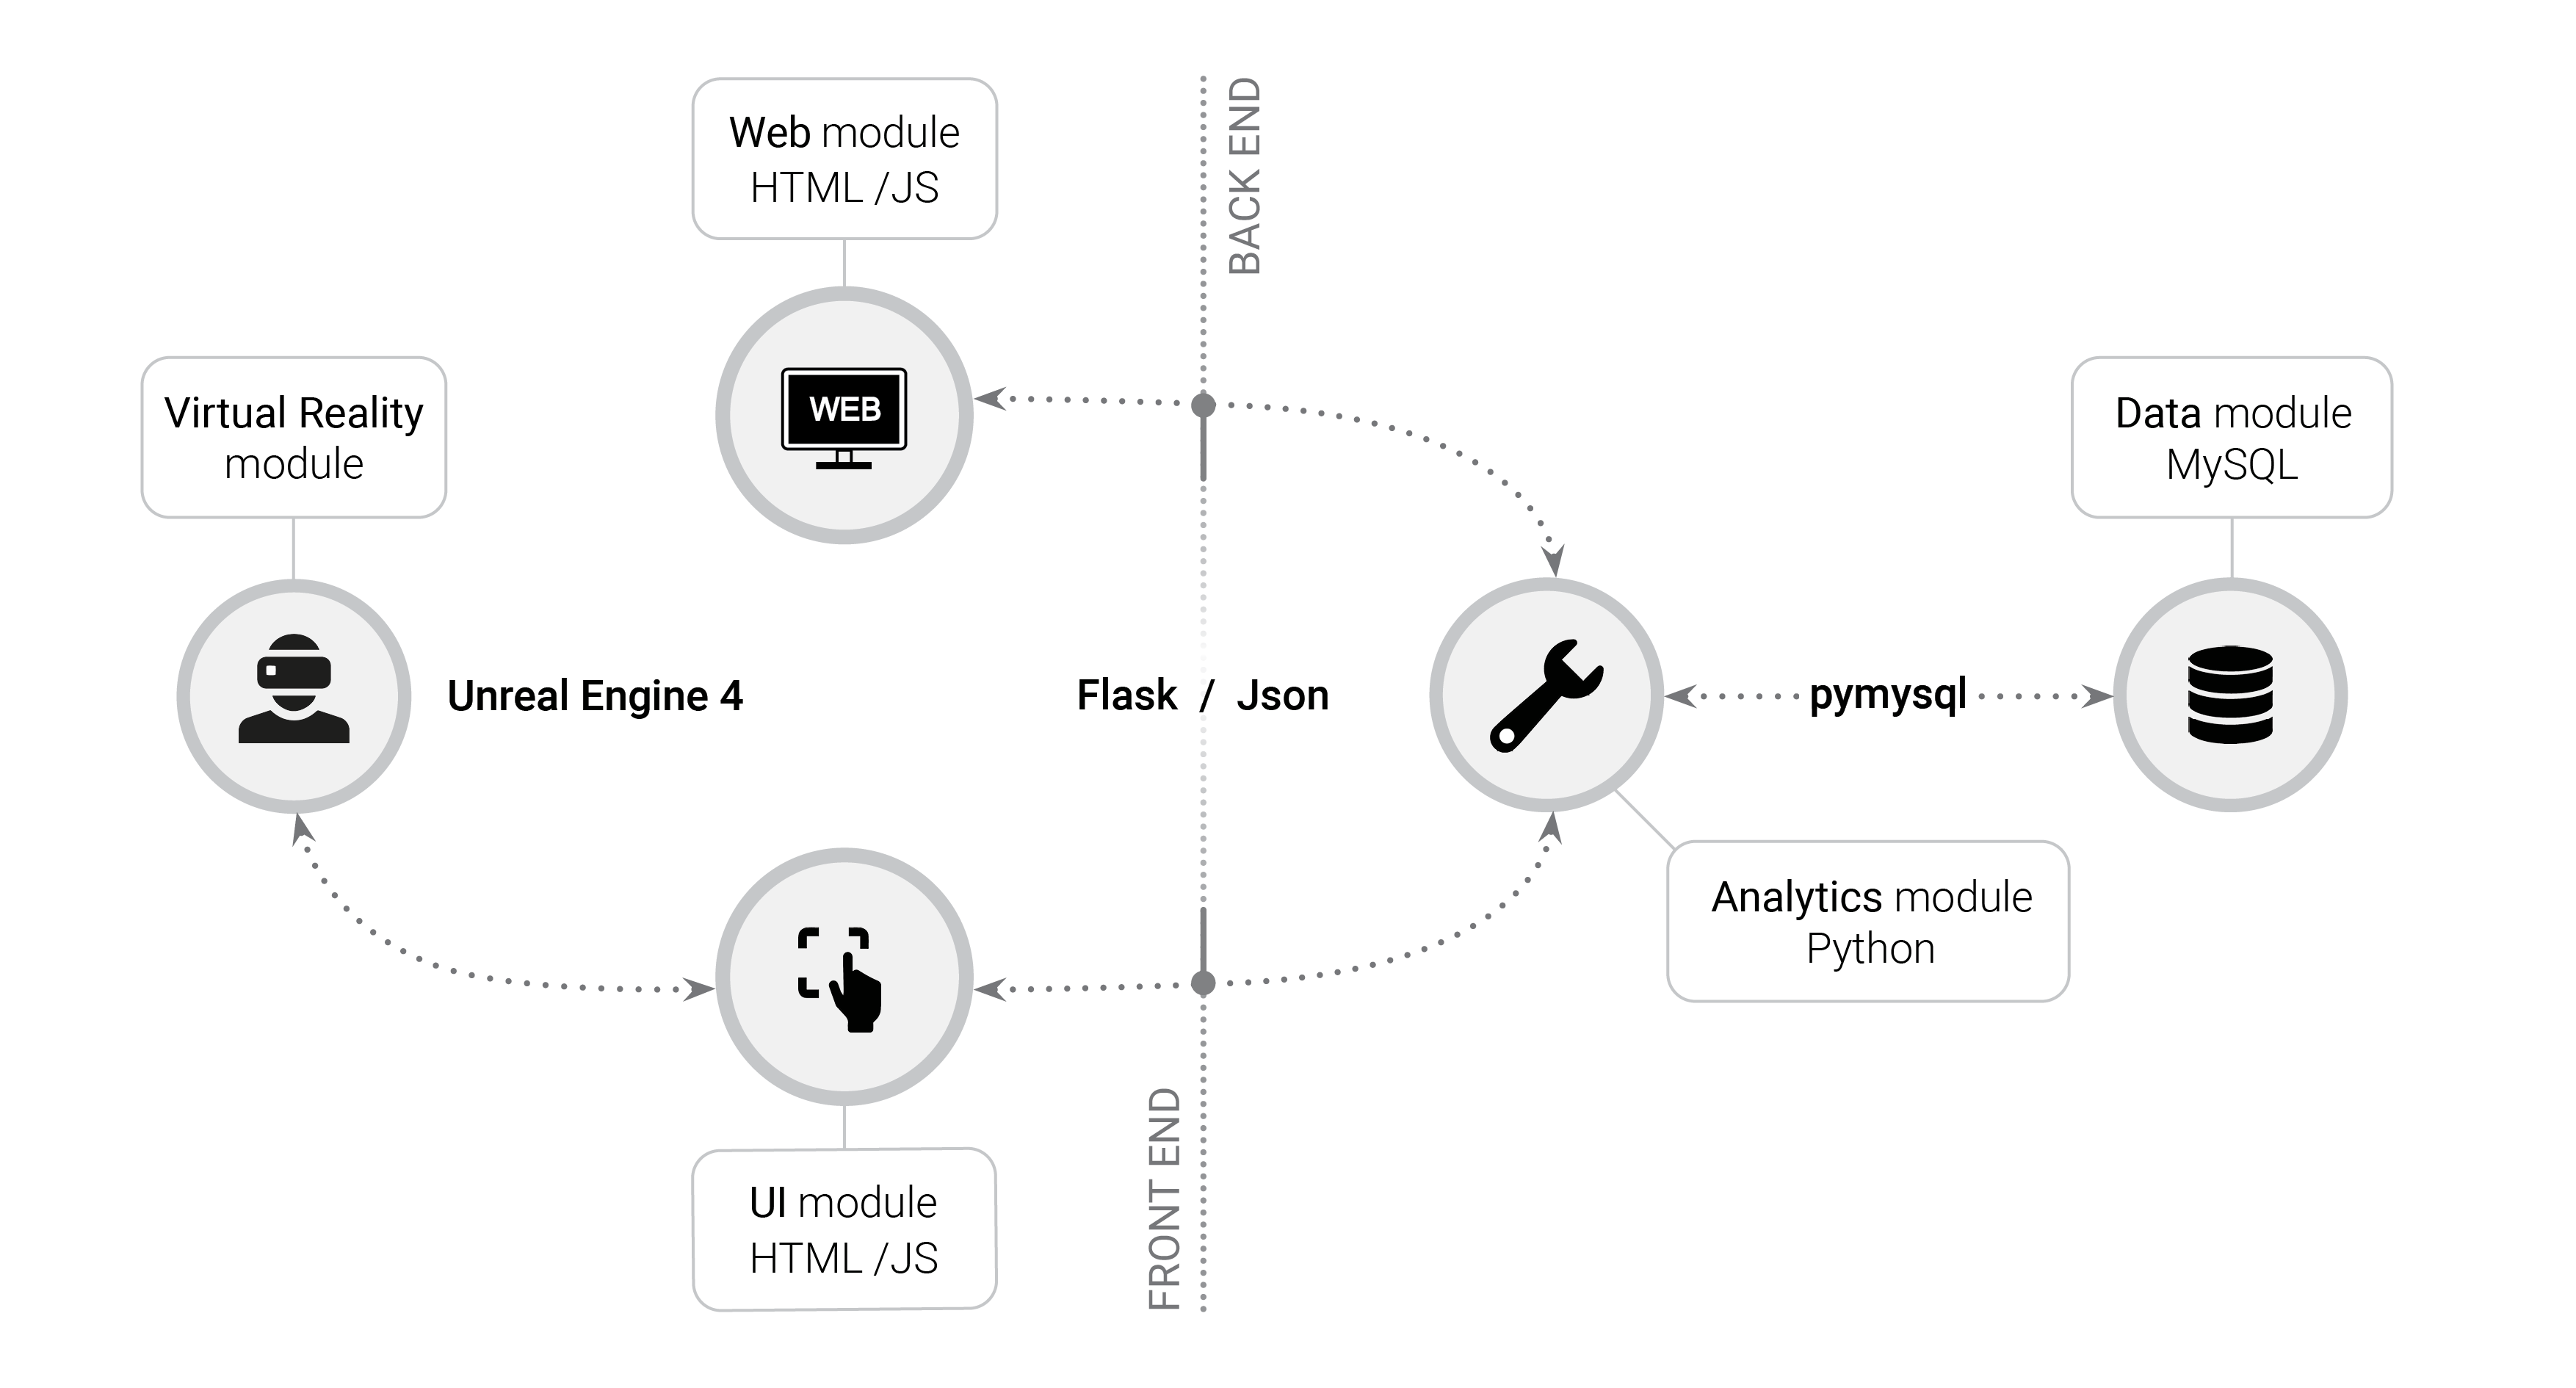
Twenty years ago, this was unimaginable -- but with the advancements in gaming technology and computing power, huge networks become (virtual) reality. Our platform is built in an open and modular fashion: the core of our platform, the VR module, is implemented on Unreal engine 4, the industry gold standard in the video game world. It boasts astounding graphics performance, maximal compatibility with a variety of VR headsets, and it’s open source, too! The analytics module is written in Python and served with Flask. It contains all the code for network visualization and analysis, as well as helper functionality to upload new networks into the tool and download them to a format compatible with other network analysis tools. The two modules are linked together with a user interface module coded in Python/Flask, Javascript and html. All of these modules are open source and can be further customized by the user.
In the paper we showcase how we use VRNetzer to help identify potential causes of rare genetic diseases. Every 4 seconds a baby is born with a rare genetic disease. Globally, rare diseases affect 1 in 20 people. These diseases can be life threatening and most of the time they are caused by one specific gene mutation. The question is… which gene? The human genome project gave us the catalog of all the parts in the system, and the networks we build describe the wiring diagram between the parts -- this is where biological function emerges.
In one case, we had a patient suffering from severe combined immune deficiency (SCID) with an unknown genetic cause. The patient presented with recurrent severe infections, fever, and thrush. An immune panel revealed a low T-cell count and defective T-cell activation. Next generation sequencing of the patient’s DNA revealed several hundred variants; by applying filters for frequency and quality, confirmation by Sanger sequencing, and comparisons with the patient’s pedigree (segregation analysis), we are left with 15 candidate genes. By examining the local and global network neighborhoods of these genes in several functional contexts, we can collect the pieces of the puzzle to find the cause of the patient's symptoms.

This is but a very specific use case for our platform -- because you can plug in your own networks and your own code, our platform can be used to explore all kinds of networks and answer a wide range of questions. Add your own and send us a screen capture! We'd love to see your networks. Currently VRNetzer ships with the network of airports as well as the human interactome.
Grab your VR headset and try it out! Instructions on how to set it up can be found here: https://github.com/menchelab/VRNetzer/blob/main/README.md. Don’t have a headset? Well, we also have a 2D version you can run from your computer -- but trust us, the VR version is much more fun!
Happy VRnetzing!
.jpeg)
Follow the Topic
-
Nature Communications

An open access, multidisciplinary journal dedicated to publishing high-quality research in all areas of the biological, health, physical, chemical and Earth sciences.
Related Collections
With Collections, you can get published faster and increase your visibility.
Women's Health
Publishing Model: Hybrid
Deadline: Ongoing
Advances in neurodegenerative diseases
Publishing Model: Hybrid
Deadline: Mar 24, 2026

Please sign in or register for FREE
If you are a registered user on Research Communities by Springer Nature, please sign in