Rapid, accessible 3D imaging from a single 2D projection is possible with coherent beams, direct electron detectors, and material priors.

Nanotechnology is rapidly changing many fields, including electronics, optics, materials science, medicine, and biology. These nanotechnologies depend heavily on fast, high-resolution imaging and characterization. Examples include fabricating complex three-dimensional (3D) nanostructures (e.g., metasurfaces, semiconductor devices), in-situ imaging of nanometer-scale reactions (e.g., catalysis, energy storage, quantum devices), and examining self-assembled 3D nanostructures in nature for inspiration- and curiosity-driven research (e.g., butterfly wing scales). Currently, most of such imaging is two-dimensional (2D) because rapid, easily accessible 3D imaging tools at the nanometer scale are absent and require specialized instrumentation or large facilities (e.g., synchrotrons).
Transmission electron microscopes (TEM) are widely used nanoscale characterization tools that can reach unmatched 2D resolution. In our computational lens group, we develop algorithms to quantify and statistically infer hidden details in TEM micrographs. When we tried to develop such a scheme for analyzing in-situ TEM movies, we found that the beam’s coherence has primarily been treated as a nuisance many microscopists sought to “remove” or “ignore” in their images. But this coherence is extremely important for creating the phase contrast for single weakly scattering atoms.
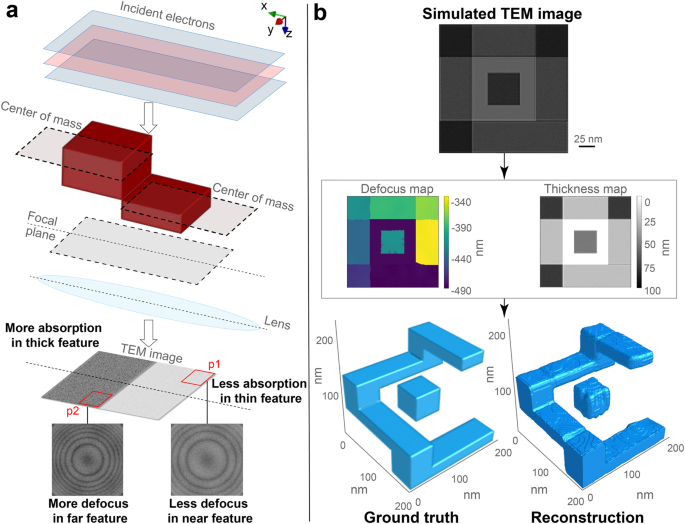
The characteristic of coherent imaging schemes is that they capture fixed-phase relationships between various parts of the specimen. Similarly, the high coherence of the electron beam enables the TEM imaging setup to capture an interference pattern (HRTEM micrograph) that encodes such phase relationships across various parts of the specimen. In other words, we figured that the fringes and speckles in an HRTEM micrograph are not “coherent nuisances” that limit the resolution; instead, they encode the local depth information of the specimen. Since we already know that the local thickness information can be measured from an energy-filtered HRTEM micrograph using Beer-Lambert’s law, we developed a 3D reconstruction method that pops out volume equivalent to the local thickness at the estimated local depth, which we call “pop-out 3D metrology” 1. The method is now published in Communications Physics: https://www.nature.com/articles/s42005-023-01431-6 2.
Our initial validation came from the simulated HRTEM micrographs (multi-slice) of specimens with parts at different depths that showed different local defocus values 3. We followed this with a set of proof-of-concept experiments. Apart from demonstrating feasibility, we also tried to fundamentally understand where the apparent plane of focus should be for a thick sample. Without knowing this, we cannot reliably “pop out” the thickness of the sample at the correct depth. The results we obtained from the simulations and experiments showed that the estimated depth points to the center of the mass of the specimen, and we have to pop out half of the thickness on either side of the estimated depth.
Since we wanted to understand why local defocus values point to the center of mass of the scatterer and to show how depth information can be retrieved from a single 2D micrograph, we turned to a linearized kinematic scattering model (i.e., the first Born approximation) of the HRTEM image’s power spectra, using the multi-slice formalism. This model provided us with a few critical insights:
- Whereas the HRTEM image contains scattering information from all the slices along the depth of the specimen, for amorphous samples with homogenous density, these slices together show an apparent defocus in the middle of the specimen.
- Surprisingly, information about a sample’s local thickness not only shows up (expectedly) as an absorption contrast but also manifests in the image's transverse coherent point spread function.
- Pop-out metrology can be done simultaneously on multiple specimen layers but with some additional priors.
Extending the method to image multi-layered specimens opens the possibility of quick 3D metrology on a wide variety of amorphous specimens. This includes the self-assembled nanostructures in a butterfly wing scale (Junonia orythia), whose 3D densities we had previously reconstructed using ptychographic X-ray computed tomography (PXCT)4. Using this butterfly scale’s PXCT 3D reconstruction (Fig. 1b) as our ground truth, we tested our pop-out technique on this complex multi-layered sample and presented the results in the M&M 2023 meeting 5. Although the pop-out reconstruction shows artifacts, many 3D features were accurately reproduced from only a single 2D TEM image!
 HRTEM images simulated as if they are scanned over a 4x4 µm2 area of an experimental PXCT reconstruction and stitched together; b) the ground truth 3D morphology of the scale obtained from the PXCT reconstruction; c) the pop-out 3D reconstruction from the stitched HRTEM images in (a); d) a resin section HRTEM image (Experiment); e) and f) cross-sections from the ground truth (e) and the pop-out 3D reconstruction (f).")
Fig. 1 a) HRTEM images simulated as if they are scanned over a 4x4 µm2 area of an experimental PXCT reconstruction and stitched together; b) the ground truth 3D morphology of the scale obtained from the PXCT reconstruction; c) the pop-out 3D reconstruction from the stitched HRTEM images in (a); d) a resin section HRTEM image (Experiment); e) and f) cross-sections from the ground truth (e) and the pop-out 3D reconstruction (f).
Here, we share a few notable advantages of pop-out 3D metrology:
- This type of metrology is fast since only a single 2D TEM image is needed to reconstruct a sample’s 3D volume without rotating the sample, as in tomography. This speed allows us to scale up 3D metrology to an extended specimen (i.e., a few µm2 area imaged to ~10nm 3D resolution within a minute).
- The vast majority of TEMs with energy filters can already use the pop-out principle without modification.
- 3D dynamics: Our method can image the 3D structural dynamics with only a 2D TEM movie of a changing sample. Unlike tomography, whose temporal resolution is limited by the acquisition time of a full tilt series, our time resolution is limited only by the frame rate of the detector in movie-mode TEM (i.e., typically milliseconds) or pulse duration with the more exotic ultrafast TEM.

Mov. 1 3D rendering of a simulated specimen with various nanometer-scale features that would be found in semiconductor devices demonstrating the capabilities of pop-out 3D metrology.
More broadly, our formulation of pop-out metrology is generalizable to any coherent imaging system through optically thick samples (i.e., X-rays, electrons, visible light photons, etc.). The manuscript picked electron microscopy only as a demonstrative modality rather than the only possible one. Given how accessible and fast pop-out 3D metrology is, from rapid fabrication feedback to study nanostructures and processes, this can be widely used as an accessible complementary tool to the existing slower form of metrology.
References:
- Balakrishnan, D. et al. TEM-based single-shot coherent 3D imaging. in Imaging and Applied Optics Congress 2022 (3D, AOA, COSI, ISA, pcAOP) JW5A.3 (Optica Publishing Group, 2022).
- Balakrishnan, D. et al. Single-shot, coherent, pop-out 3D metrology. Communications Physics 6, 1–15 (2023).
- Kirkland, E. J. Advanced Computing in Electron Microscopy. (Springer Science & Business Media, 2013).
- Prakash, A. et al. Nanoscale cuticle density variations correlate with pigmentation and color in butterfly wing scales. arXiv [physics.bio-ph] (2023).
- Balakrishnan, D. et al. Potential Large-area Imaging of Butterfly Wing Scales with Transmission Electron Microscopy. Microsc. Microanal. 29, 1207–1208 (2023).
I am a computational imaging scientist whose work bridges optics, machine learning, and signal and data processing to reveal quantitative 3D structural and compositional insights at the nanoscale. As a Senior Research Fellow (Data Scientist) at the Centre for Bio-Imaging Sciences, National University of Singapore, I develop physics-informed AI pipelines that transform electron microscopy and X-ray datasets into precise, quantitative insights for nanotechnology, advanced materials, and biosciences.
My current vision is to integrate imaging physics and specimen priors into an AI-centered, differentiable programming framework for correlative, multi-modal imaging, thereby advancing 3D reconstruction toward real-time nanometrology.
Follow the Topic
-
Communications Physics

An open access journal from Nature Portfolio publishing high-quality research, reviews and commentary in all areas of the physical sciences.
Your space to connect: The Polarised light Hub
A new Communities’ space to connect, collaborate, and explore research on Light-Matter Interaction, Optics and Photonics, Quantum Imaging and Sensing, Microscopy, and Spectroscopy!
Continue reading announcementRelated Collections
With Collections, you can get published faster and increase your visibility.
Higher-order interaction networks 2024
Publishing Model: Open Access
Deadline: Feb 28, 2026
Physics-Informed Machine Learning
Publishing Model: Hybrid
Deadline: May 31, 2026

Please sign in or register for FREE
If you are a registered user on Research Communities by Springer Nature, please sign in