Seasonal Prediction of Severity Index of Harmful Algal Blooms in Lake Erie using Machine Learning
Published in Earth & Environment
In recent years, not a week goes by in the summer and fall, when there are reports of harmful algal blooms (HABs) in lakes and estuaries, and increased concerns driven by our warming planet (e.g., https://www.nature.com/articles/s43247-021-00178-8). Independently of their drivers, the prevalence of harmful algal blooms (HABs) in both freshwater and marine ecosystems requires a better understanding of their mechanistic drivers to assess and predict their onset. There are multi-billion-dollar impacts of HABs in the United States alone on shellfish, fish, domesticated animals, wildlife, seabirds, tourism and human health. Hence, an improved early seasonal prediction of HABs severity can have significant value in planning for mitigation efforts and warnings to industry, government agencies and the public.
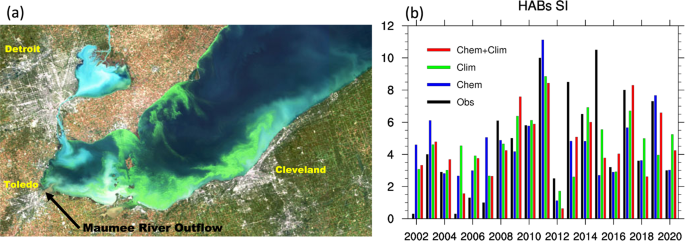
For example, Lake Erie is the fourth largest of the five Laurentian Great Lakes of North America and is a major contributor to the surface freshwater supply in the United States. It is also the most southern, with its watershed containing both urbanized areas that include large manufacturing facilities and rural environments with extensive agricultural regions. That has led to Lake Erie becoming severely impacted by excessive nutrient loading, especially from its western basins. This can be seen in Figure 1, below.
For the last 20 years, a seasonal Severity Index (SI) for HABs in Lake Erie has been made available by the National Oceanic and Atmospheric Administration (NOAA). Western Lake Erie has witnessed increasingly intense algal blooms, including cyanobacterial blooms. One of these intense seasons occurred in 2015, when the HABs Severity Index reached its highest mark at 10.5. 2011 had the second highest HABs Severity Index at 10.0. From analyses of long-term trends in nutrient loading and meteorological conditions (including severe springtime precipitation events coupled with long-term trends in agricultural land use and practices), it was determined that the 2011 extreme HAB event, as can be seen in Figure 1, in western Lake Erie was largely driven by trends in these factors.
")
Figure 1. Visible image from the Envisat satellite at 300m resolution showing one of the largest algae blooms in Lake Erie, which occurred in October 2011. It extended from Toledo to beyond Cleveland and along the Ontario shore. (Image available courtesy of the European Space Agency.)
Given these challenges, we assembled an international team of researchers led by IBM Research at the Thomas J. Watson Research Center, Yorktown Heights, New York, USA, and included scientists from Climate AI, San Francisco, California, USA; University of Southern California, Los Angeles, California, USA; University of Colorado, Boulder, Colorado, USA; Florida Institute of Technology, Melbourne, Florida, USA; Nansen Environmental and Remote Sensing Center and Bjerknes Centre for Climate Research, Bergen, Norway. The team collaborated to address the problem of improving the prediction of HABs Severity Index. We determined that conventional methods for HABs prediction using nutrient loading as the primary driver are less accurate during extreme bloom years, when the fidelity of such forecasts needs to be high. To address this gap, we applied a machine learning method with a combination of nutrient loading and climate indices as predictors to forecast HABs severity index. This work was published recently (https://doi.org/10.1038/s43247-022-00510-w) as a scientific article in Communications Earth and Environment. This new method shows promise as tested by several experiments performed by the team, which demonstrated that the seasonal prediction of severity of HABs can be improved in both its fidelity and useful lead time. There are several advantages in understanding and forecasting based on climate information. First, biological effects may be related more strongly to global climate indices than to any single local climate variable. Second, the climate indices are typically readily available to drive such a forecast model. We expect that this approach would be able to explain the variance in estimates of HABs severity due to the interaction between unknown biological, chemical, hydrodynamical, and meteorological factors that lead to bloom formation.
We suggest that by combining the predictors consisting of climate indices and nutrient loading in a machine learning model can improve the seasonal prediction of HABs Severity Index. The results are shown (i.e., the red bars) in Figure 2, below. For each year from 2002 through 2020, the results of the model using both climate indices and nutrient loading are shown in comparison to observations of the actual HABs severity (i.e., the black bars). This method can provide a seasonal forecast earlier than conventional methods (i.e., in early June), which can lead to more timely information for decision makers for adopting proper planning and mitigation strategies. We further show that for the mild HABs years (SI < 2), the large-scale meteorological features are distinct from those for the severe HABs years (SI > 7). This suggests that large-scale atmospheric circulation may affect the seasonal evolution of HABs in Lake Erie. The machine learning model is able to capture these distinct features by identifying the key predictors, which can play an important role in improving the seasonal prediction of HABs Severity Index in Lake Erie. For example, 2015 was an extreme year for HABs in Lake Erie, with a HABs SI of 10.5. Large chemical loading was responsible for 2015 being an extreme year when HABs SI was 10.5. This was driven by a very wet June, when the Maumee River received about eight inches more rain than normal. We showed that by including the chemical loading data for June 2015, the prediction of SI was improved tremendously.
 for Lake Erie for 2002 through 2020 (vertical axis). The black bars show the observed SI. The red bars show the model predictions when using both nutrient loading data and climate indices.")
Figure 2. HABs Severity Index (SI) for Lake Erie for 2002 through 2020 (vertical axis). The black bars show the observed SI. The red bars show the model predictions when using both nutrient loading data and climate indices.
Thus, using climate indices for early prediction and nutrient loading data until June for a particular year can help in improving the seasonal prediction of HABs SI. Given these results, we feel this study is noteworthy because it may lead to further refinement of actionable forecasts not only for Lake Erie but other freshwater bodies around the world that are threatened by increased incidents of HABs.
Follow the Topic
-
Communications Earth & Environment
An open access journal from Nature Portfolio that publishes high-quality research, reviews and commentary in the Earth, environmental and planetary sciences.
Related Collections
With Collections, you can get published faster and increase your visibility.
Remote sensing and forests
Publishing Model: Hybrid
Deadline: Jul 31, 2026
Sustainable agricultural practices
Publishing Model: Open Access
Deadline: Jul 24, 2026


Please sign in or register for FREE
If you are a registered user on Research Communities by Springer Nature, please sign in