Sprod for De-noising Spatially Resolved Transcriptomics Data Based on Position and Image Information
Published in Protocols & Methods
SRT is one high-throughput sequencing technology that has gained popularity very recently. In addition to providing gene expression profiling data, which is similar to single-cell sequencing data, SRT can provide location information of each single cell/spot and even corresponding pathological image data as well. However, gene expression data from SRTs (especially the latest high-resolution SRTs such as HDST and SeqScope) contain a lot of noise. These noises, including but not limited to drop-outs as in single-cell sequencing data, come from the dilution of the sequencing reads at each sequencing site and the additional experimental steps performed to preserve sequencing positions. These noises create a huge obstacle for researchers to extract accurate information from the valuable SRT data.
On August 4th, 2022, Dr. Tao Wang from the Quantitative Biomedical Research Center of the UT Southwestern Medical Center (UTSW) and Dr. Li Wang from the University of Texas at Arlington published, in Nature Methods, an article entitled “Sprod for De-noising Spatially Resolved Transcriptomics Data Based on Position and Image Information”. The team reported their invention of the Sprod method, which uses information on the spatial location of sequencing and the pathology images specific to SRT data, to correct noise in the gene expression data.
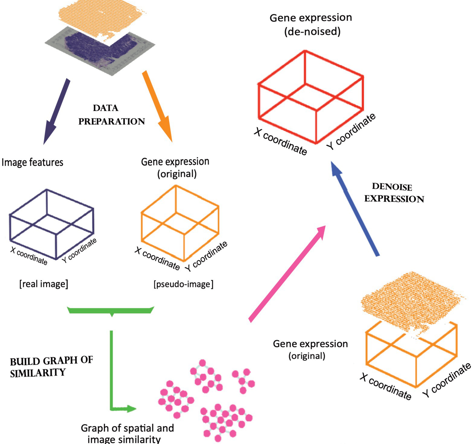
During Sprod's denoising process, each sequencing site borrows gene expression information from nearby sites. The closer the spots are in pathological appearance and physical positions, the more information they will borrow from each other. Based on this principle, Sprod constructs a graph model (Fig 1), and puts all sequencing sites into this graph, as dots of the graph. The dots will be connected if the sequencing sites are adjacent physically and similar in terms of pathological appearances. The expression information of the SRT data then flows through this graph to achieve denoising. Sprod can be applied to various SRT technologies, such as Visium, Slide-Seq, HDST, Seq-Scope, etc. SRT technologies of higher resolution (especially those more recent versions) demonstrate greater noises and will gain more benefit in the removal of noise by Sprod.

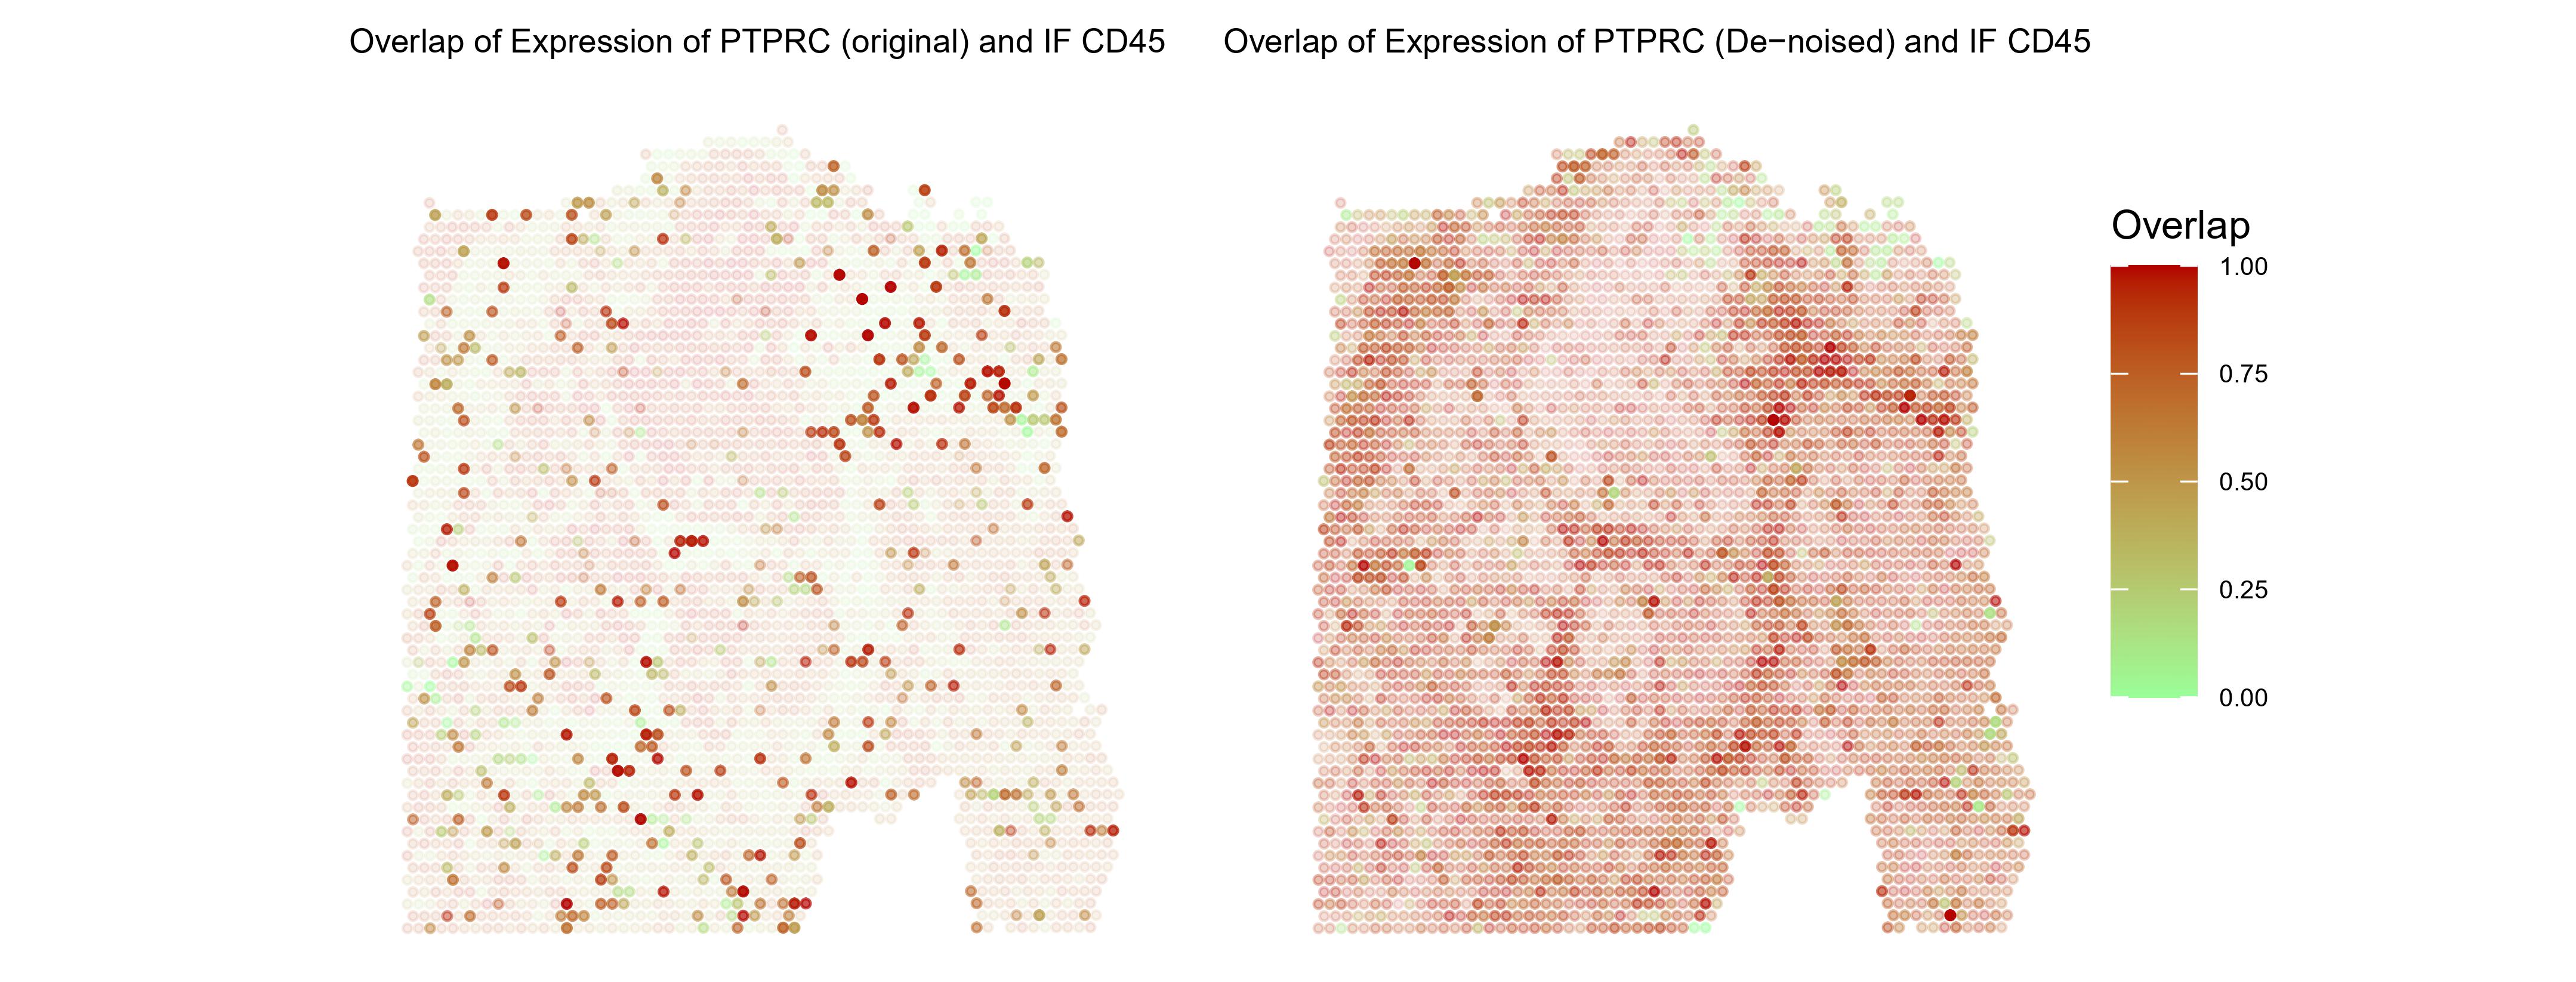
The authors next verified the reliability of Sprod on various SRT datasets. For example, in Fig. 2, they showed the effect of using Sprod by comparing an ovarian cancer Visium dataset’s gene expression pattern before and after denoising. This dataset provides a matched CD45 immunofluorescence(IF) image. As shown in Fig. 2 left, the CD45 IF and the RNA expression of the gene PTPRC (produces CD45) in the Visium data are in very poor agreement, but after the denoising by Sprod, the denoised expression of PTPRC and the staining intensity of CD45 had a much stronger coincidence.

The authors then applied Sprod to a series of other spatial transcriptome datasets such as Visium, Slide-Seq, Seq-Scope, etc., and verified that Sprod can effectively denoise data from various techniques. Downstream analyses of the denoised data, such as differential expression, pathway enrichment, and cell-to-cell communications, are much more meaningful and accurate, after being denoised by Sprod. The drop-out correction methods of single-cell sequencing data simply use the expression profile itself to correct the noises in the expression data. This can cause over-smoothing, which has incurred severe criticisms in the field. In contrast, Sprod leverages their unique external information of the sequencing locations and pathological images for denoising, rather than only the expression data. With such independent information, Sprod performs noise correction much more precisely.
All in all, SRTs provide powerful tools for biomedical researchers. The analysis of SRT data has become increasingly challenging as technology develops and data generated by such technology are becoming more and more complicated. The authors believe that rigorous data pre-processing tools, such as Sprod, are the key to unbiased and accurate interpretation of SRT data.
The co-first authors of this work are Dr. Yunguan Wang and Dr. Bing Song. The work is co-corresponding authored by Dr. Tao Wang and Dr. Li Wang. Other authors include Dr. Xie Yang, Dr. Xiao Guanghua, Dr. Mingyi Chen and Dr. Wang Shidan from UTSW.
[Work was edited by Anjali Ganesh Iyer].
The Quantitative Biology Research Center at UTSW has multiple postdoctoral position openings (qbrc.swmed.edu/labs/wanglab, qbrc.swmed.edu/labs/xielab, qbrc.swmed.edu/labs/xiaolab). We welcome talented bioinformatics of all research expertise to join us!


Please sign in or register for FREE
If you are a registered user on Research Communities by Springer Nature, please sign in