The contribution of turbulence to slow variations in phytoplankton abundance in the world ocean
Published in Earth & Environment
Over the last three decades, unprecedented progress in the theoretical understanding of fine-scale turbulent motions in the ocean (1-100 km, 1-100 days) has led to the growing awareness that they could play an important role on phytoplankton growth. Physically speaking, these fine scales represent the ocean weather, a mixture of energetic sharp fronts and eddies which are ubiquitous in the ocean but have the bad taste of being too small to be captured by climate models.
Phytoplankton, these tiny microscopic photosynthetic organisms, are a core component of the ocean biogeochemical machinery regulating the climate of our planet and supporting marine life. With climate change, phytoplankton are facing rapid changes in their environment, in addition to natural variations. This raises the question of our ability to understand current variations in phytoplankton and predict them over the next century, given the challenge of resolving the fine scales posed to climate models.
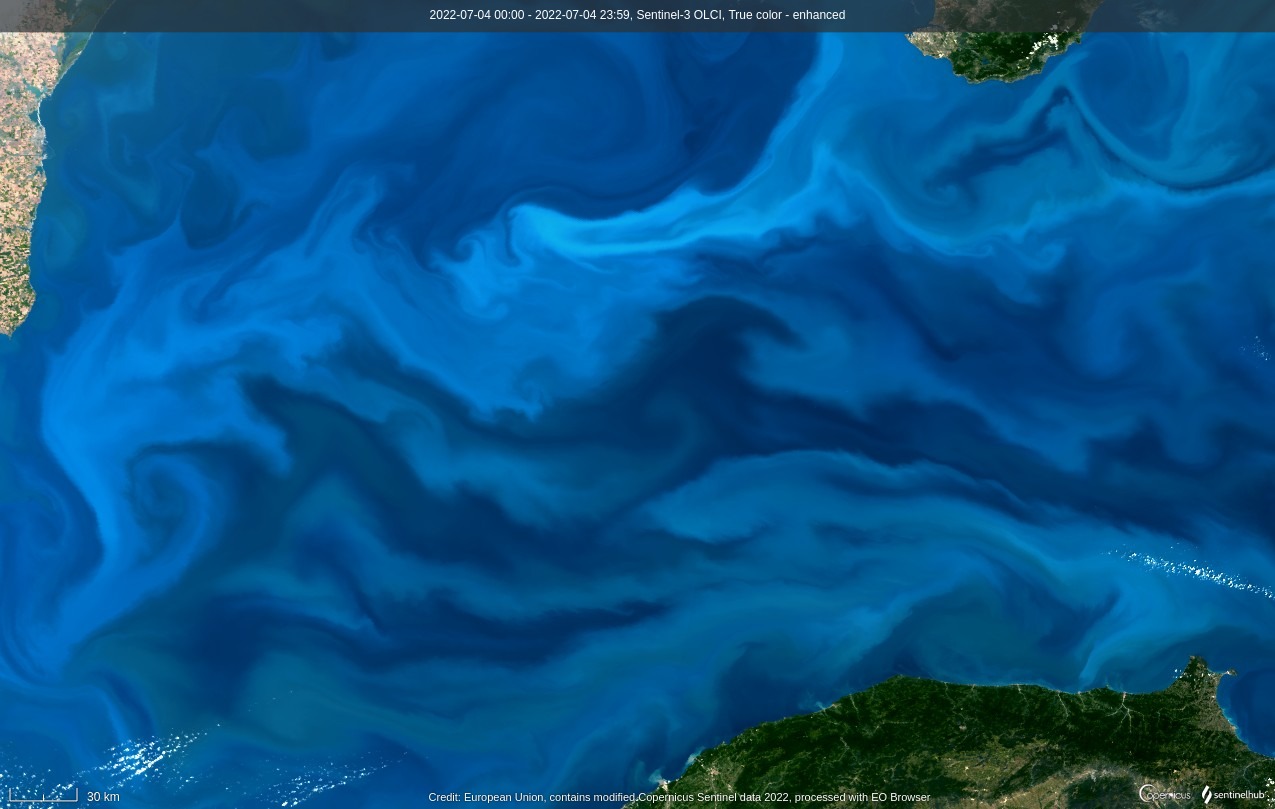
Satellite imagery of ocean color, available routinely since the late 1990s, has made it possible to observe the evolution of phytoplankton abundance at the surface of the ocean over the last twenty years (Figure 1). With daily estimates at a resolution now approaching 1 km, this dataset provides information on phytoplankton content that allows both the effect of fine scales to be seen and changes from year-to-year to be measured. The two still had to be linked.

Previous analyses of this growing database have focused on one or other of these two aspects. Regarding the effect of fine scales, they have involved approaches based on the analysis of the shape of phytoplankton patches, often in relation to pre-identified fronts, eddies, or Lagrangian trajectories derived from other datasets. In terms of measuring slow (>1 year) variations in phytoplankton, past studies have focused on linking observed changes to climate patterns.
Climate patterns are natural form of climate variability which extend over large areas (>1000 km) across the globe, and fluctuate with periods >1 year. And indeed, in the tropics, phytoplankton abundance varies dramatically with the phases of El-Nino Southern Oscillation (ENSO) or the Indian Ocean Dipole (IOD). But at higher latitudes, only modest correlations had been found between year-to-year phytoplankton anomalies and the North Atlantic Oscillation (NAO) or the Southern Ocean Annular Mode (SAM).
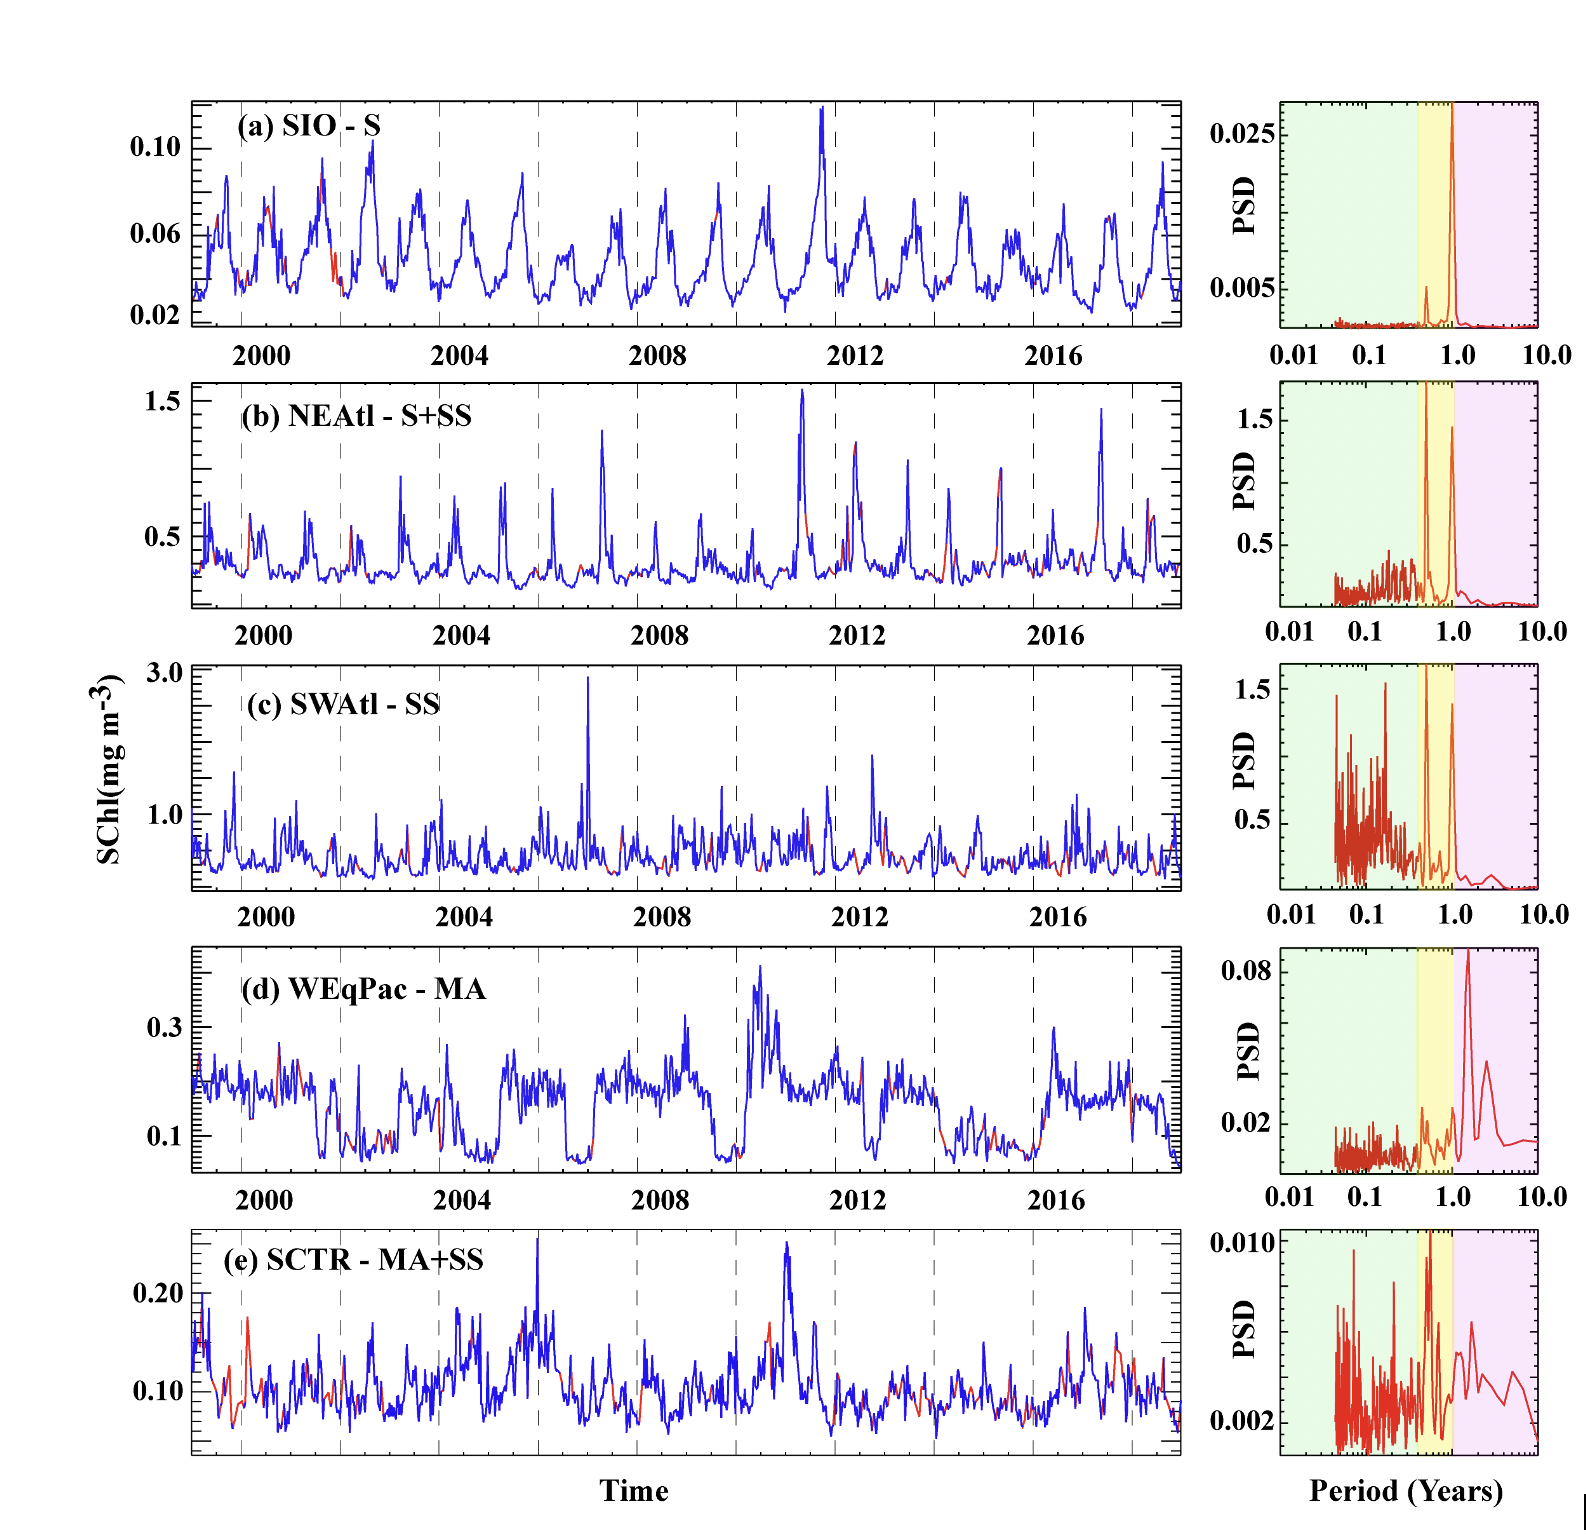
Could this be due to turbulence? Our study suggests it does. The originality of our approach is that we considered fine scales through their temporal, rather than spatial, footprint (Figure 2). At each location in the ocean, we deconvoluted the local chlorophyll time series into different signals, associated with different timescales. We focused on the sub-seasonal signal, which corresponded to timescales <3 months and estimated that the corresponding spatial scales were <100 km. It was therefore this signal that contained the fine scales. And we found that it contained roughly 30 % of the phytoplankton variance over the ocean, which is a lot considering that the dominant variations are seasonal.

Figure 2: Phytoplankton time variations at different stations in the World Ocean, and the corresponding Fourier spectra, illustrating the range of time scales involved. A) South Indian Ocean; b) North East Atlantic; c) South West Atlantic; d) West Equatorial Pacific; e) Seychelles-Chagos Thermocline ridge. Turbulence is particularly intense at stations NEAtl, SWAtl and SCTR (identified by the symbol SS) where the Fourier analysis is large in the green band.
But this is not the end of the story. Because we have also shown that fine-scale variations can accumulate over the year and lead to changes in phytoplankton quantities from one year to the next (Figure 3). This result implies that the slow variations in phytoplankton abundance cannot be explained by considering only the slow variation of their environment, i.e. by considering only the climate modes. We have examined this result in more detail for the Southern Ocean (Prend et al., 2022, Global Biogeochemical Cycles). We found that the SAM could explain only 10% of slow phytoplankton changes, and that these were essentially associated with turbulence, and thus very patchy spatially.

Our results emphasize that turbulent motions at the surface of the ocean must be considered in order to understand long-term variability in phytoplankton content and trends related to climate change, which is of critical importance to marine ecosystems and global climate. This is an enormous challenge that calls for the development of computationally efficient kilometre-scale ocean models.
Follow the Topic
-
Nature Geoscience

A monthly multi-disciplinary journal aimed at bringing together top-quality research across the entire spectrum of the Earth Sciences along with relevant work in related areas.
Related Collections
With Collections, you can get published faster and increase your visibility.
Past sea level and ice sheet change
Publishing Model: Hybrid
Deadline: Mar 31, 2026
Lithium and copper resources for net zero
Publishing Model: Hybrid
Deadline: Feb 28, 2026


Please sign in or register for FREE
If you are a registered user on Research Communities by Springer Nature, please sign in