The exceptionally strong warming over the Mongolian Plateau
Published in Earth & Environment

The Mongolian Plateau (MP) lies on the edge of the East Asian monsoon region. Due to the semiarid and arid climate, the ecosystem of the MP is highly vulnerable to climate change. Climate change in the MP has received considerable attention from the scientific community.
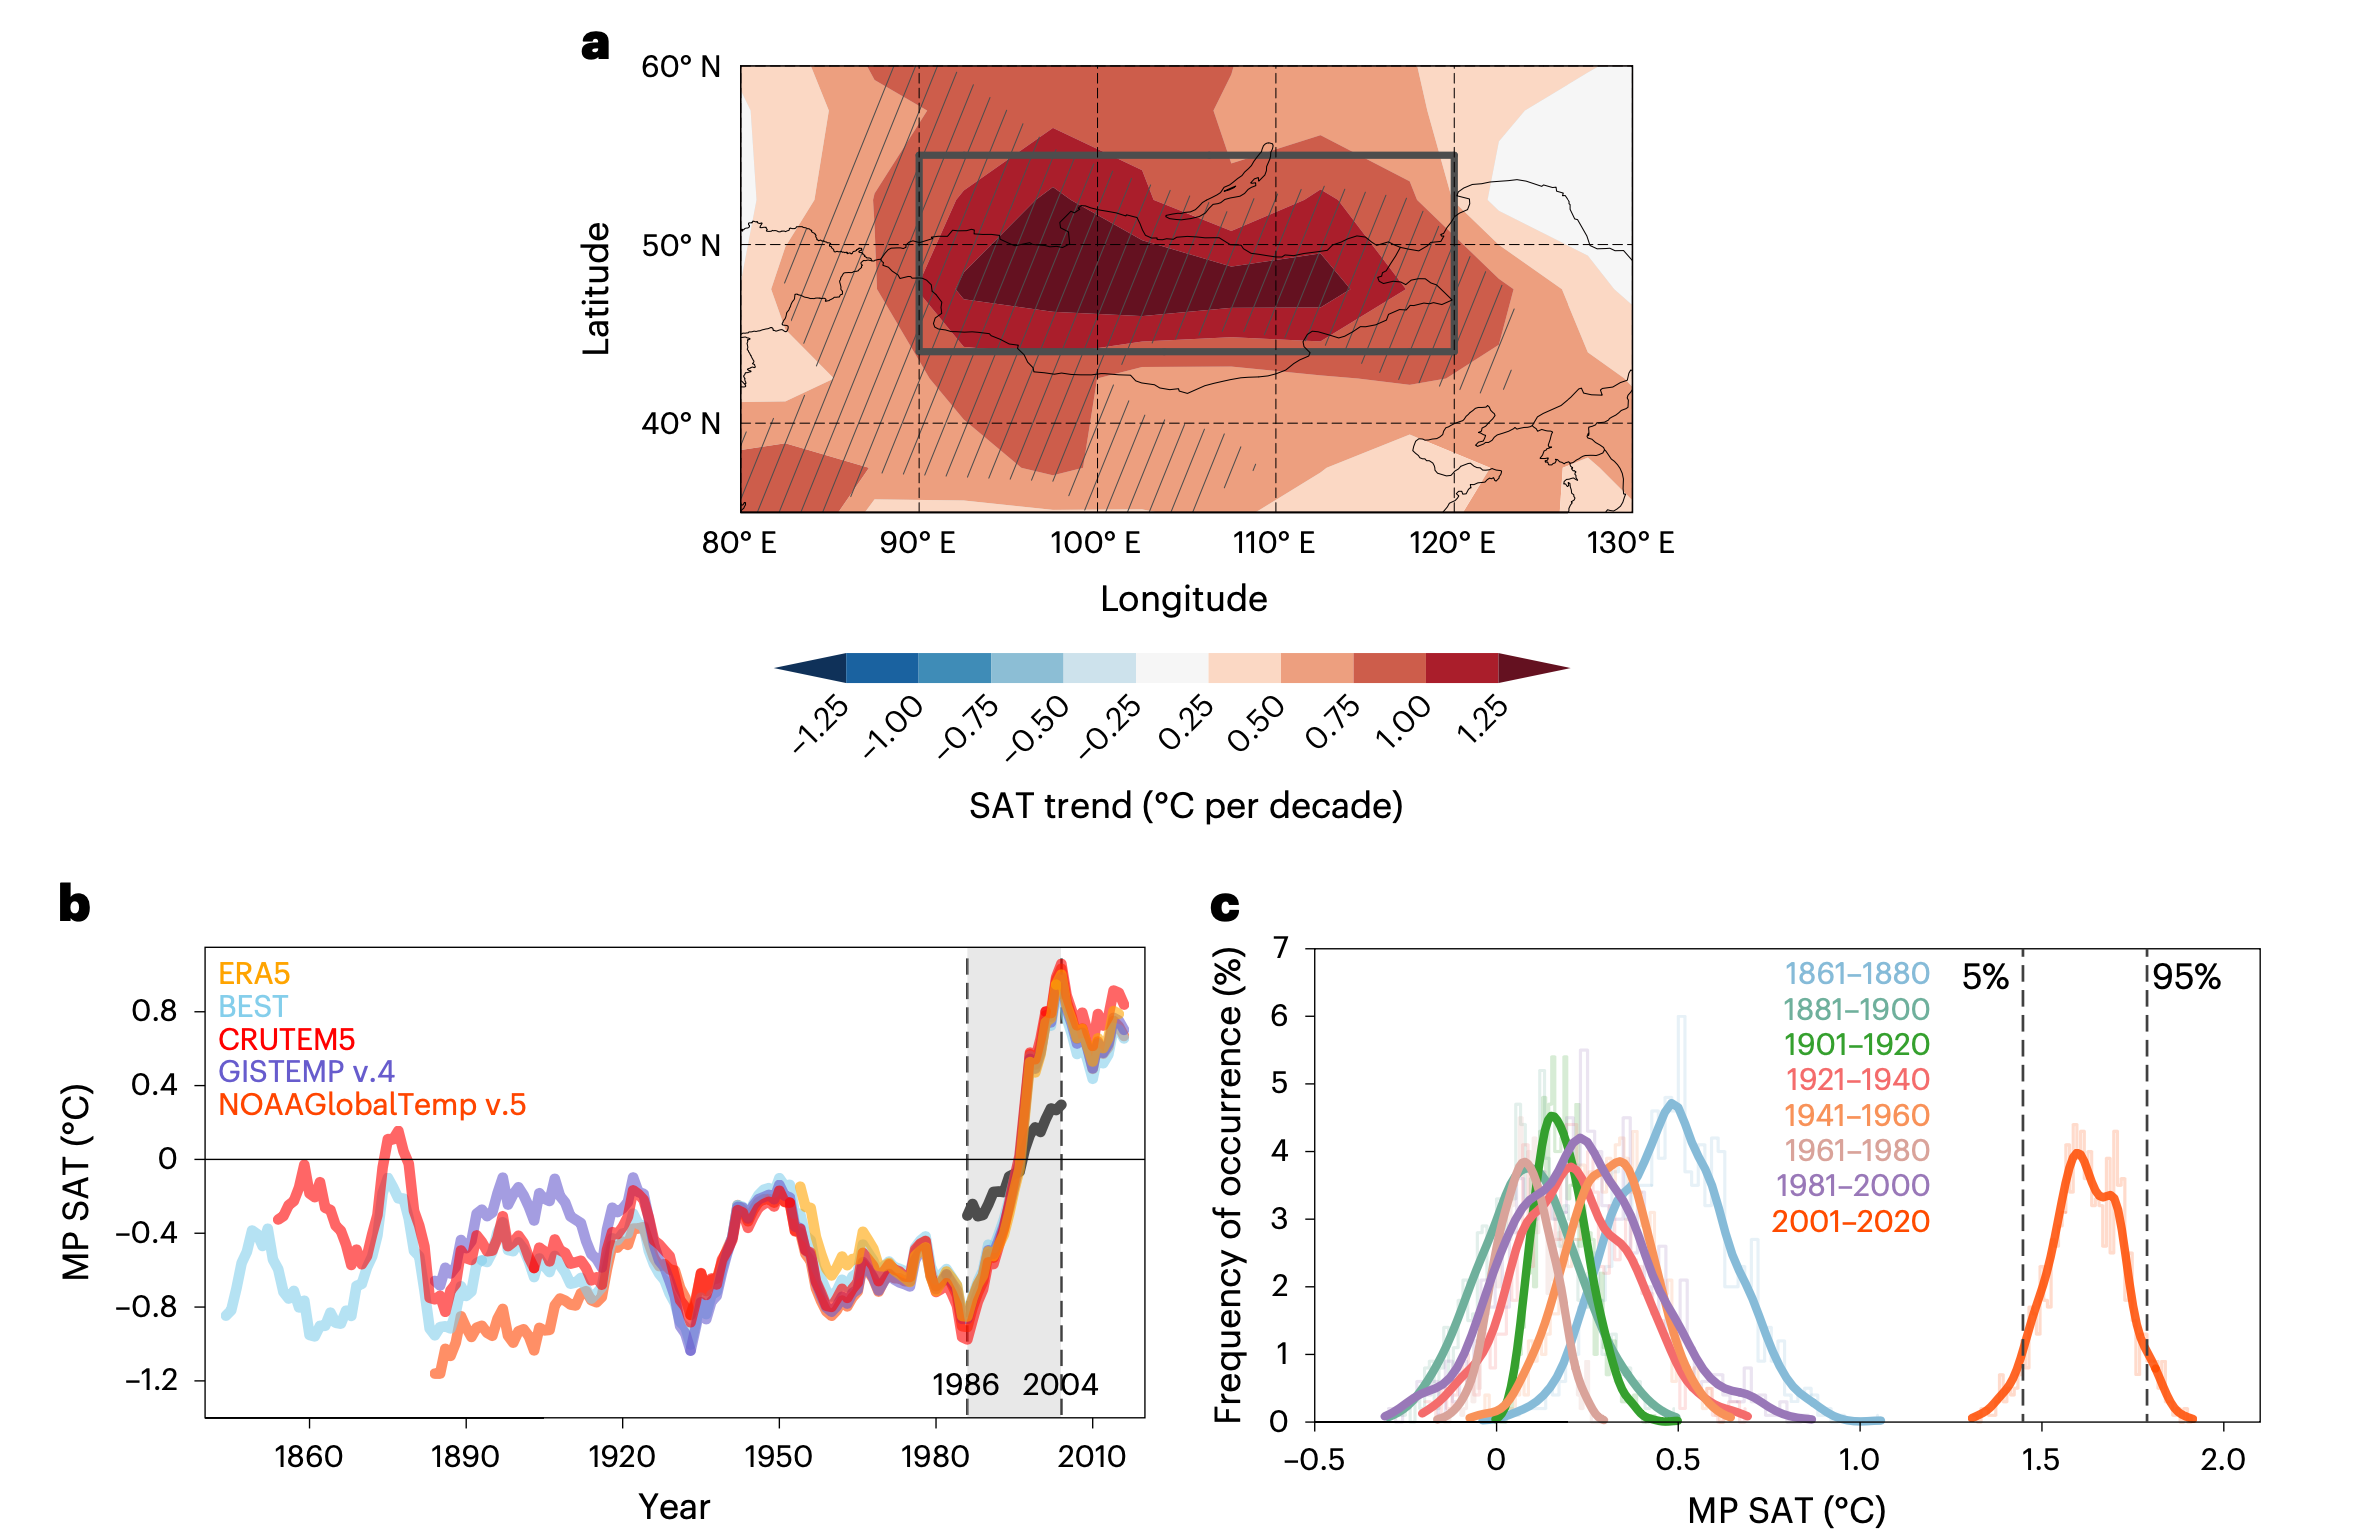
Based on multiple sets of observations and reanalyzed data, we found that the exceptionally strong warming was observed over the MP during the summer of 1986-2004 (Figs. 1a and 1b). In terms of spatial dimension, the MP is the fastest warming region in the Northern Hemisphere, with a rate of warming three times faster than the averaged land warming in the Northern Hemisphere. In terms of temporal dimension, the probability distributions of summer temperature over the MP have been adjacent to each other for the past 100 years. However, the distribution in the last two decades is outside the previous range of variability (Fig. 1c). In other words, the MP temperatures in the last two decades are unprecedented, due to unusually strong warming.

Fig. 1 Surface air temperature (SAT) of Mongolian Plateau (MP). a Spatial distribution of the summer SAT trend (shading, units: °C per decade) over the MP during 1986–2004 based on the CRUTEM5 dataset. Grey box indicates the area used to define the MP region (44°–55°N, 90°–120°E). Hatching denotes trends significant above the 95% confidence level. b Time series of the 9-year running mean of the summer SAT anomalies (relative to the 1981–2010 mean) over the MP derived from the ERA5, BEST, CRUTEM5, GISTEMP v4, and NOAAGlobalTemp v5 datasets. The grey shading shows the abrupt warming period (1986–2004). The black line denotes the time series of the 9-year running mean of the summer SAT anomalies averaged over the terrestrial Northern Hemisphere (NH). c Frequency distributions of the mean summer SAT anomalies (relative to the 1981–2010 mean) over the MP for every 20 years from 1861–2020 based on the CRUTEM5 dataset using the block-bootstrapping method (the block length is 3).
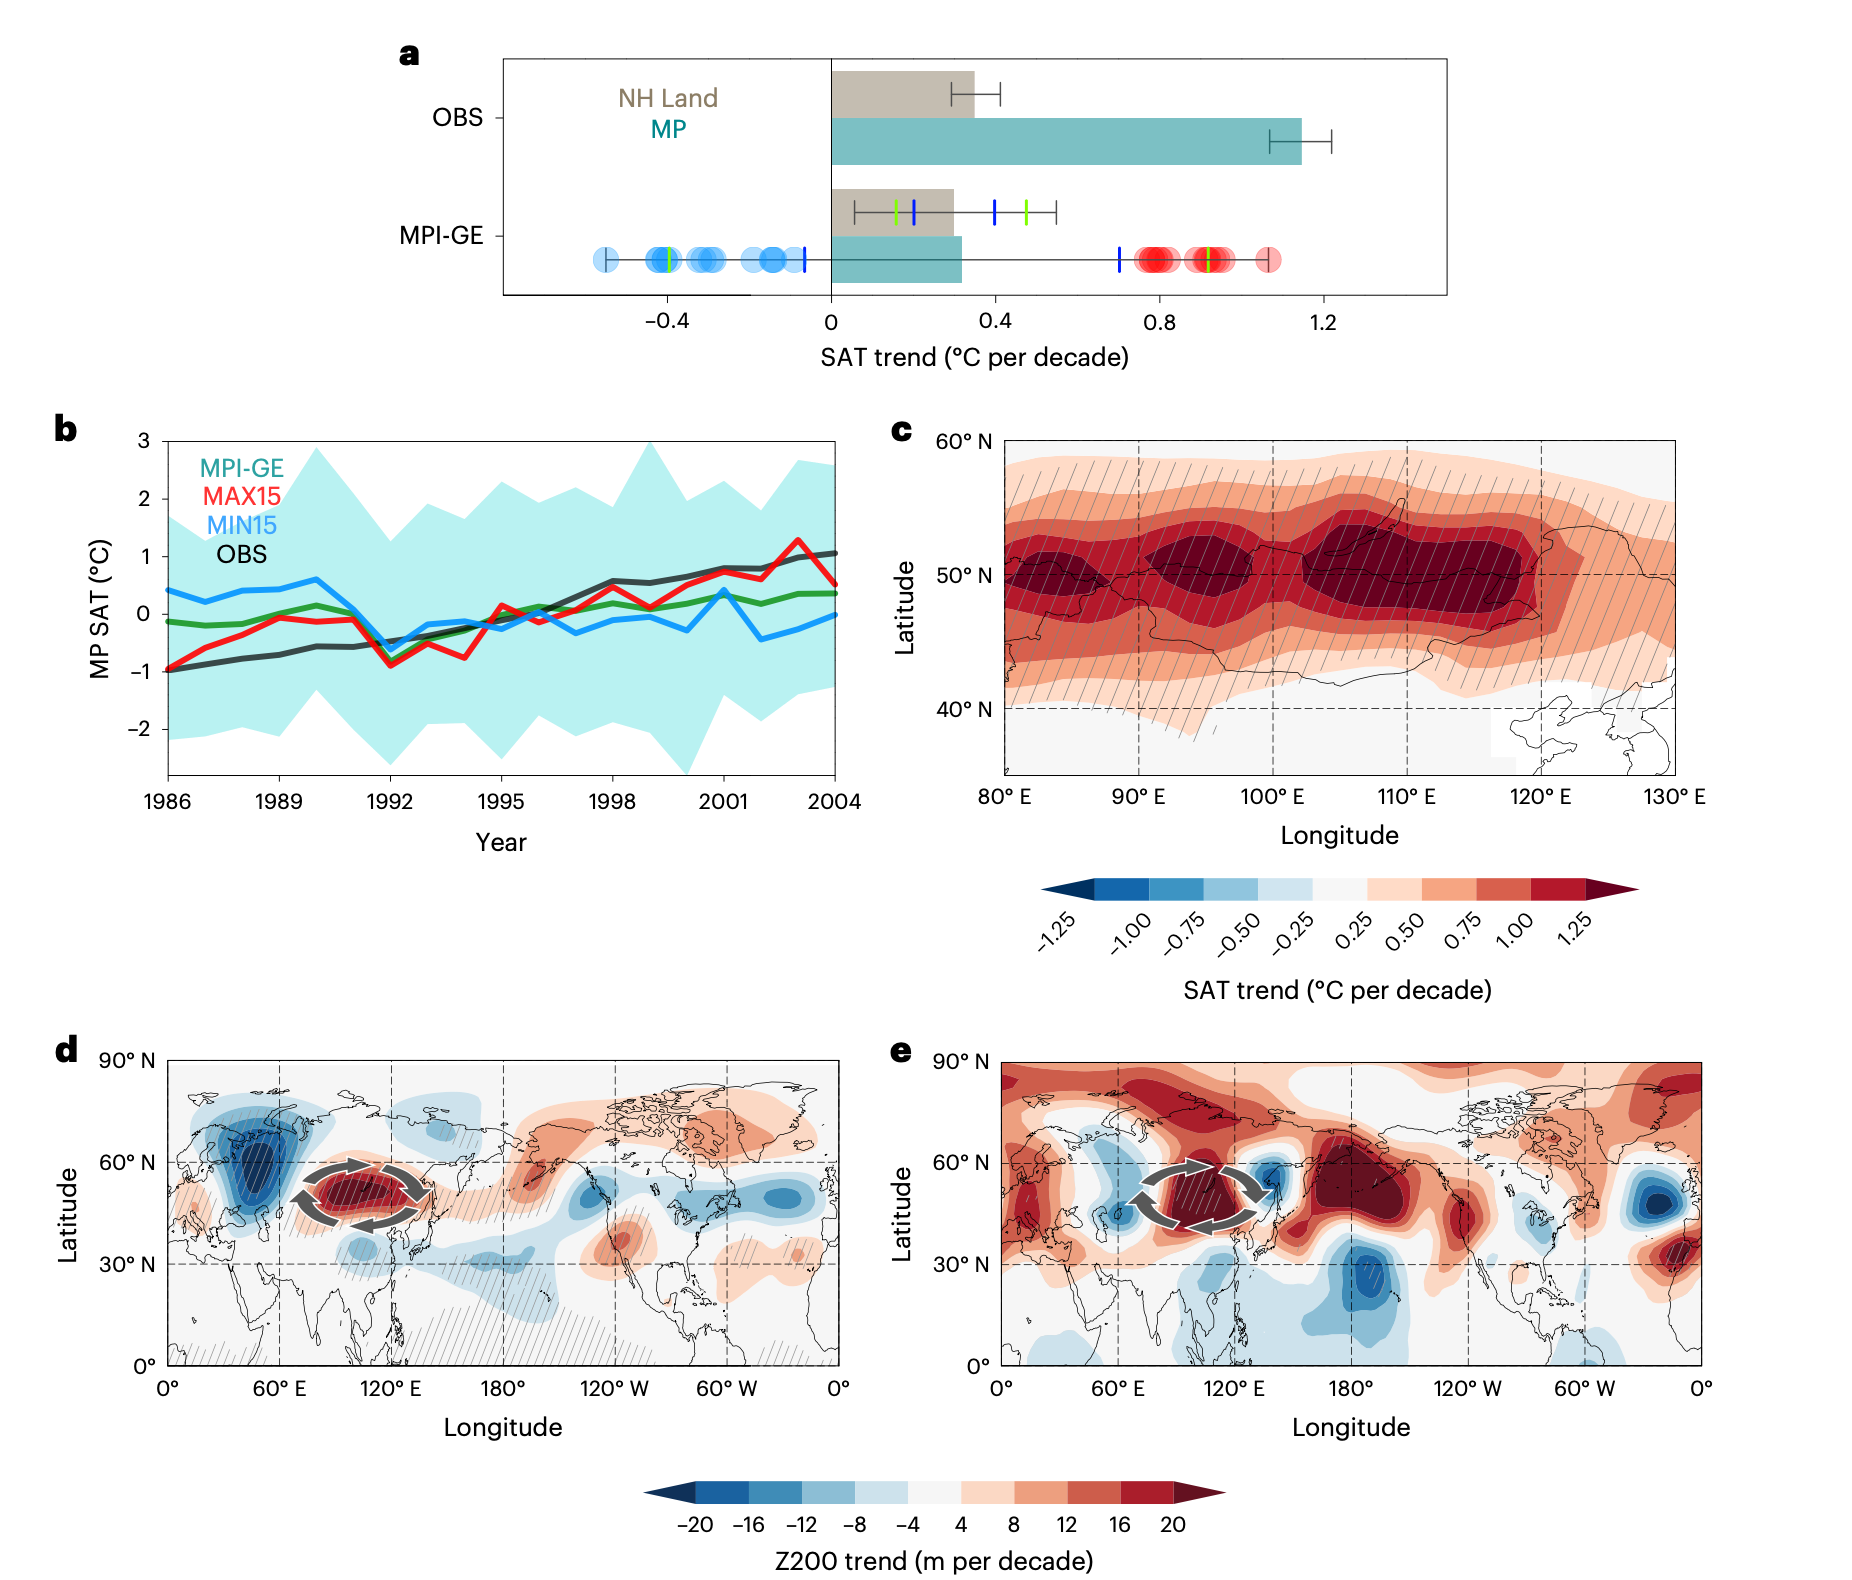
We found that the external forcing (such as anthropogenic emissions of greenhouse gases and sulfate aerosols) cannot fully explain this exceptionally strong warming over the MP (Fig. 2a), and the synchronous phase shift of the Interdecadal Pacific Oscillation (IPO) and Atlantic Multidecadal Oscillation (AMO), the dominant SST decadal variability in the Pacific and Atlantic, respectively, contributed to this strong warming over the MP. Observations analyses, large ensemble simulations, pacemaker experiments, and AMIP experiments consistently show that the positive-to-negative phase shift of the IPO and the negative-to-positive phase shift of the AMO (Fig. 3) can trigger a mid-latitude atmospheric wave train that targets an anticyclonic circulation trend over the MP (Figs. 2d and 2e). This anticyclonic circulation boosted the MP surface warming through increased downward solar radiation and land-air feedbacks. Our results highlight the important role of internal climate variability in driving the rapid regional climate change over the MP.

Fig. 2 External forcing is insufficient to explain the observed abrupt and exceptionally strong warming over the MP. a The averaged summer SAT trend over the NH (grey bars) and MP (green bars) based on the observation and MPI-GE during 1986–2004. The grey error bars indicate the observational and ensemble member spread (from minimum to maximum value). The green error bars denote the 5th and 95th percentiles of the ensemble members. The blue error bars denote one standard deviation among the ensemble members. The measure of center for the error bars is indicated by the corresponding grey/green bar. The red and blue dots show the 15 ensemble members of MPI-GE with the largest warming (MAX15) and cooling (MIN15) of the SAT trend of the MP. The MP is defined as the region (44°–55°N, 90°–120°E) as shown by the grey box in Fig. 1a. The sample size is 100. b Time series of the 9-year running mean of the summer SAT anomalies (relative to the 1981–2010 mean) over the MP derived from CRUTEM5 (black line). The green line denotes the ensemble mean time series of the MP SAT from the 100 MPI-GE members. The red and blue lines are the same as the green line but for MAX15 and MIN15. The green shading represents the uncertainty due to the internal variability. c Composite differences in the trend of summer SAT (shading, units: °C per decade) over the MP between MAX15 and MIN15. d As in c but for geopotential height at 200 hPa (shading, units: m per decade). e Spatial distribution of the observational trend of summer geopotential height at 200 hPa (shading, units: m per decade) during 1986–2004 based on ERA5. The clockwise arrow symbol denotes the anticyclonic trend over the MP. Hatching denotes trends significant at the 95% confidence level.

Fig.3 Time series of the 19-year running mean of the IPO and AMO indexes derived from ERSST.v5. The grey shading shows the abrupt warming period (1986–2004). Hatching denotes trends significant at the 95% confidence level. For definitions of the IPO and AMO, refer to section of the Methods.
Follow the Topic
-
Nature Geoscience

A monthly multi-disciplinary journal aimed at bringing together top-quality research across the entire spectrum of the Earth Sciences along with relevant work in related areas.
Related Collections
With Collections, you can get published faster and increase your visibility.
Past sea level and ice sheet change
Publishing Model: Hybrid
Deadline: Mar 31, 2026
Lithium and copper resources for net zero
Publishing Model: Hybrid
Deadline: Feb 28, 2026


Please sign in or register for FREE
If you are a registered user on Research Communities by Springer Nature, please sign in