The Fractal Geometry of Innovation
Published in Social Sciences, Ecology & Evolution, and Physics
Why do certain cities become hubs of innovation in certain technologies? In the US, Silicon Valley, Boston, and Seattle evoke creativity, risk, and reinvention. Yet when we look at the historical records of patenting, we find that innovation isn’t circumscribed to a few hubs. Instead, innovation clusters, scales, and repeats—forming patterns that look strikingly fractal.
Patterns in the Innovation Landscape
Using data from over 100 years of U.S. patents, we analyzed the geometry of innovation across eight major technology domains—from biotech to AI. We found three recurring statistical patterns that, together, describe how innovation self-organizes in space:
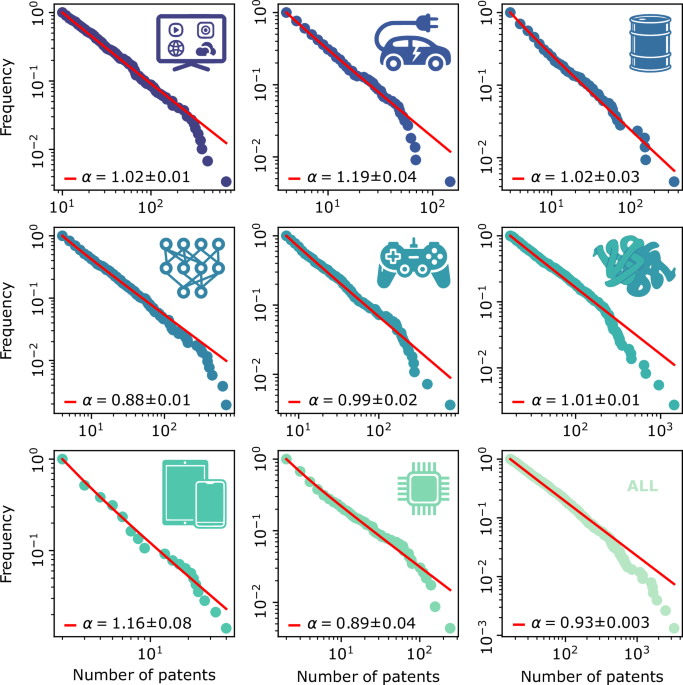
- Scaling: patent output follows Zipf’s law — a few hubs dominate, many smaller centers persist.
- Fractal clustering: innovation hubs nest within larger regional hierarchies.
- An “inequality horizon”: spatial inequality in patenting peaks at around 20 km, then declines.
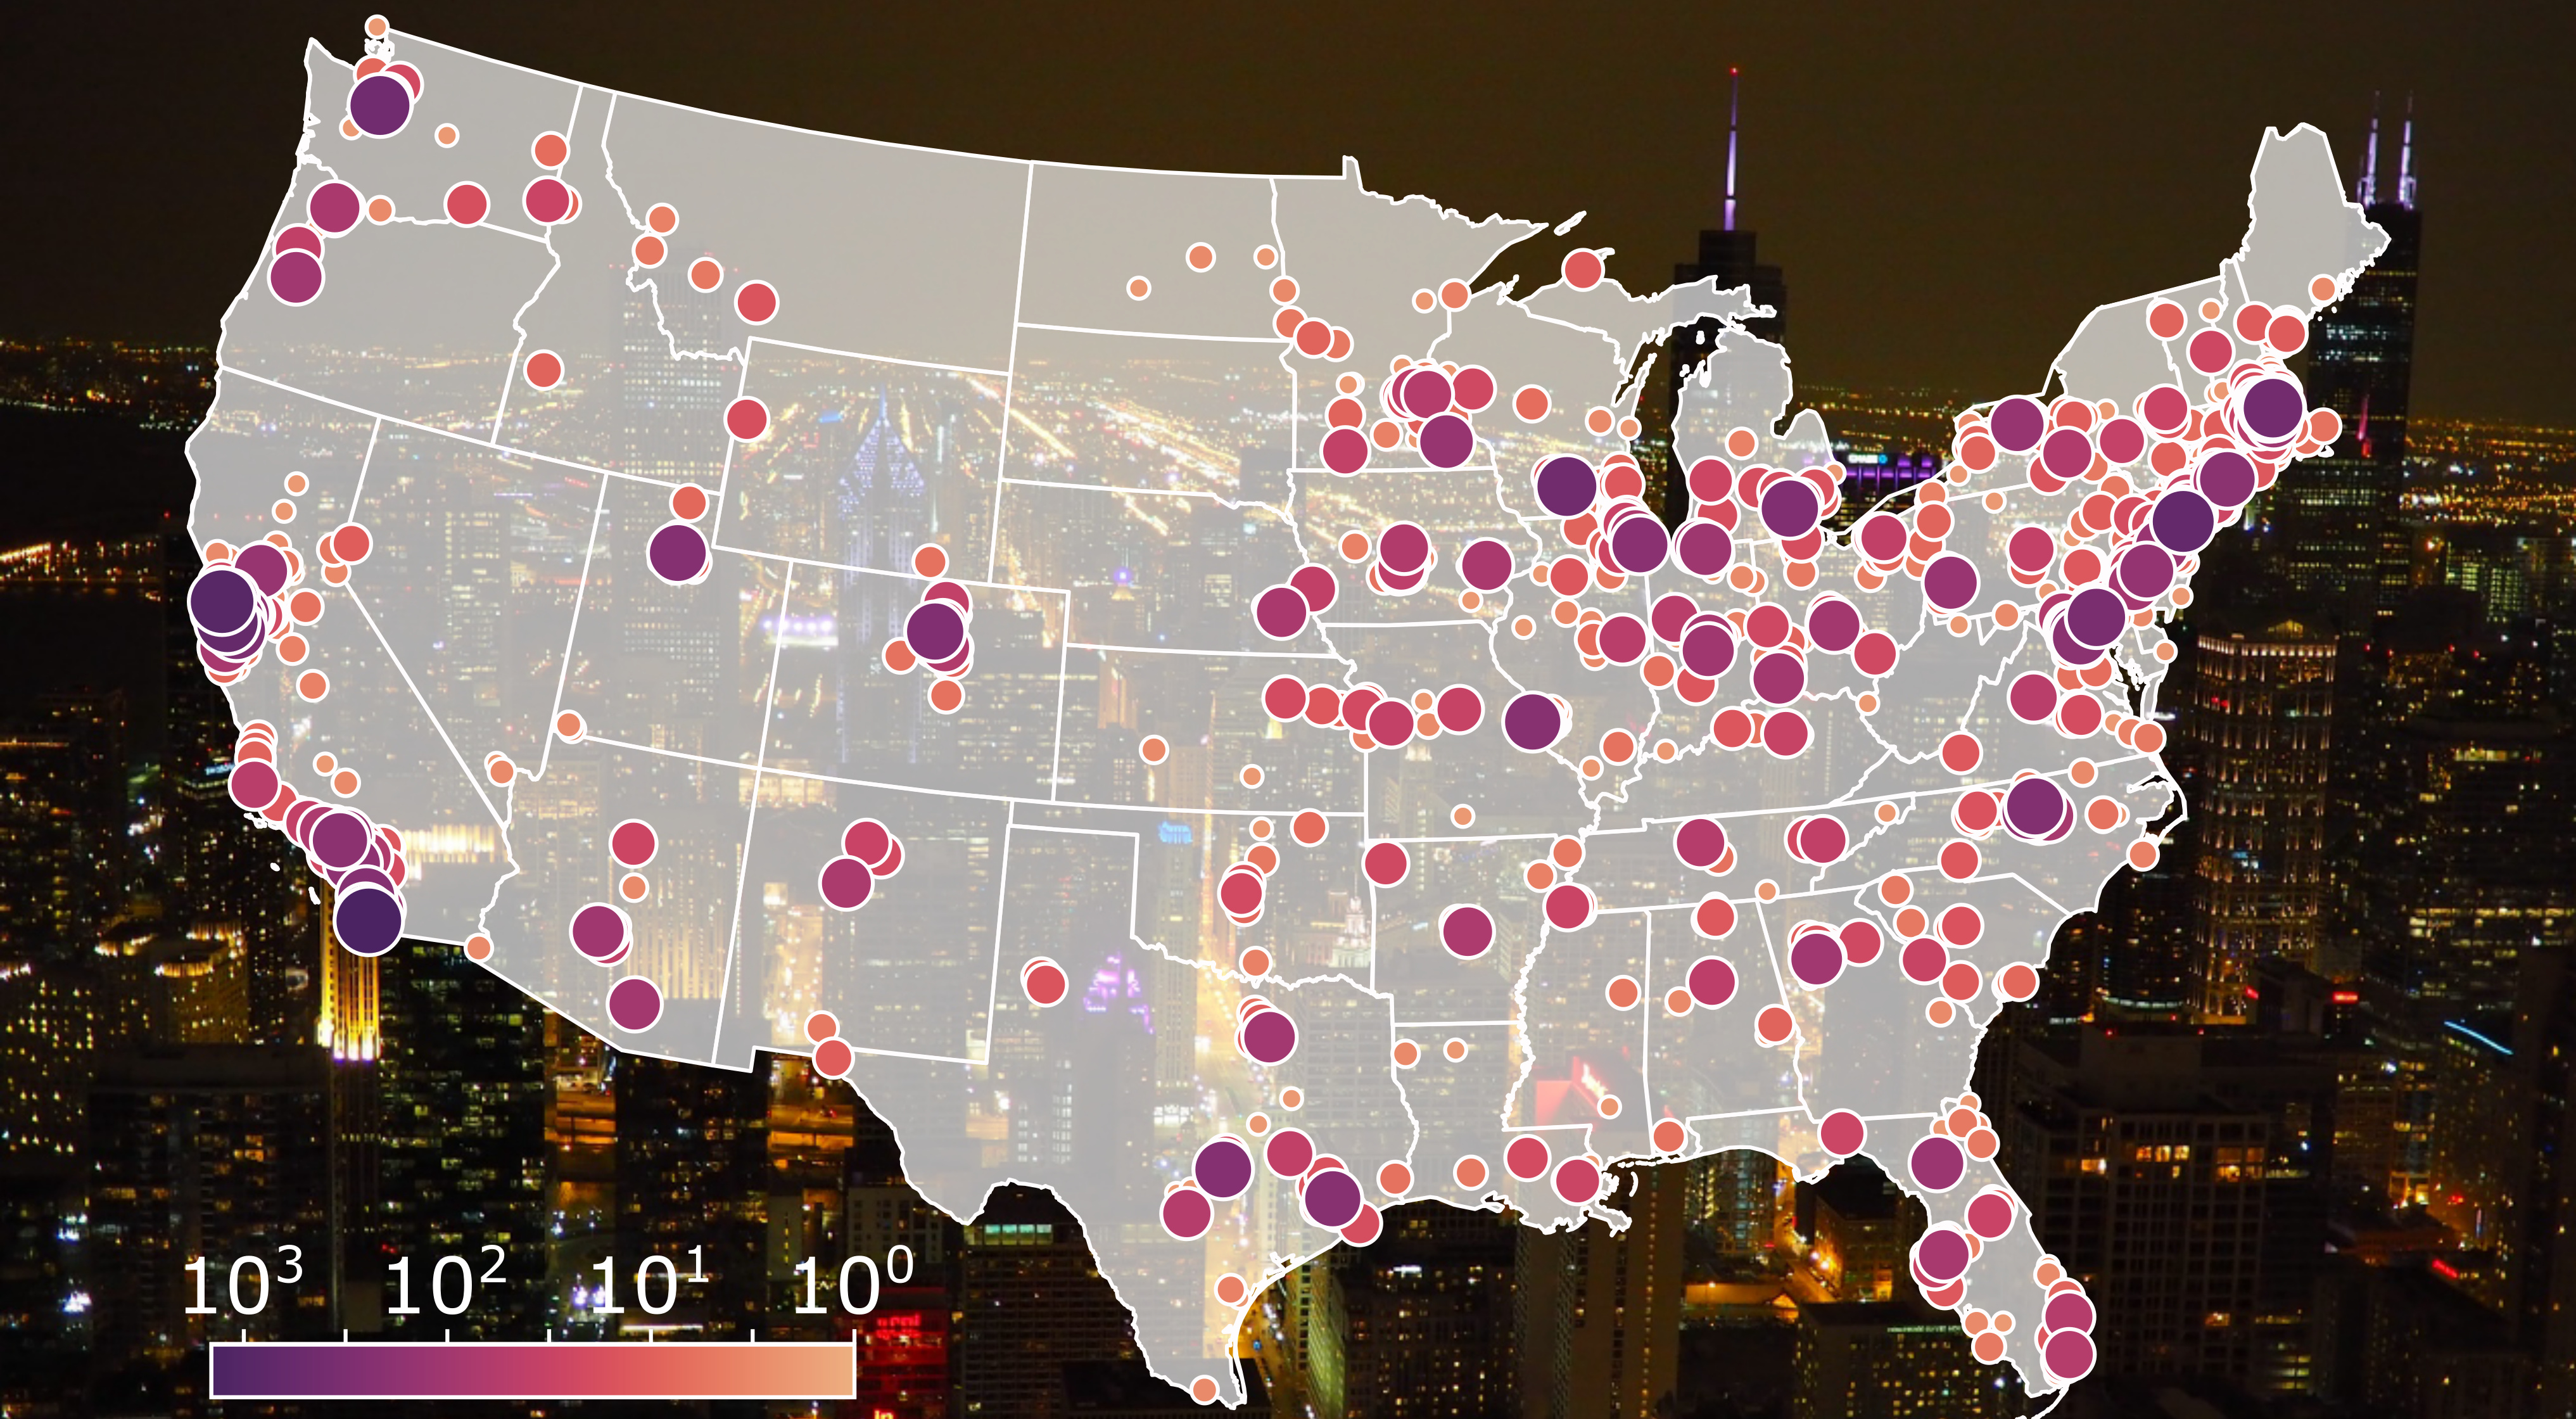
The following figure exemplifies these patterns in one domain, i.e., the End-User Applications sector (24,165 patents, CPC code H04N 21/47). This technology covers interactive multimedia and digital services, from local apps to high-bandwidth uplink technologies, highlighting the rise of consumer digital media:
 fractal distribution of patenting, (b) Zipfian scaling, (c) inequality horizon for a single system, e.g. end-user apps]")
These patterns suggest that innovation behaves more like a structured landscape, shaped by the geometry of human connections, rather than an accidental scattering of ideas.
To reveal this structure, we used a geometric network that grows as inventors connect through proximity and shared ideas. Imagine drawing circles of increasing radius (R) around every inventor. As the circles grow, nearby inventors link into local clusters, which then merge into larger regional networks:
We discovered a scaling law by counting how the number of connected clusters (Nc) changes with radius R,
Nc(R) ~ R-β .
This is the equation for a fractal, where the exponent ß is strongly related to the fractal dimension. In simpler terms, this fractal structure means that innovation networks look similar as you zoom in or out. Small clusters of inventors are embedded within larger regions, forming a self-similar, fractal structure that spans spatial scales.
A Model of Spatial Innovation
To explore the mechanisms behind these patterns, we built a minimal model showing how innovation can self-organize in space. This model rests on two ingredients: local reinforcement (success breeds success) and long-range diffusion (ideas and people occasionally travel large distances). In the interplay of these two rules, the observed patterns of scaling, clustering and inequality emerge naturally.
Mathematically, the model predicts a characteristic scale—the inequality horizon—where the tendency of ideas to cluster (aggregation) balances with their capacity to spread (diffusion). At smaller scales, local reinforcement takes precedence, and inequality rises as hubs grow stronger. Beyond that horizon, diffusion smooths disparities, connecting regions into a broader system.
Taylor's law, an empirical pattern, explains this balance by connecting the mean activity in a region to its variability. In our model, variability peaks at the inequality horizon—the point where concentration is strongest before diffusion evens it out.
In essence, inequality is not imposed from above but emerges from the trade-off between concentration and exploration—a hallmark of complex adaptive systems.
Why this matters
We find that the geography of innovation is fractal—it cannot be reduced to a few dominant hubs like Silicon Valley or a few celebrated individuals. Instead, innovation is a collective process that unfolds across time, scale, and collaborators in the past and present.
The geometry of innovation reflects its social nature: innovation depends on how people, ideas, and resources interact.
Understanding this geometry reframes how we think about equitable growth. Simply increasing population density or redirecting investment into large cities does not automatically spark creativity. What matters more is connectivity—the spatial and social links that allow ideas to circulate within that 20-km horizon and beyond.
Policies that strengthen regional bridges—co-working corridors, transit links, university–industry partnerships—can help distribute opportunity while preserving the benefits of agglomeration. Recognizing that innovation spreads through networks rather than hierarchies allows us to design systems that are both productive and inclusive.
Just as architecture depends on both material and form, innovation ecosystems rely on both human creativity and spatial structure. Recognizing this geometry offers a window into the mechanisms that drive the emergence and diffusion of new ideas, revealing how interactions give rise to complex technology.
Follow the Topic
-
npj Complexity
This is an open access, international, peer-reviewed journal dedicated to publishing the highest quality research on complex systems and their emergent behaviour at multiple scales.

Related Collections
With Collections, you can get published faster and increase your visibility.
Unnatural Histories: Investigating the Improbable with Experimental Evolution and Artificial Life
Publishing Model: Open Access
Deadline: Sep 12, 2026
Nonlinear dynamics of living systems
Publishing Model: Open Access
Deadline: Nov 09, 2026


Please sign in or register for FREE
If you are a registered user on Research Communities by Springer Nature, please sign in