Unveiling GLEAM4: The latest breakthrough in global land evaporation
Published in Earth & Environment, Research Data, and Sustainability
Evaporation — i.e. the transport of water from land to atmosphere — plays a vital role in regulating climate, weather patterns, and agricultural practices. However, accurately measuring evaporation on a global scale is challenging. To address this challenge, our recent paper in Scientific Data presents GLEAM4 (the latest version of the Global Land Evaporation Amsterdam Model). GLEAM4 provides enhanced evaporation and soil moisture estimates based on a suite of observational datasets covering the past four decades.
In this blog post, we explore why evaporation matters, how GLEAM4 improves on previous dataset versions, and why it can be a game-changer for climate and water resource studies.
Why Is Land Evaporation Important?
Evaporation (or 'evapotranspiration') is the process by which water moves from the Earth’s surface into the atmosphere. This happens in several ways:
- Transpiration – Vaporisation from plant cells and released mainly through their stomata
- Soil evaporation – Vaporisation directly from the soil pores
- Interception loss – Vaporisation from wet surfaces during or directly after rainfall
- Open-water evaporation – Vaporisation of water bodies such as lakes and rivers
- Sublimation – Vaporisation from snow-covered surfaces
Understanding evaporation processes is crucial since they influence global climate patterns, drive droughts and floods, and determine how much water is left available for agriculture and hydrological management. Despite its importance, evaporation estimates remain highly uncertain, partly due to the inability to measure evaporation directly from satellite sensors. That’s where GLEAM comes in.
What Is GLEAM and How Does It Work?
GLEAM is a satellite data-driven model that estimates land evaporation and soil moisture worldwide using a hybrid (AI and process-based) approach. It leverages satellite observations, in situ measurements, and meteorological reanalysis to calculate how much water evaporates from the land surface. GLEAM4 provides daily data from 1980 to near present at 0.1° resolution, significantly improving the spatial detail in previous versions.
How Does GLEAM4 Work?
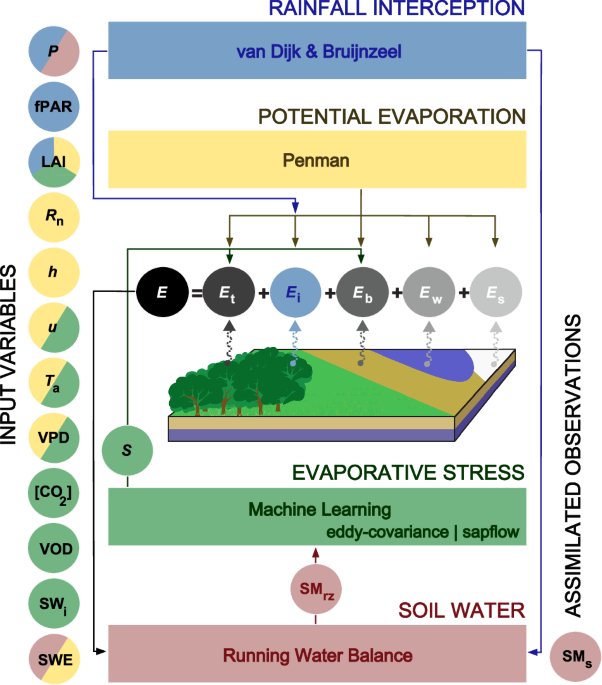
GLEAM4 follows a modular approach to estimate evaporation (and its components) as outlined in Figure 1.
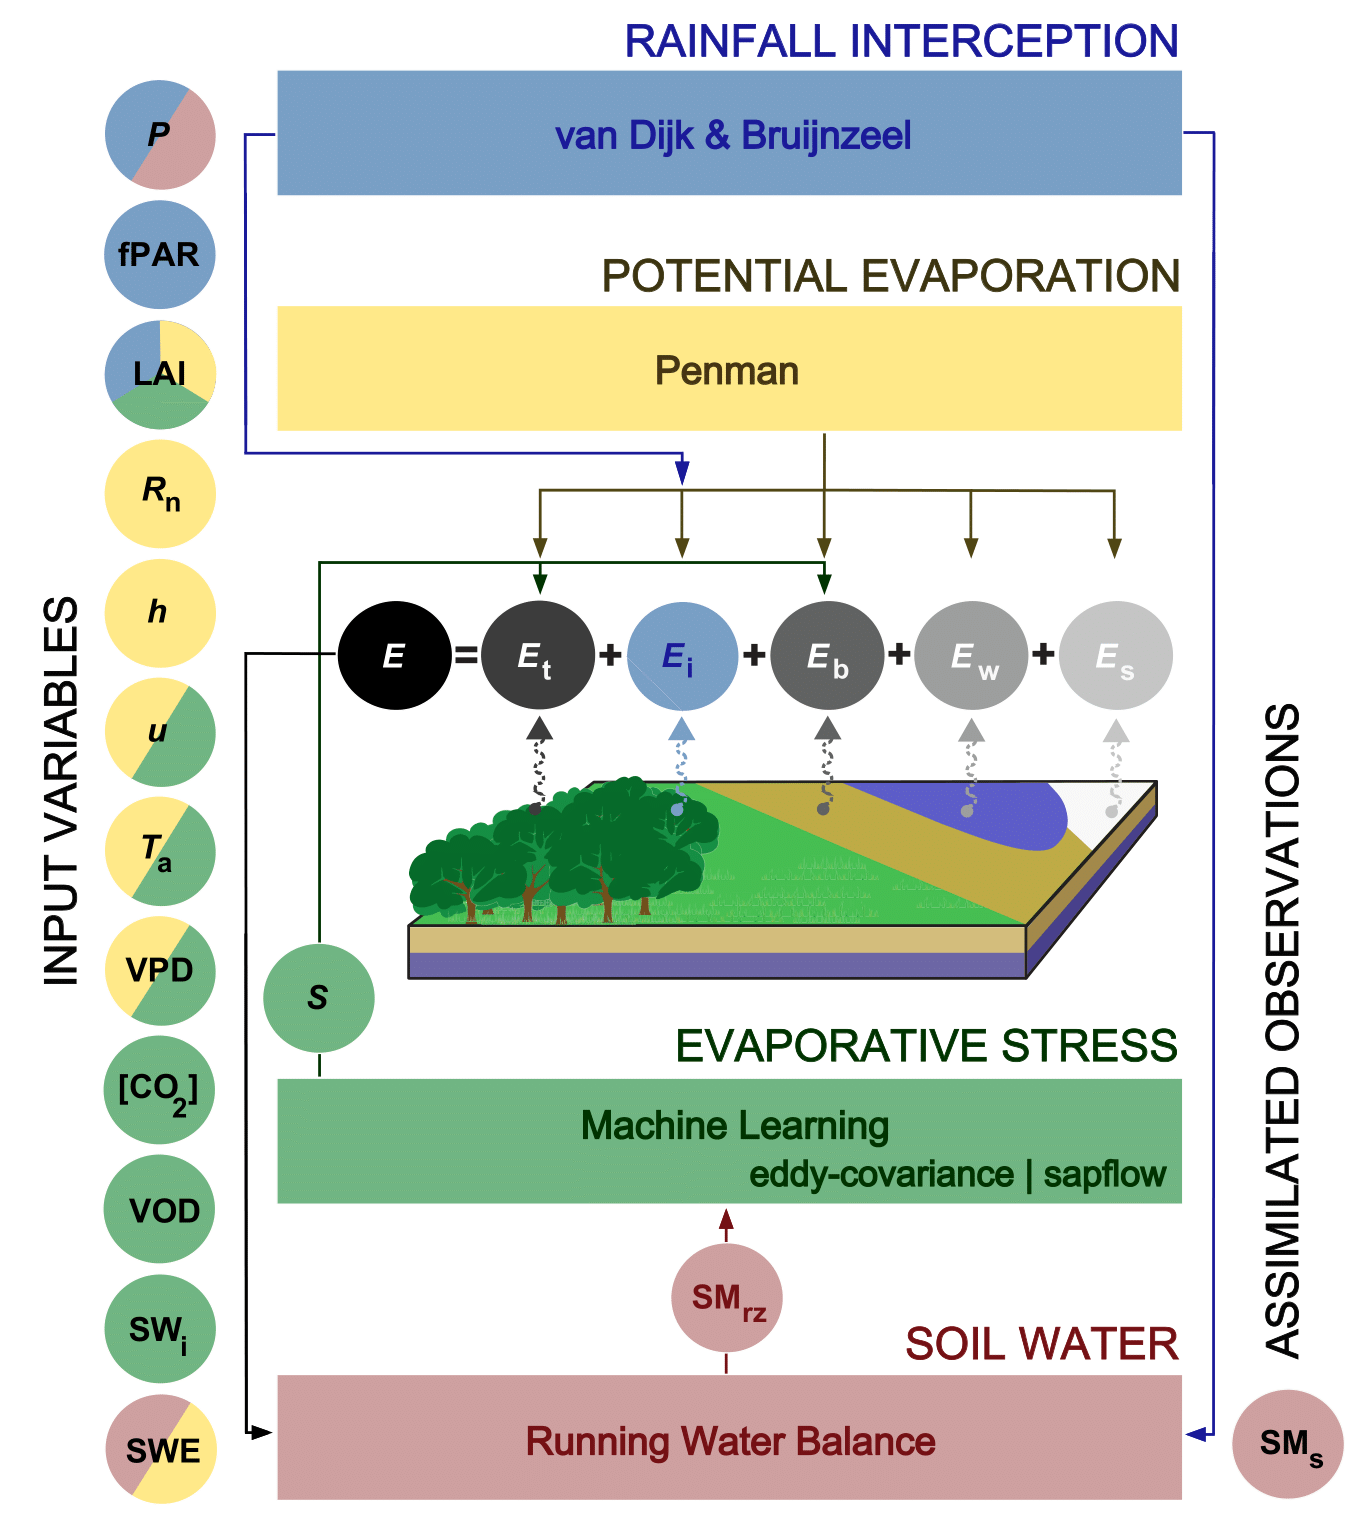
Schematic of GLEAM4. The variables' colour denotes the module in which they are employed. Precipitation (P), fraction absorbed photosynthetic radiation (fPAR), leaf area index (LAI), net radiation (Rn), vegetation height (h), wind speed (u), air temperature (Ta), vapour pressure deficit (VPD), carbon dioxide concentration ([CO2]), vegetation optical depth (VOD), shortwave incoming radiation (SWi), snow water equivalent (SWE), stress factor (S), root-zone soil moisture (SMrz), microwave surface soil moisture (SMs), total evaporation (E), transpiration (Et), interception loss (Ei), soil evaporation (Eb), open-water evaporation (Ew), and sublimation (Es).
-
Rainfall interception – Calculates how much rainwater is temporarily stored on the plant surface and evaporates directly before reaching the ground.
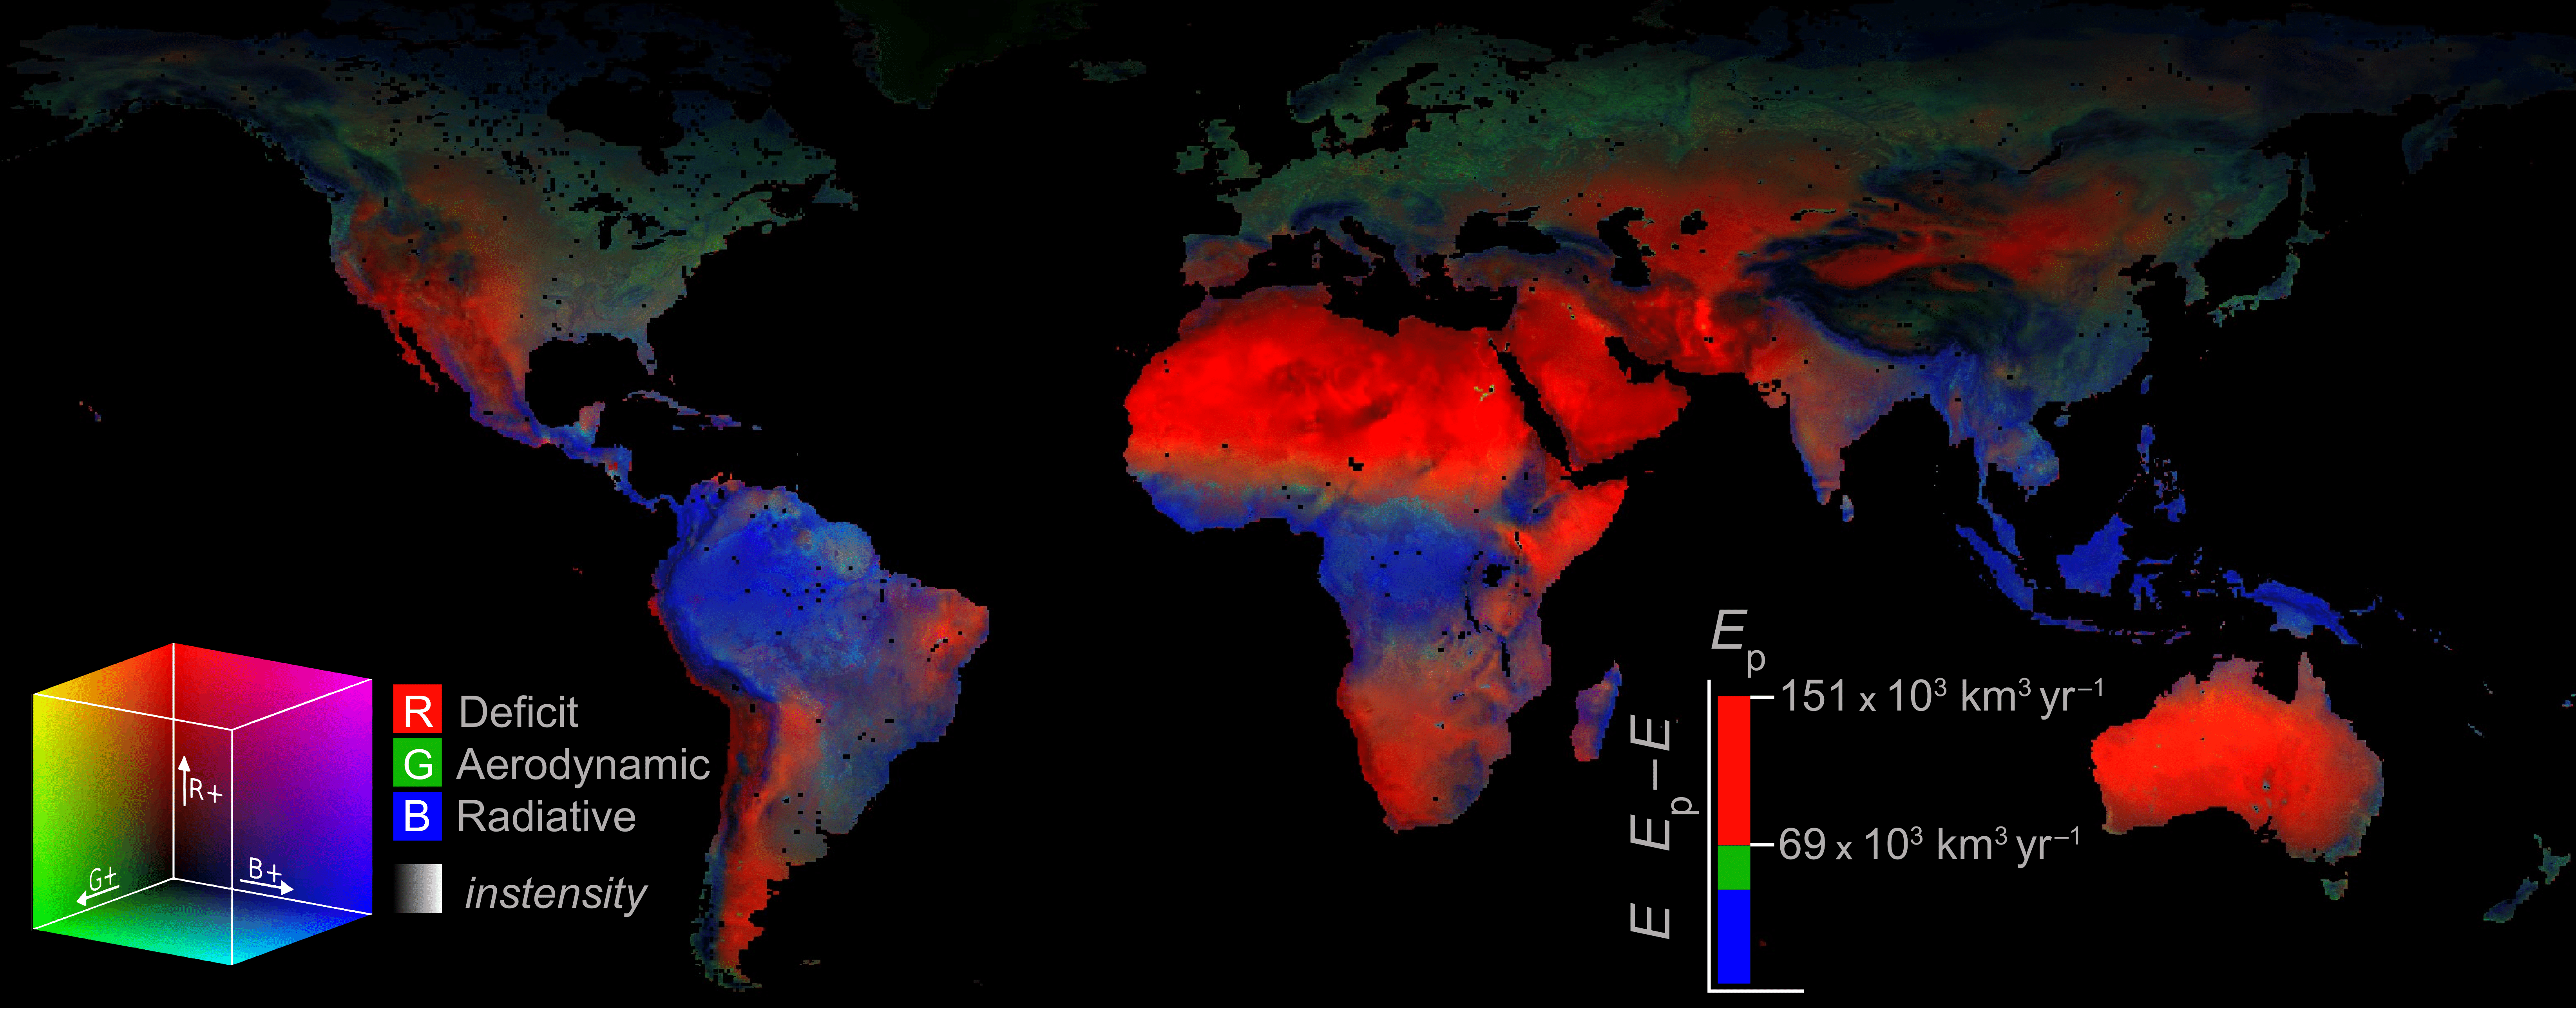
- Potential evaporation – Determines how much water could evaporate, by representing the atmospheric demand for water as a function of radiation, temperature, wind and humidity data.
- Soil water balance – Tracks how much water is available in the soil profile for evaporation.
- Evaporative stress – Uses soil moisture among other variables in a deep neural network trained using eddy-covariance and sapflow data to estimate evaporative stress. By multiplying potential evaporation with the resulting stress factor, an estimate of actual evaporation is obtained.
By combining satellite, reanalysis and in situ data, physics-based equations, and AI, GLEAM4 provides a comprehensive and accurate picture of daily global evaporation and soil moisture patterns. Figure 2 illustrates the long-term mean annual land evaporation for 1980–2023.
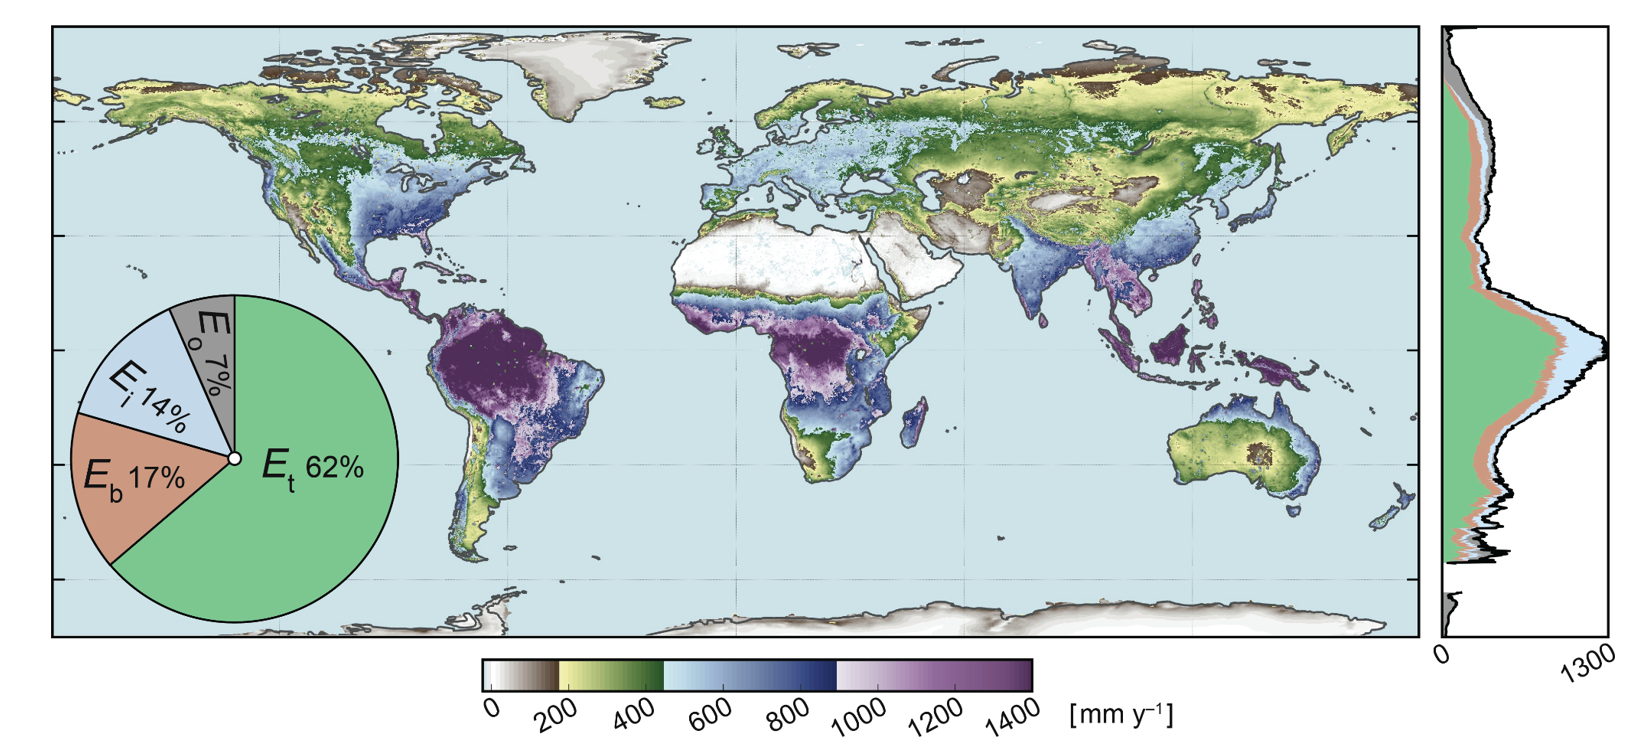
Long-term (1980–2023) mean terrestrial evaporation (E, mm y-1). The global decomposition of its component fluxes is shown in the pie diagram and the latitudinal profile on the right.
What’s New in GLEAM4?
GLEAM4 introduces several improvements over its previous versions, making it more precise and useful for climate research:
✅ Higher Resolution – Now at 0.1° spatial resolution, improving regional detail.
✅ Extended Data Range – Covering 1980 to near present, offering over 40+ years of data.
✅ Improved rainfall interception – Updated rainfall interception model, allowing interception calculation for both tall and short vegetation.
✅ Updated potential evaporation framework – More advanced Penman method to calculate potential evaporation, taking into account both radiative and aerodynamic demand.
✅ Enhanced representation of evaporative stress – Deep neural networks trained with in situ data to predict stress, based on multiple atmospheric and vegetation variables.
✅ Inclusion of plant access to groundwater – Considering deep-rooted plant access to groundwater and its influence as a contributor to transpiration.
These updates make GLEAM4 more reliable and applicable to a wider range of scientific and practical applications.
How Can You Access GLEAM4?
GLEAM4 is freely available and can be accessed via:
🌍 The GLEAM Website: www.gleam.eu
Would you like to use GLEAM4 in your research and in real-world applications? Let us know in the comments!
Follow the Topic
-
Scientific Data
A peer-reviewed, open-access journal for descriptions of datasets, and research that advances the sharing and reuse of scientific data.

Related Collections
With Collections, you can get published faster and increase your visibility.
Computer vision in plant science and agriculture
Publishing Model: Open Access
Deadline: Oct 10, 2026
Wearable and Computer Vision Data for Health and Behaviour Research
Publishing Model: Open Access
Deadline: Aug 08, 2026

Please sign in or register for FREE
If you are a registered user on Research Communities by Springer Nature, please sign in