A comprehensive benchmarking with interpretation and operational guidance for the hierarchy of topologically associating domains
Published in Genetics & Genomics

What motivated us to benchmark TAD hierarchy callers
Topologically associating domains (TADs), megabase-scale features of chromatin spatial architecture, are organized in a domain-within-domain TAD hierarchy. Within TADs, the inner and smaller subTADs not only manifest cell-to-cell variability, but also precisely regulate transcription and differentiation. Accurate identification of TAD hierarchy is particularly important for biomedical research. Although over 20 TAD callers are able to detect TAD, their usability in biomedicine is confined by a disagreement of outputs and a limit in understanding TAD hierarchy. Furthermore, a few critical problems remain to be solved: whether TAD hierarchy is generated simply from stacking Hi-C heatmaps of heterogeneous cells, what the mechanism of its formation is, and how it acts on gene regulation. Besides, confusion arises when picking out tools for detecting TAD hierarchy.
To address these problems, we compared the performance of 13 computational methods for TAD hierarchy prediction in robustness (matrices-normalization, various resolutions, and various sequencing depths), epigenomic features, and tools usability. Hierarchy similarity is evaluated by a metric we developed and one metric previously reported. Among these methods, we hope to give biomedical researchers tools-recommendation for appropriate datasets or special studies and convey a comprehensive elucidation on TAD hierarchy both in structural definition and in unique functions on gene regulation.
Variation of hierarchical TAD structures from different algorithms
Short of the metric to compare such domain-within-domain structure, we developed hierarchy structural similarity (Hier_SSIM) (see the Methods) using structural similarity to judge the similarity of the output heatmap (Fig. 1a). We obtain the output results from all the tools on 10 Kb data of GM12878 cell line and four main clusters (Fig. 1b, c). Since lack of a conclusive gold standard to evaluate the accuracy of TAD prediction, it’s a feasible option to judge the correlation with biological features. Given that TAD boundaries are always anchored by architectural proteins such as CTCF and cohesion, we compared the enrichment of CTCF and SMC3 (subunit of cohesin protein complex) at TAD boundaries from all tools. Both markers show sharp signal peak on OnTAD, HiTAD, Armatus, deDoc, matryoshka, Arrowhead, and SpectralTAD. GMAP and GRiNCH show good correlation with CTCF signal peak around boundaries (Fig. 1d).
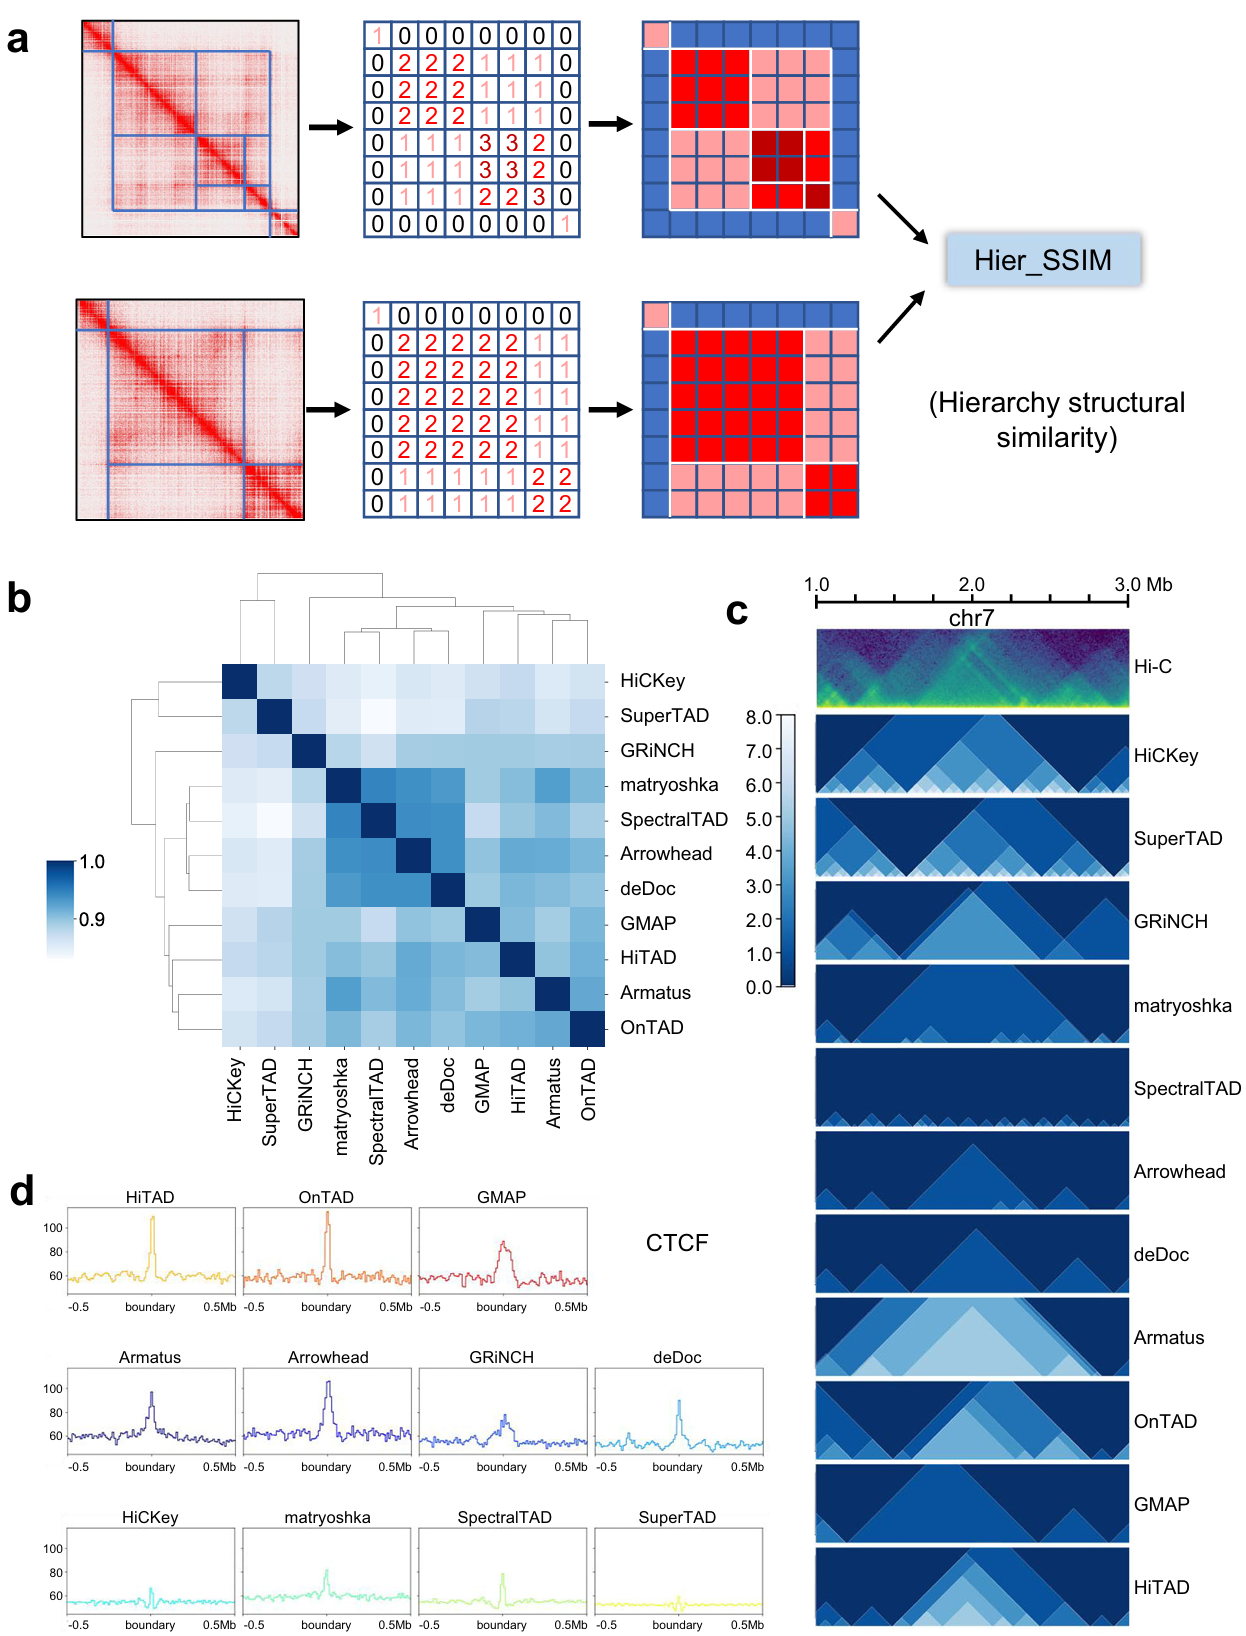
Fig. 1 | Hier_SSIM and evaluation across all callers (ICE-normalized Hi-C data at 10Kb resolution). a Diagram of Hier_SSIM process. b Clustering of TAD hierarchy callers. Source data are provided as a Source Data file. c Hierarchical structures of representative region by callers. The green image in the first row represents the HiC heatmap. The remaining blue images show the distribution of TAD levels from each method. d Peak signals for structural protein CTCF around the boundary.
Hierarchical TAD identification across data resolution, normalization, sequencing depth and biological replicates
Robustness is an important metric to evaluate performance of TAD hierarchy callers. We set a series of testing conditions by changing resolution (5 Kb, 10 Kb, 25 Kb, 50 Kb, and 100 Kb), matrices normalization (raw matrix and ICE-normalized matrix), and sequencing depth (20 %, 50 %, and 100 %) (Fig. 2). Here, two metrics are used to measure the similarity of TAD hierarchy: overlap ratio (OR, derived from SuperTAD to evaluate the similarity between two coding trees) and Hier_SSIM.
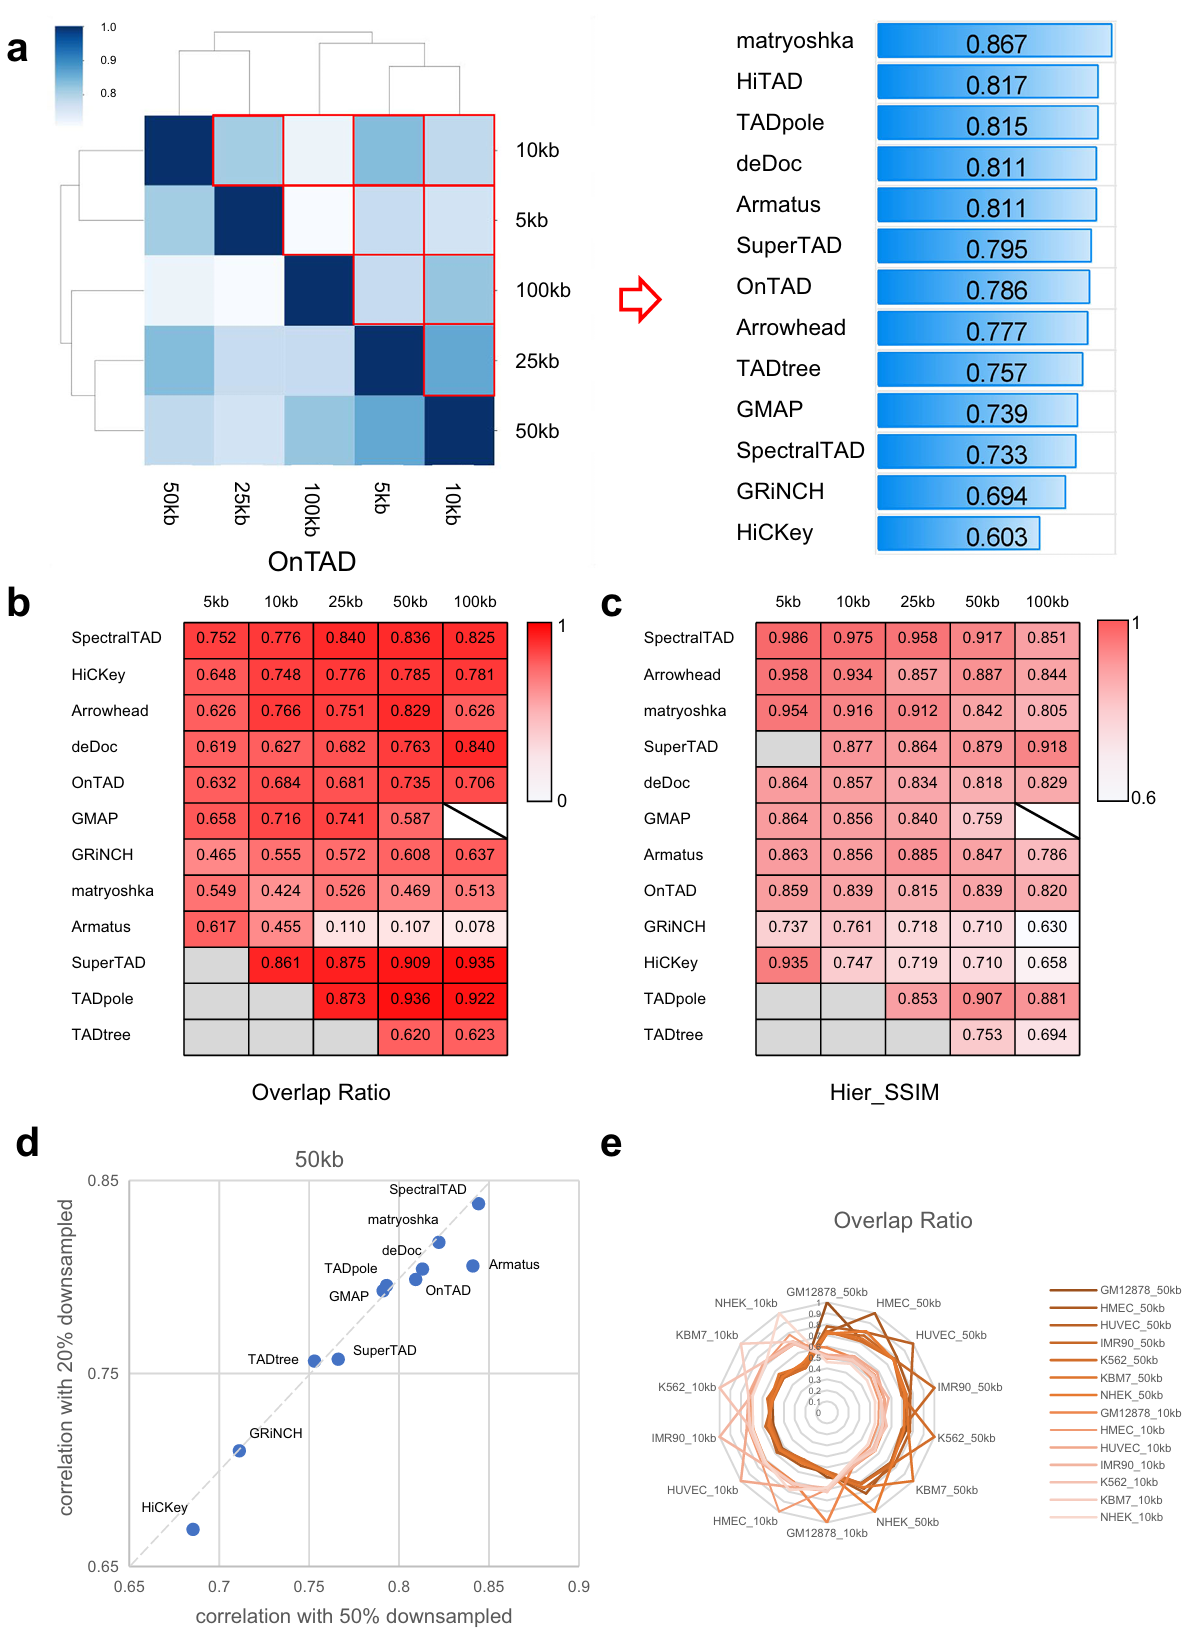
Fig. 2 | Evaluation of each caller across data resolution, normalization, and sequencing depth. a Hier_SSIM between TAD hierarchy obtained at different resolutions was assessed in a pairwise manner (e.g., 5 Kb vs. Kb, 5 Kb vs. Kb, etc.; results for the ICE data only are shown here). Hier_SSIM varies from 0 (no similarity, white) to 1 (full similarity, dark blue), showed in the Heatmap simulation diagram (the left panel). TAD hierarchy callers are ranked based on the average values of the Hier_SSIM across all resolutions (from highest to lowest, the right panel). b, c Concordance between TAD hierarchy obtained with each caller from raw and ICE-normalized matrices at different resolutions (5, 10, 25, 50, 100 Kb) using the Overlap ratio (b) and the Hier_SSIM (c). Overlap ratio and Hier_SSIM vary from 0 (no similarity, white) to 1 (full similarity, dark red). TAD hierarchy callers are ranked based on the average values of the overlap ratio and the Hier_SSIM (from highest to lowest). Samples are beyond the resolution range of callers (backslash) and results of certain resolutions can not computed (gray). d Ratio of Hier_SSIM of TAD hierarchy between 20% and 100% versus that between 50% and 100% from GM12878 cell line 50 Kb ICE data. The dashed line indicates the linear fit. e Overlap ratio between TAD hierarchy obtained with 7 cell lines on 50 Kb ICE data by OnTAD.
Comprehensive performance and guidance of hierarchical TAD callers
Based on the testing above, we summarize a comprehensive evaluation of all methods (Fig. 3), including biological correlation, robustness, and actual user experience (software installation, code instructions, input processing, parameters setting, downstream procession, time consumed, resolution self-identification and built-in visualization). We also provide details of running time and memory cost for each of the 13 methods.
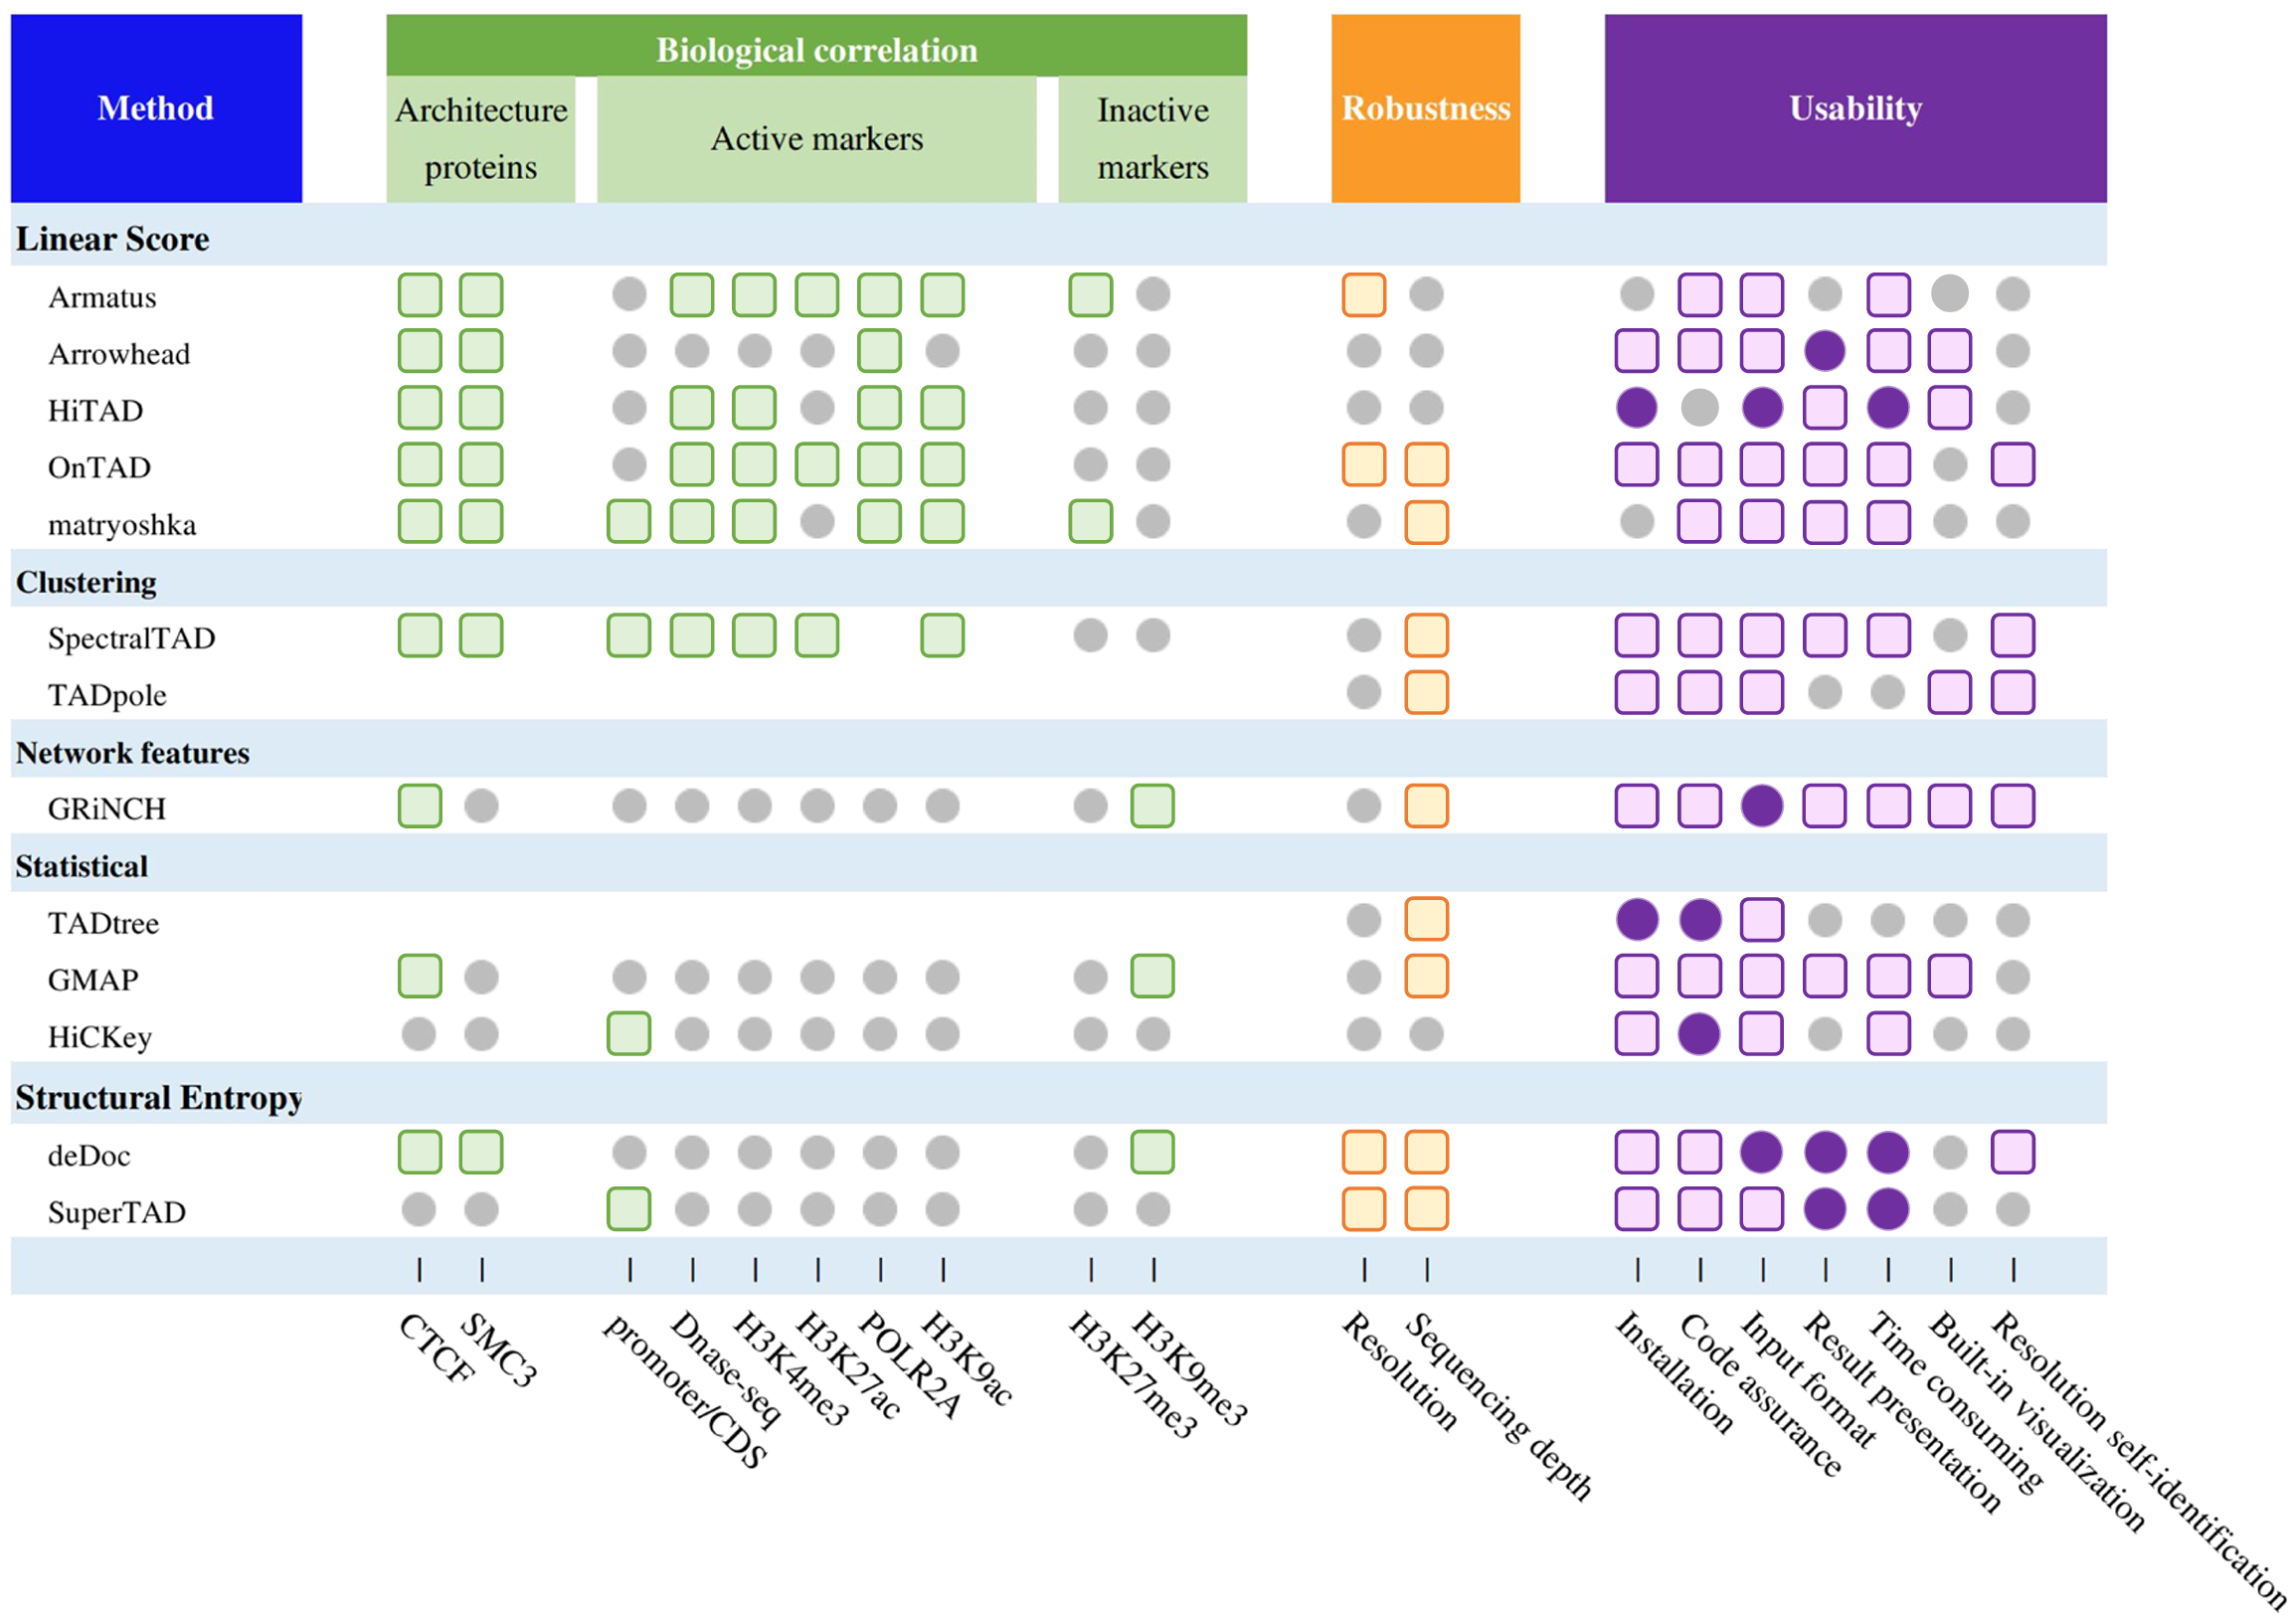
Fig. 3 | Comprehensive evaluation of TAD hierarchy callers. Summary performance of methods. The grey circles, colored circles, and colored squares represent normal, good, and excellent respectively.
The impact of cell heterogeneity on TAD hierarchy
As for bulk Hi-C data, TAD levels are consistent with the extent of gene expression, but the formation and existence of TAD hierarchy require further studies. Currently, the hypothesis for the formation of TAD hierarchy is divided into three categories: one is that the TAD hierarchy exists in a single-cell adjusting the gene expression (the pink box); the second regards it as just single superimpose of TAD layers derived from millions of cells (the blue box); the third supports concurrence of the previous two points (the orange box) (Fig. 4a).
To explore the impact of cell heterogeneity on TAD hierarchy, we perform a simulation of cellular heterogeneity by mixing GM12878 and K562 in 11 different ratios. If TAD hierarchy is the result of image superposition, the number of TAD boundaries with high levels will get obviously higher at a certain mixing ratio than that of a pure cell line. Interestingly, we find that the number doesn’t significantly excess that of K562 regardless of the mixing ratio (Fig. 4b, 4c). Next, to better simulate the impact of cell heterogeneity on TAD hierarchy, we collected single-cell Hi-C data of GM12878 and IMR90. Then, we generated pseudo-bulk Hi-C matrices based on different cell mixing ratios and calculated the distribution of TAD numbers at different levels. The results were consistent with bulk Hi-C mixing. We noticed the outputs never excess greatly to one pure cell line whatever the mixing ratio. In this way, the distribution of TAD hierarchy is seldom affected by cellular heterogeneity. Hence, we infer that TAD hierarchy would never just be a superimpose of millions of Hi-C heatmaps. This suggested that TAD hierarchy could be a real architecture in single cells.
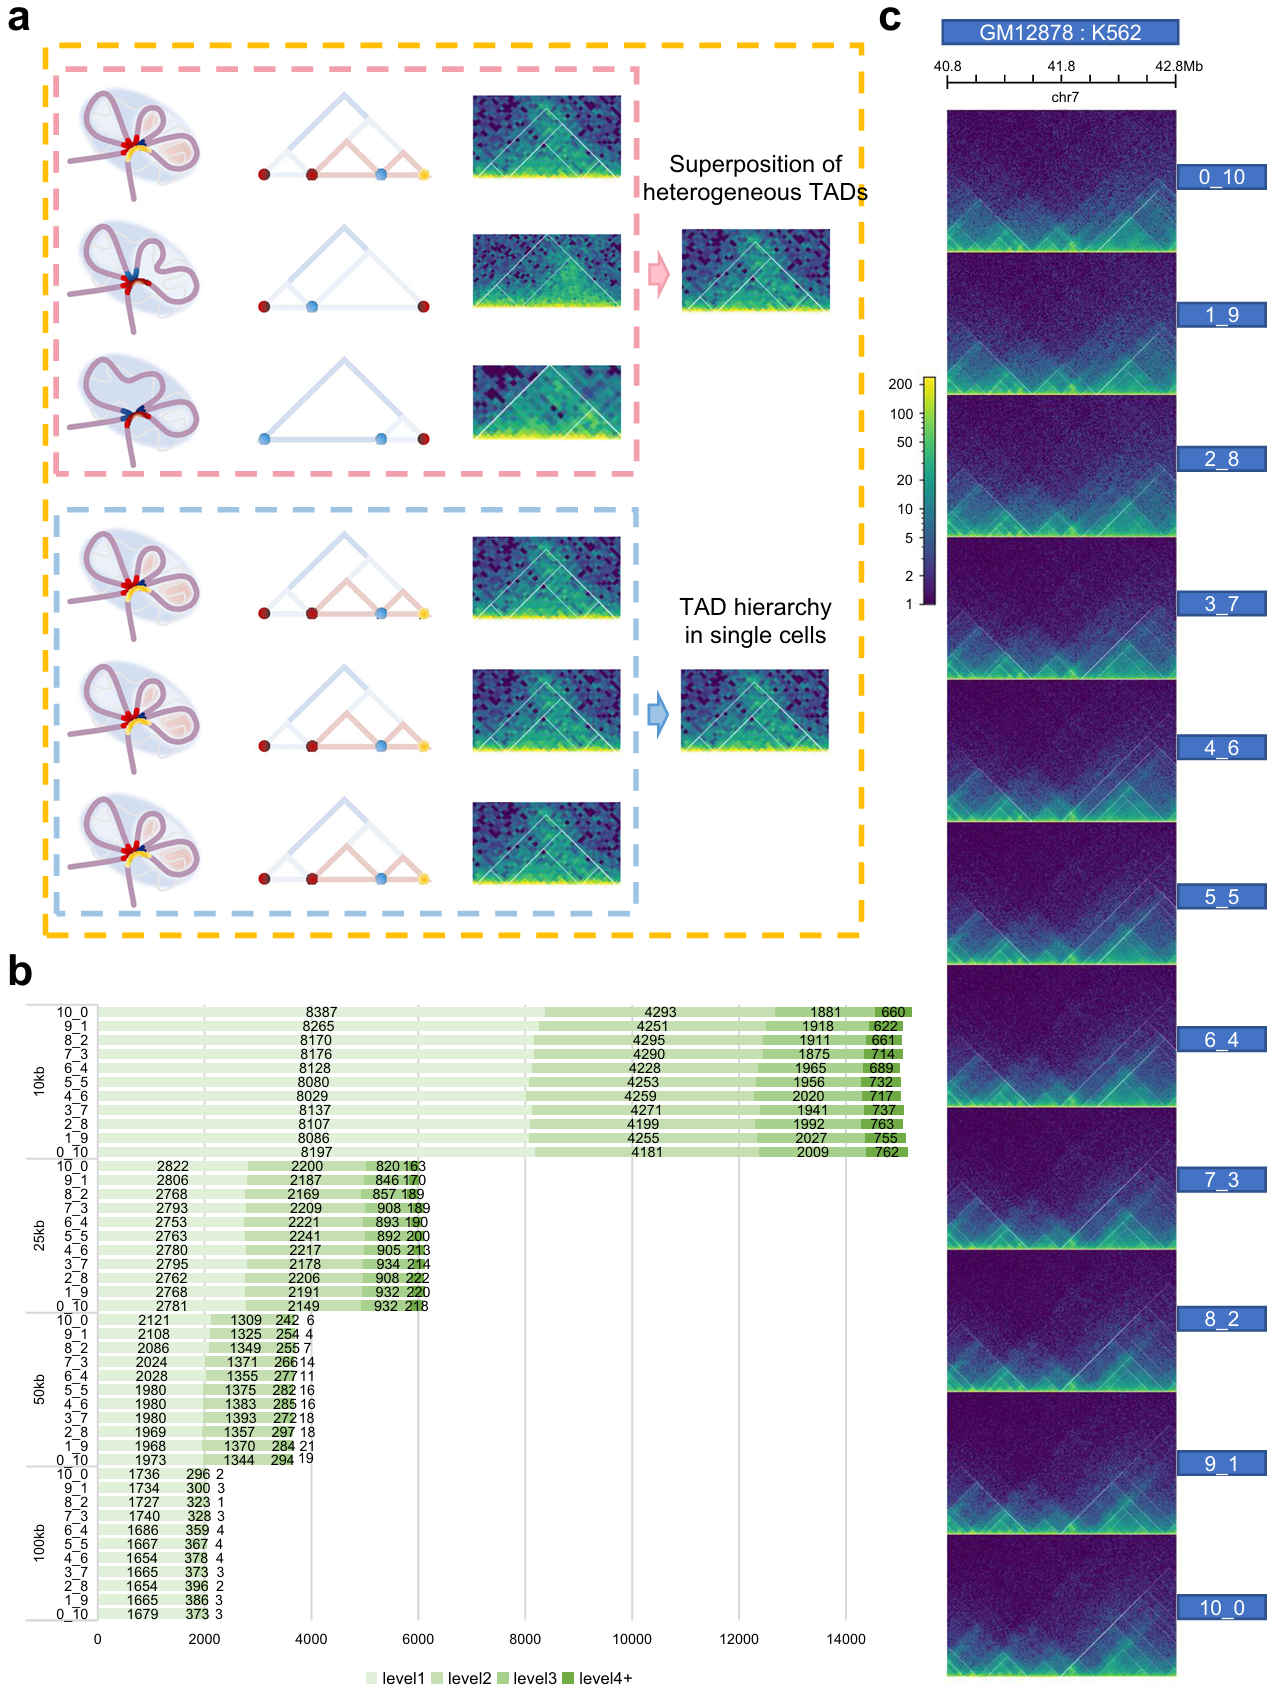
Fig. 4 | Exploration for existence of TAD hierarchy. a Schematic diagram of three main hypotheses for the formation of TAD hierarchy. One is only the superposition of heterogeneous TADs from bulk data (the upper panel, pink), the second shows that exact TAD hierarchy exists in individual cell (the lower panel, blue), and the third supports the coexistence of the two (orange). Twisted light purple chromatin filaments form the TAD, highlighted by light blue circular shading. Various colored points or short curve located at convergence points indicate TAD boundaries (the left panel, pink and blue box). Hierarchical TAD pattern diagrams (the middle panel, pink and blue box). Actual hic heatmap (the right panel, pink and blue box). b, Number of TAD boundaries at separate levels and various resolutions in mixed samples. c, TAD hierarchy in 40.8-42.8 Mb on chr7 of all mixed samples.
Hierarchical TADs act as air conditioner
We found that the enrichment of H3K4me1 and H3K4me3 (related to the active promoter) increased as the TAD and boundary levels went up (the yellow box), while that of H3K27me3 (associated with the repressed promoter) was the opposite (Fig. 5a). In addition, we predict the hierarchical TAD structure of GM12878 and K562 cell lines, and compare the gene expression along with epigenetic features (Fig. 5b).
Based on this, we propose an air conditioner model for the mechanism of TAD hierarchy (Fig. 5c): The air conditioners represent enhancers. Then various levels of TADs and TAD boundaries are represented by shadows and curves of different colors. As shown in Fig. 7c, the high-level TAD boundary mediates the formation of three TADs. As a result, high-level TAD boundary has high interaction frequency with other TAD boundaries. Since active modifications and gene transcription were enriched at the TAD boundary, we inferred that there were active enhancers and transcriptional activated genes on the TAD boundaries. A high-level TAD boundary can gather a number of enhancers by interacting with other TAD boundaries. Enhancers play the role in activating transcription by near space interaction, so there is an analogy between enhancer and air conditioner. The more concentrated the distribution of enhancers, the stronger the activation of genes. In different cells types, states or conditions, TAD hierarchy might change. The reduction of TAD boundary level leads to reduction of enhancer concentration. And the reduction of enhancer concentration limits the activation of gene expression.
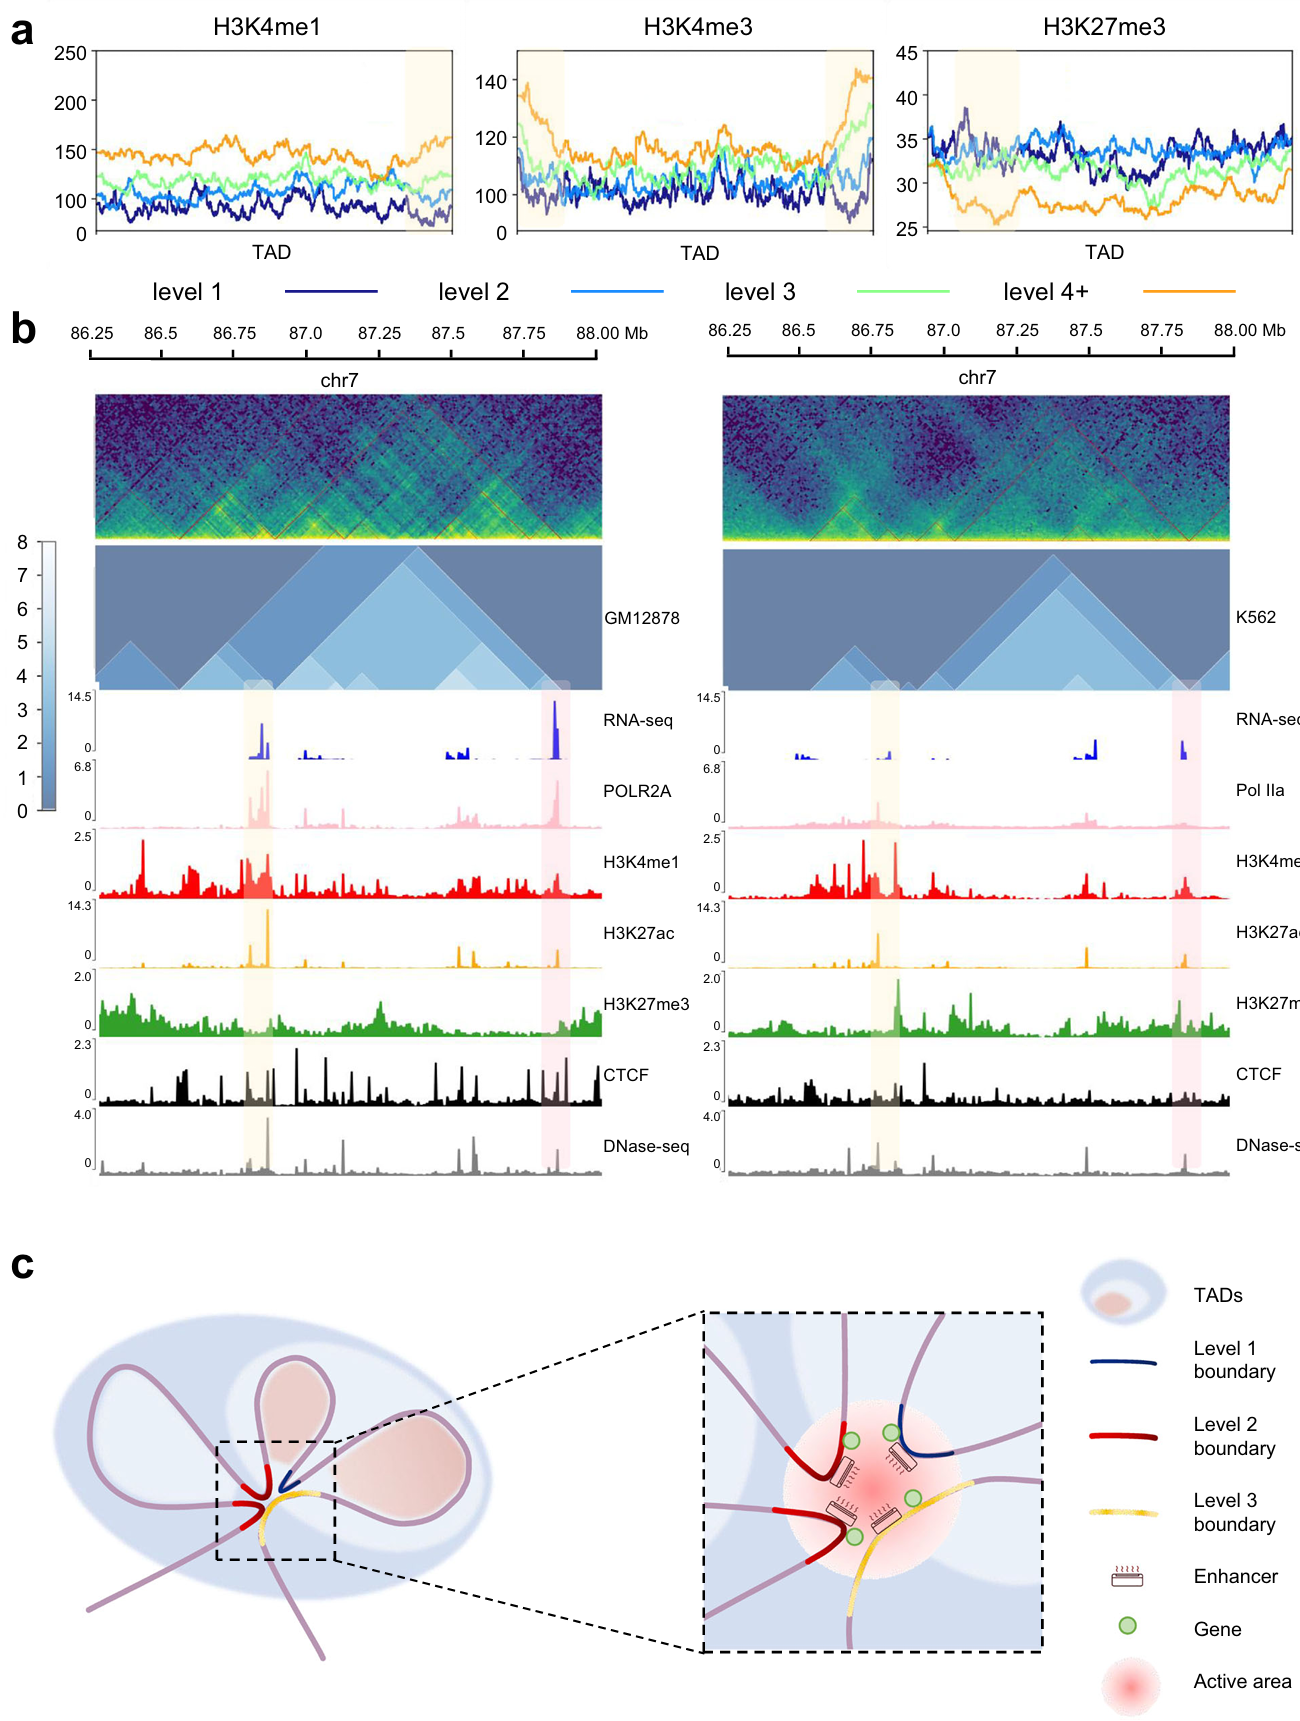
Fig. 5 | Further analysis of TAD hierarchy with OnTAD. a, Enrichment of histone modifications within TADs and around boundaries of all levels. Level 1 (dark blue), level 2 (blue), level 3 (green) and level 4 plus (orange) are overlaid. The yellow shaded area indicates where the TAD boundary is located. b, Representative example of TAD hierarchy and multi-omics landscape in GM12878 cell (left panel) and K562 cell (right panel). The upper green images show Hi-C heatmaps in both sides, and the middle blue images show the distribution of TAD hierarchy. Areas with yellow and pink shading are selected to depict inter-cellular variation. c, Schematic representation of the air conditioner model for TAD hierarchy. TAD boundaries are marked according to the level.
Follow the Topic
-
Nature Communications

An open access, multidisciplinary journal dedicated to publishing high-quality research in all areas of the biological, health, physical, chemical and Earth sciences.
Related Collections
With Collections, you can get published faster and increase your visibility.
Women's Health
Publishing Model: Hybrid
Deadline: Ongoing
Advances in neurodegenerative diseases
Publishing Model: Hybrid
Deadline: Mar 24, 2026


Please sign in or register for FREE
If you are a registered user on Research Communities by Springer Nature, please sign in