Bayesian weighting of climate models based on climate sensitivity
Published in Earth & Environment

As the Earth warms, there is a higher need for detailed projections from Earth System Models (ESMs) to provide information on the impacts of climate change. The Coupled Model Intercomparison Project, phase 6 (CMIP6) provides climate model outputs that are used to inform national and international assessments regarding climate change and its societal impact. While the information provided by CMIP6 models is critical for understanding the consequences of anthropogenic greenhouse gas emissions and projecting future climates, many of the models are considered ‘too hot’, meaning they simulate a warming response to the change in radiative forcing that is too strong given other lines of evidence and our physical understanding of the climate system. These lines of evidence include feedback process understanding, climate change and variability seen within the instrumental record, paleoclimate evidence, and so-called ‘emergent constraints’, and importantly do not include estimates of climate sensitivity from the climate models. This concept of the sensitivity of the climate system is known as Equilibrium Climate Sensitivity (ECS) and is an estimate of the eventual steady-state global warming given a doubling of atmospheric CO2 concentrations. Based on multiple lines of evidence, the best assessed estimate of Earth’s ECS is 3°C with a likely range of 2.5°C to 4°C (high confidence).
Various approaches have been proposed to construct a climate model ensemble of transient projections that are more consistent with assessed estimates of Earth’s climate sensitivity. These range from very rigorous and extensive approaches to simple model culling exercises. In our work, we provide an alternative approach to construct a weighted CMIP6 ensemble projection that is consistent with the assessed value of Earth’s ECS. We use Bayesian Model Averaging (BMA) as a framework to constrain the CMIP6 ensemble projection based on the assessed range of ECS, allowing information from all considered models to be included in the final projection. In short, BMA is a method that tries thousands of combinations by sampling different model weights and compares the created model averages with a desired target field, in this case a realistic ECS value. After sampling thousands of combinations, the posterior combinations (or the most optimal sets of model weights) are extracted and used for post-processing. This ultimately avoids having to reject any models that are considered ‘too hot’, since all models may appear in any given set of weights.
To resolve the ‘hot model’ problem, we utilize a set of 16 models from the CMIP6 archive and apply BMA to find an appropriate linear combination of models that produces a good fit to the likely ECS distribution. By searching for various combinations of these CMIP6 models that best fit the ECS distribution, we recast the information signal from each model to varying degrees. In essence, out of 15,000 samples of model combinations, the distributions of the model weights from the posterior samples allow the best fit to the target ECS value and the expected ECS distribution. This enables the creation of a weighted ensemble that is consistent with the assessed probabilistic uncertainty around the true (and likely unknowable) ECS value.
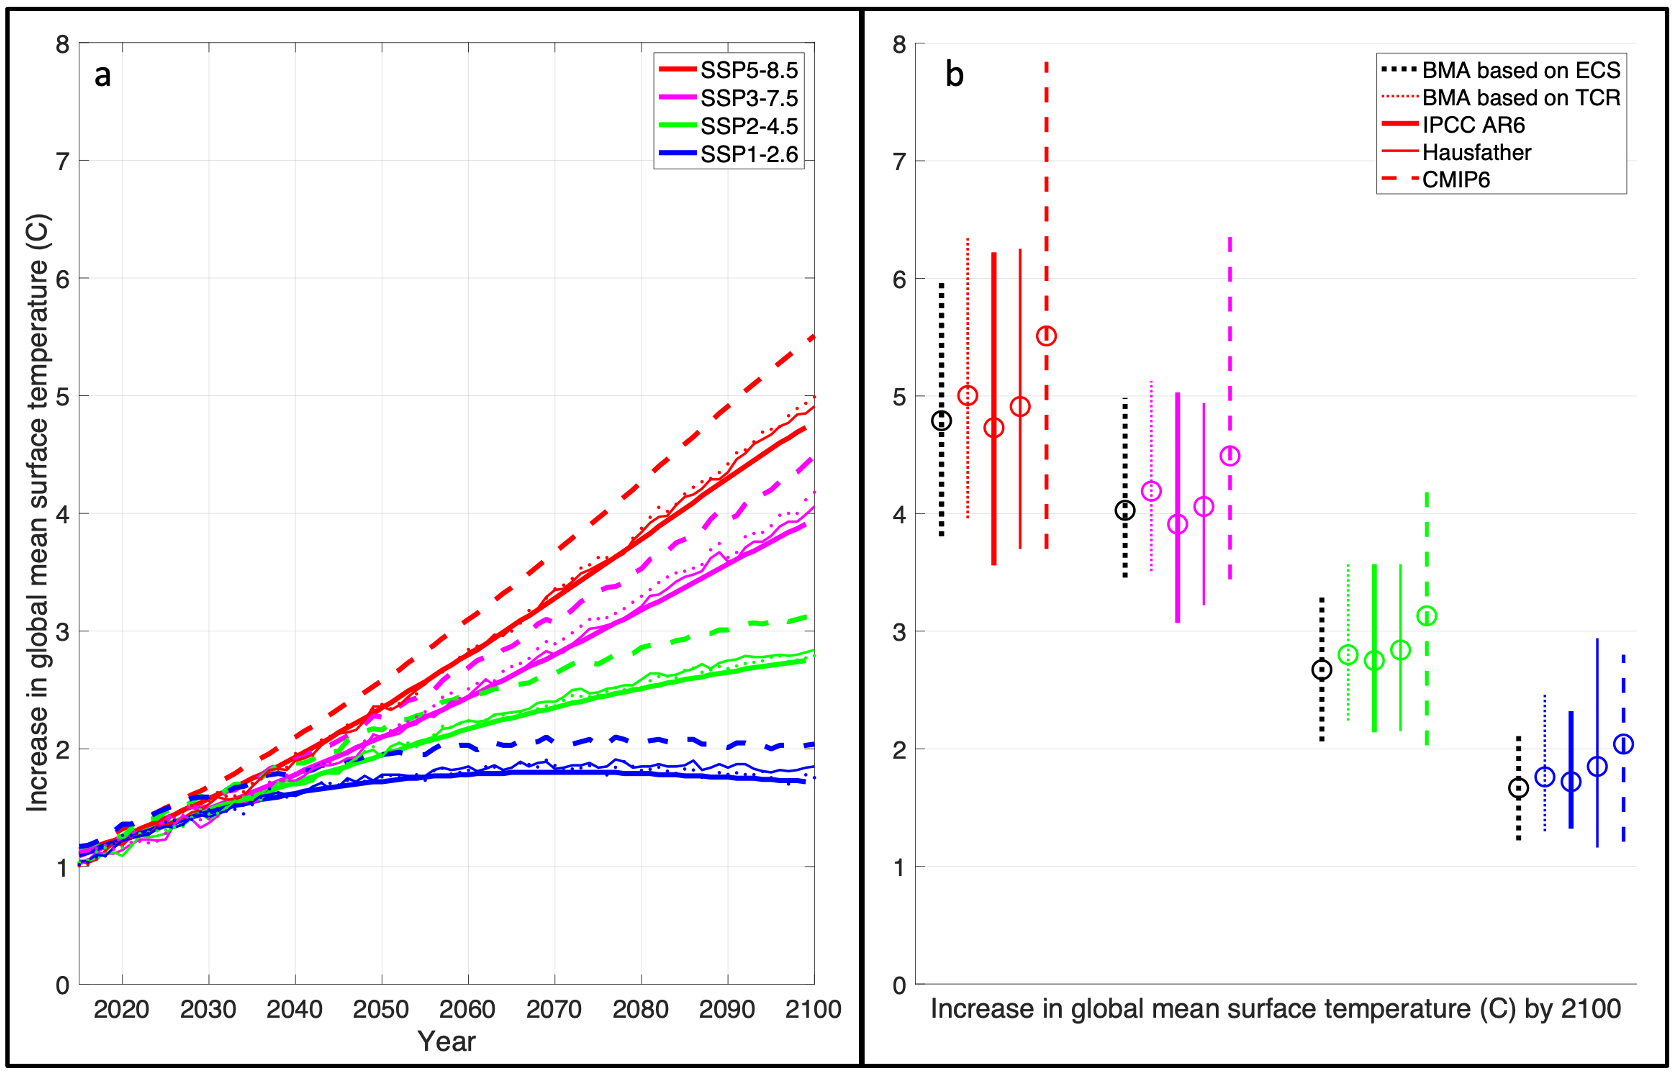
When the set of posterior weights are applied, the result is a weighted ensemble mean for each Shared Socioeconomic Pathway (SSP1-2.6, SSP2-4.5, SSP3-7.0, and SSP5-8.5). The results showing the future global mean surface temperature projections are shown in Figure 1. Notably, the 95% uncertainty range of the end-of-century temperature increase signal, shown in Figure 1B, is consistent with the other methods for all four considered SSPs. The different emission scenarios (SSP1-2.6, SSP2-4.5, SSP3-7.0, and SSP5-8.5) are clear in what they project for the future. In short, expected temperature changes increase as the projected emissions increase. The strategies taken here produce new future climate estimates that are less exaggerated than those produced using the raw CMIP6 multi-model mean, as shown in Figure 1. The updated multi-model ensemble projects end-of-century global mean surface temperature increases of 2 °C for a low emissions scenario (SSP1-2.6) and 5 °C for a high emissions scenario (SSP5-8.5).
Furthermore, the original spread of the CMIP6 signal for end-of-century change in global mean surface temperature is much broader (almost twice the spread) compared to the estimate when ‘hot models’ are downweighed or eliminated from the ensemble (i.e., Figure 1B). The distribution from the original CMIP6 ensemble is usually skewed in a way that makes the mean signal much higher than for the methods that ameliorate the ‘hot model’ problem (e.g., ~5.5°C for SSP5-8.5 compared to below 5°C, Figure 1B). Therefore, when the 'hot model' problem is addressed (for example by down-weighting models that are ‘too hot’) future global mean temperatures are lower and increases in temperature are less exaggerated. We argue that the special benefit of BMA is that it provides posterior information that provides probability densities on the weights of each individual Earth System Model (ESM) in an optimal manner, which allows all the models in the ensemble to provide accurate information to the model average.
Although the weights drop for some models, there are no models that have weights that are too low or too high. In other words, all models generally have weights in the range of ~0.03-0.08. For comparison with the equal weights approach (i.e., a simple model mean), all models would have a weight of 1/16 or 0.0625 if equal weights were applied. Again, this is the benefit of using BMA over the other mentioned methods since all models can still provide significant information to the model average when using the BMA method. Moving forward, in climate assessment reports as well as for other scientific analysis, we recommend the use of model weighting (e.g., BMA-based methods) on metrics such as ECS or TCR. This will facilitate a more rigorous calibration of information that is used from models that are ‘too hot’ without having to outright reject them from the ensemble.

Fig. 1: Future projections of global mean surface temperature.
a Increase in global mean surface temperature (°C) for the different SSP scenarios considered and the different model averaging methods used. Dashed lines are the raw CMIP6 mean, light solid lines are based on a model culling approach (Hausfather method), dark solid lines are the AR6 assessed warming levels (based on emulators), and colored dotted lines are the results produced in this paper from the BMA method. b Increase in global mean surface temperature by the year 2100 and the uncertainty ranges of this estimate for each SSP scenario and each model averaging method considered here. The results from the BMA-ECS analysis (black dotted line) are included in this panel for comparison with the other results. Results shown here have no temporal filtering. The BMA uncertainty bar plotted here is the top 95% of the full posterior distribution of model weights. The updated multi-model ensemble projects end-of-century global mean surface temperature increases of 2oC for a low emissions scenario (SSP1-2.6) and 5oC for a high emissions scenario (SSP5-8.5).
Follow the Topic
-
Communications Earth & Environment

An open access journal from Nature Portfolio that publishes high-quality research, reviews and commentary in the Earth, environmental and planetary sciences.
Related Collections
With Collections, you can get published faster and increase your visibility.
Archaeology & Environment
Publishing Model: Hybrid
Deadline: Mar 31, 2026
Drought
Publishing Model: Hybrid
Deadline: Mar 31, 2026


Please sign in or register for FREE
If you are a registered user on Research Communities by Springer Nature, please sign in