Benchmarking interannual air-sea carbon flux variability through the seasonal cycle
Published in Earth & Environment
Since the Industrial Age (circa 1850), the oceans have absorbed about a quarter of all human-made carbon emissions1. Carbon exchange (or flux) between the atmosphere and the ocean is influenced by various dynamic factors, including the relative concentrations of carbon dioxide in the atmosphere and the ocean (ΔpCO2, the partial pressure of CO2 gas) and the physical state of the sea surface (like temperature, salinity, and sea state).
The carbon flux isdifficult to observe in the field, so it is mostly estimated using upscaled in situ observations and climate models, which can be used to investigate the processes that influence the flux. Most global synthesis reports, such as the Global Carbon Budget, estimate the evolution of the carbon flux (i.e., changes over the past decades) using annual mean fluxes from these tools. However, the seasonal cycle, the largest signal driving the interannual variability, is neglected when building annual averages, and thus seasonal biases may be overlooked.
In this study (https://rdcu.be/deaG6), we compare seasonal carbon flux estimates from two tools. The first is a large ensemble (MPI-GE2) of a single state-of-the-art comprehensive climate model. The second is an ensemble of observation-based products (from the Surface Ocean pCO2 Mapping Intercomparison, SOCOM4 that have later been harmonized within the SeaFlux ensemble3). To sample the range of observational coverage and process understanding, we examine two contrasting ocean regions, the historically well-observed North Atlantic basin, and the data-sparse Southern Ocean.
We aim to understand if differences in the seasonal flux between the ensembles can help explain the differences in the annual flux and its year-to-year variations. For instance, if there is an amplification of the seasonal cycle, resulting in increasingly variable fluxes in winter, does that influence the variability in the annual flux, and can that information be leveraged to determine contemporary fluxes and the evolution of the ocean carbon sink?
How do carbon fluxes compare between ensembles?
The magnitude and large-scale spatial patterns of the annual air-sea carbon fluxes in the North Atlantic and the Southern Ocean are similar between the ensembles. However, when contrasting seasonal to annual fluxes, there are large differences between the ensembles, 1-2 times greater in the North Atlantic basin and 3-4 times greater in the Southern Ocean. These large seasonal differences are obscured in the annual mean flux since they fortuitously compensate. However, as a result, if only annual mean fluxes are considered when comparing models and observation-based products, a significant aspect of the model-observation comparison is missing, which is only evident at a seasonal timescale.
Linking seasonal and interannual carbon flux variability
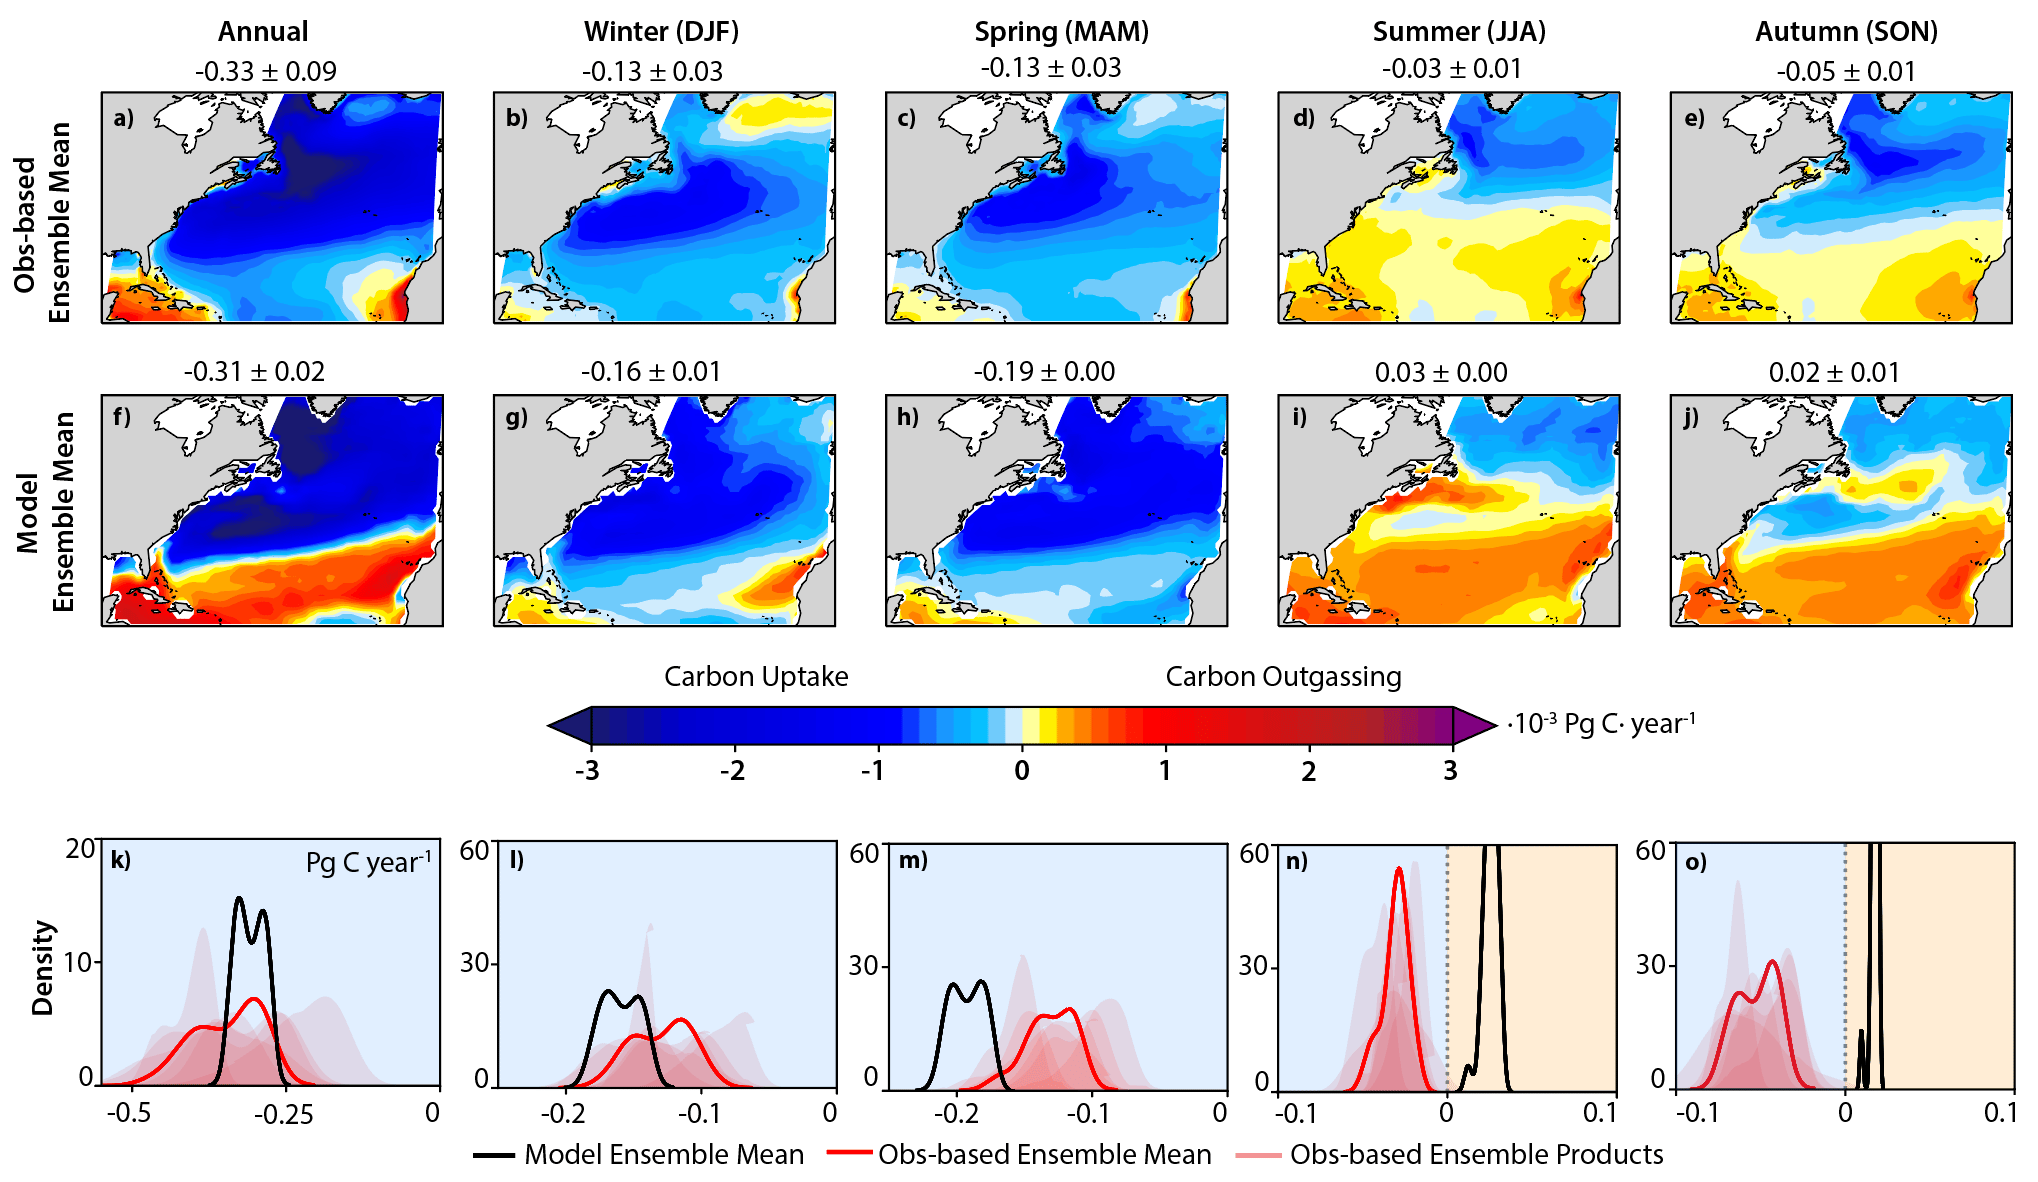
The North Atlantic basin is historically one of the best-sampled and studied regions in the ocean. Therefore, seasonal fluxes are expected to be better represented there than in the Southern Ocean. Despite a general agreement between the ensembles on seasonal timescales (Fig 1), discrepancies stem from the model’s representation of seasonal biology (such as production and bloom dynamics in the spring) and physical processes (such as deep convective mixing in the winter). Even the observation-based products vary significantly from one another on annual and seasonal timescales due to different data extrapolation methods, even though they all use pCO2 observations from the same dataset (SOCAT5). Nevertheless, the model and observation-based ensembles agree that winter and spring carbon fluxes dominate the interannual variability of carbon fluxes in the North Atlantic.
. Annual and seasonal (Pg C/year) carbon fluxes averaged over 1990-2020 in the observation-based (a-e) and model (f-j) ensemble mean with corresponding kernel density estimation plots in the observation-based (red) and model (black) ensembles (k-o). The red shadings represent individual products part of the observation-based ensemble. Background colours indicate uptake by the ocean (blue) and outgassing into the atmosphere (orange).")
Fig 1: Air-sea carbon fluxes in the North Atlantic basin (10-90 °W, 15-60 °N). Annual and seasonal (Pg C·year-1) carbon fluxes averaged over 1990-2020 in the observation-based (a-e) and model (f-j) ensemble mean with corresponding kernel density estimation plots in the observation-based (red) and model (black) ensembles (k-o). The red shadings represent individual products part of the observation-based ensemble. Background colours indicate uptake by the ocean (blue) and outgassing into the atmosphere (orange).
The Southern Ocean, responsible for over 40% of the annual carbon uptake, is integral to air-sea carbon exchange but remains sparsely sampled outside of austral summer. Close integrated annual fluxes between the ensembles blur substantial disagreement on the magnitude and spatial structure of seasonal fluxes between the model and observation-based ensembles (Fig 2), with a large part of the discrepancy arising from the different pCO2 seasonalities.
But, there are deeper differences. For instance, the model (MPI-ESM) is considered anomalous in the Southern Ocean due to a deep entrainment bias with strongly amplified seasonal signals. In contrast, the observation-based ensemble is a consistent and moderate CO2 sink in all seasons, with a large overlap between observation-based products that show nearly constant interannual variability across seasons. The seemingly strong agreement among the observation-based products likely results from limited measurements reinforcing weak signals over periods without observations instead of a robust climate signal.
Both ensembles agree in the data-scarce seasons of austral autumn and winter that would be considered the least robust in the observation-based products. Current limitations in validating either ensemble make it challenging to deem this a trustworthy signal. Therefore, while seasonal variability can be useful in diagnosing interannual variability in the North Atlantic basin, it is currently of limited use in the Southern Ocean.
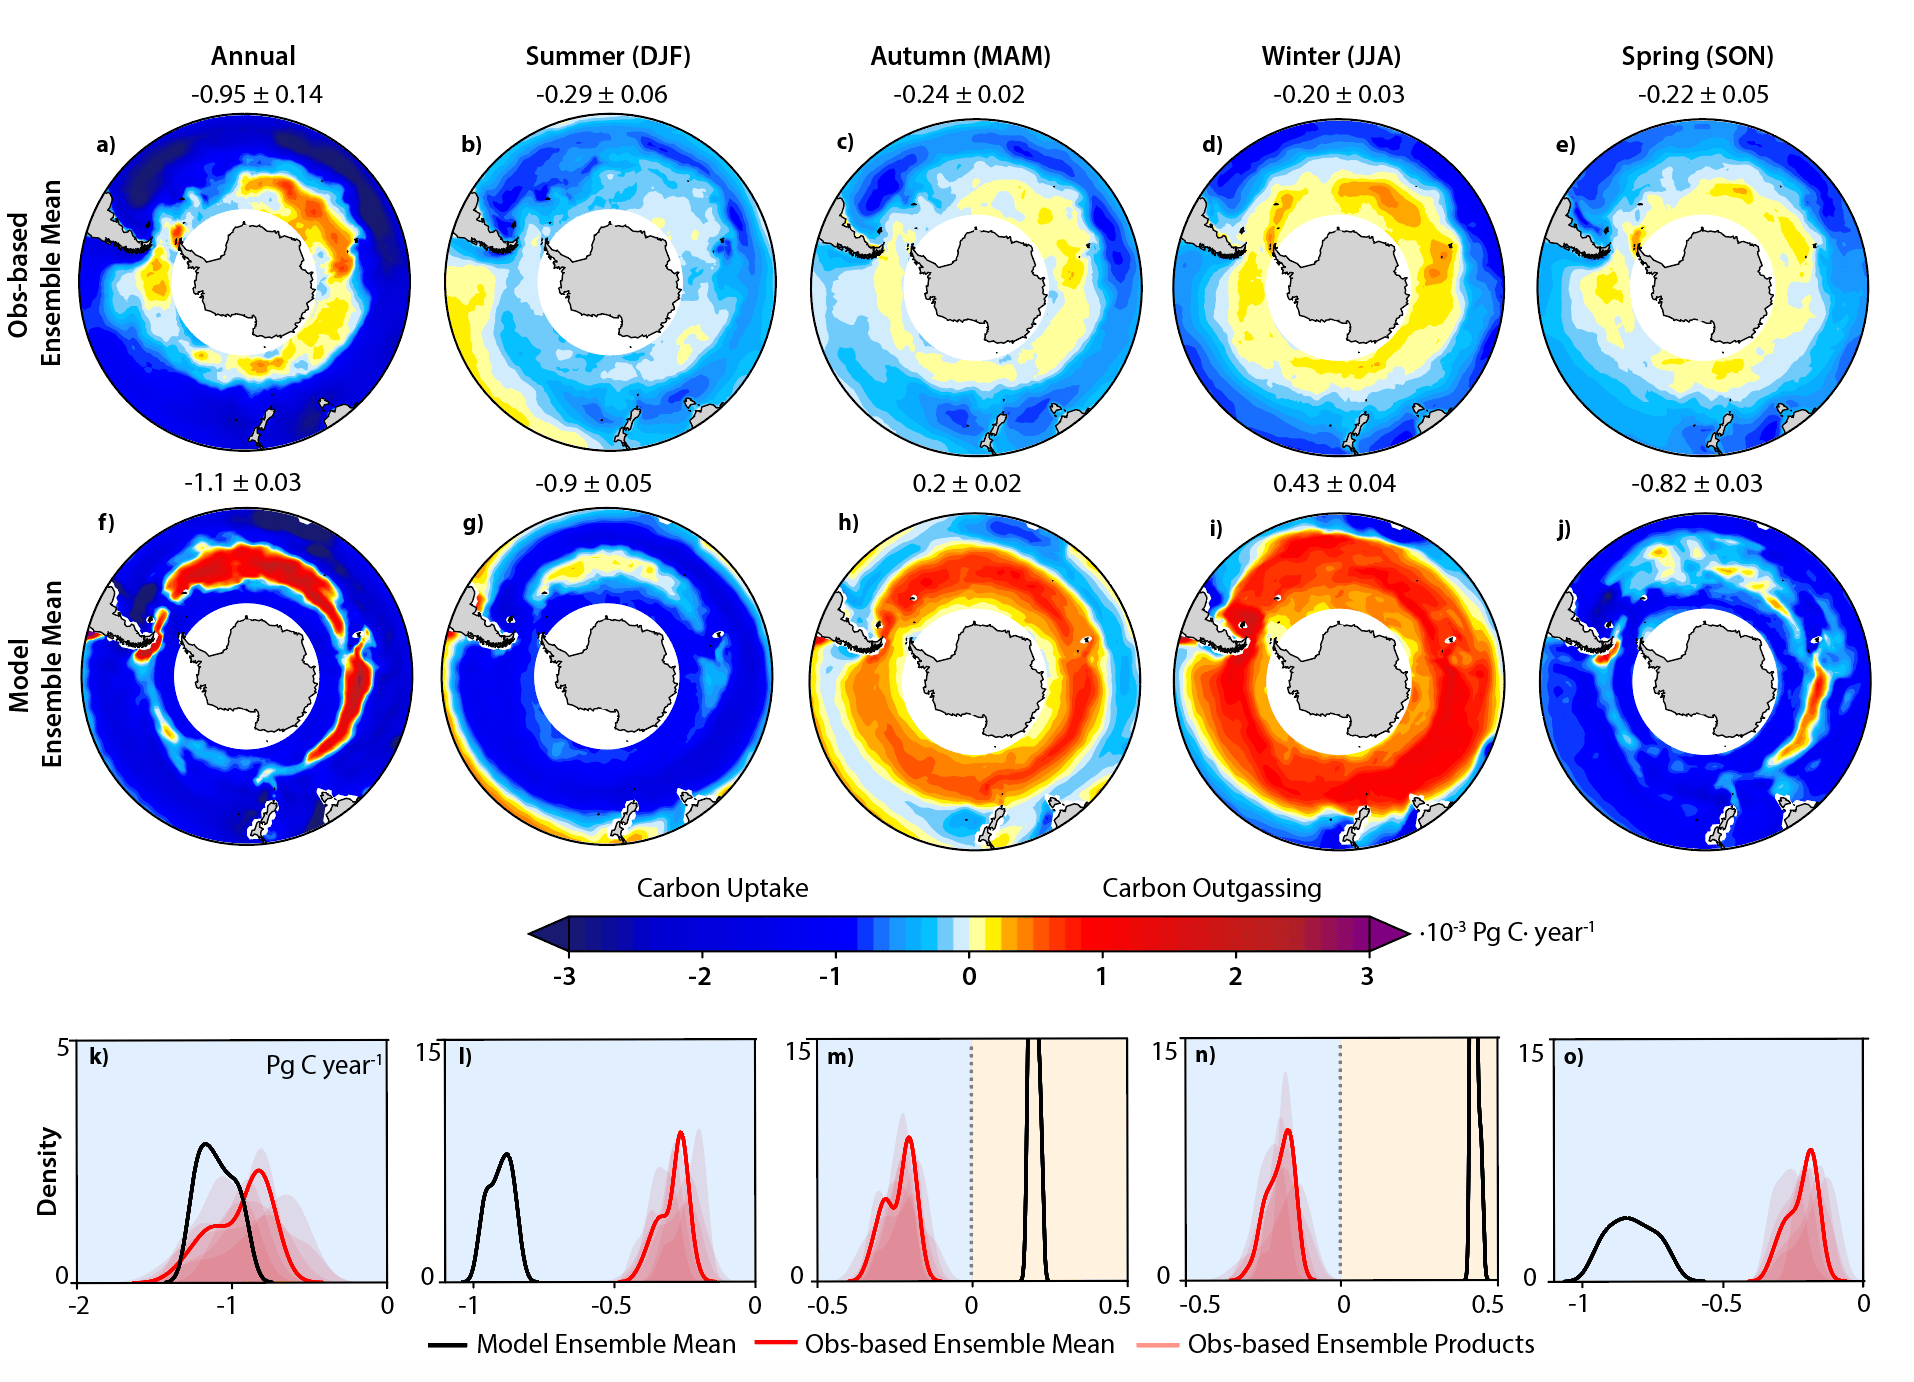
Figure 2: Air-sea carbon fluxes in the Southern Ocean (0-360 °, 35-65 °S). Annual and seasonal (Pg C·year-1) carbon fluxes averaged over 1990-2020 in the observation-based (a-e) and model (f-j) ensemble mean with corresponding kernel density estimation plots in the observation-based (red) and model (black) ensembles (k-o). The red shadings represent individual products in the observation-based ensemble. Background colours indicate uptake by the ocean (blue) and outgassing into the atmosphere (orange).
Implications
Long-term observation strategies can help improve process understanding and close measurement gaps in regions like the Southern Ocean, where models and observations disagree on seasonal carbon fluxes. However, maintaining existing networks can still provide insight into improving relatively well-understood regions like the North Atlantic basin, where fluxes remain prone to uncertainty. However, data scarcity and its limiting distribution are shortcomings that will not be resolved globally in the short term. In the interim, models offer the ability to study regions where observations are inherently limiting. Therefore, recognizing the limitations and advantages of both models and observation-based products is of fundamental importance while interpreting the evolution of the ocean carbon sink.
References
- Friedlingstein, P. et al. Global Carbon Budget 2021. Earth Syst. Sci. Data 14, 1917–2005 (2022).
- Maher, N. et al. The Max Planck Institute Grand Ensemble: Enabling the Exploration of Climate System Variability. J. Adv. Model. Earth Syst. 11, 2050–2069 (2019).
- Fay, A. R., et al. Harmonization of global surface ocean pCO2 mapped products and their flux calculations; an improved estimate of the ocean carbon sink, Earth Syst. Sci. Data, 13, 4693–4710 (2021).
- Rödenbeck, C. et al. Data-based estimates of the ocean carbon sink variability first results of the Surface Ocean pCO2 Mapping intercomparison (SOCOM). Biogeosciences 12, 7251–7278 (2015).
- Bakker, D. C. E. et al. A multi-decade record of high-quality fCO2 data in version 3 of the Surface Ocean CO2 Atlas (SOCAT). Earth Syst. Sci. Data 8, 383–413 (2016).
Follow the Topic
-
npj Climate and Atmospheric Science
This journal is dedicated to publishing research on topics such as climate dynamics and variability, weather and climate prediction, climate change, weather extremes, air pollution, atmospheric chemistry, the hydrological cycle and atmosphere-ocean and -land interactions.

Related Collections
With Collections, you can get published faster and increase your visibility.
Atmosphere-Biosphere Interactions
Publishing Model: Open Access
Deadline: Oct 31, 2026
AI-Driven Innovation in Atmospheric Chemistry and Composition–Climate Interactions
Publishing Model: Open Access
Deadline: Oct 31, 2026


Please sign in or register for FREE
If you are a registered user on Research Communities by Springer Nature, please sign in