Climate change vulnerability of forest trees in the age of genomics

Published in Ecology & Evolution
Climate change vulnerability of forest trees in the age of genomics
Like

Share this post

Choose a social network to share with, or copy the URL to share elsewhere

This is a representation of how your post may appear on social media. The actual post will vary between social networks

Accelerated climate change is one of the greatest current threats to biodiversity but an understanding of how taxa will respond to future climate change is mostly lacking. Efforts to predict future species response to climate change mostly assume that the species is static and hence ignore that species comprise genetically diverse individuals. However, intraspecific adaptive genetic variation could provide the raw material necessary to tolerate or adapt to environmental change. Therefore, it is critical to incorporate such information in the assessment of species vulnerability and conservation management under future climate change.
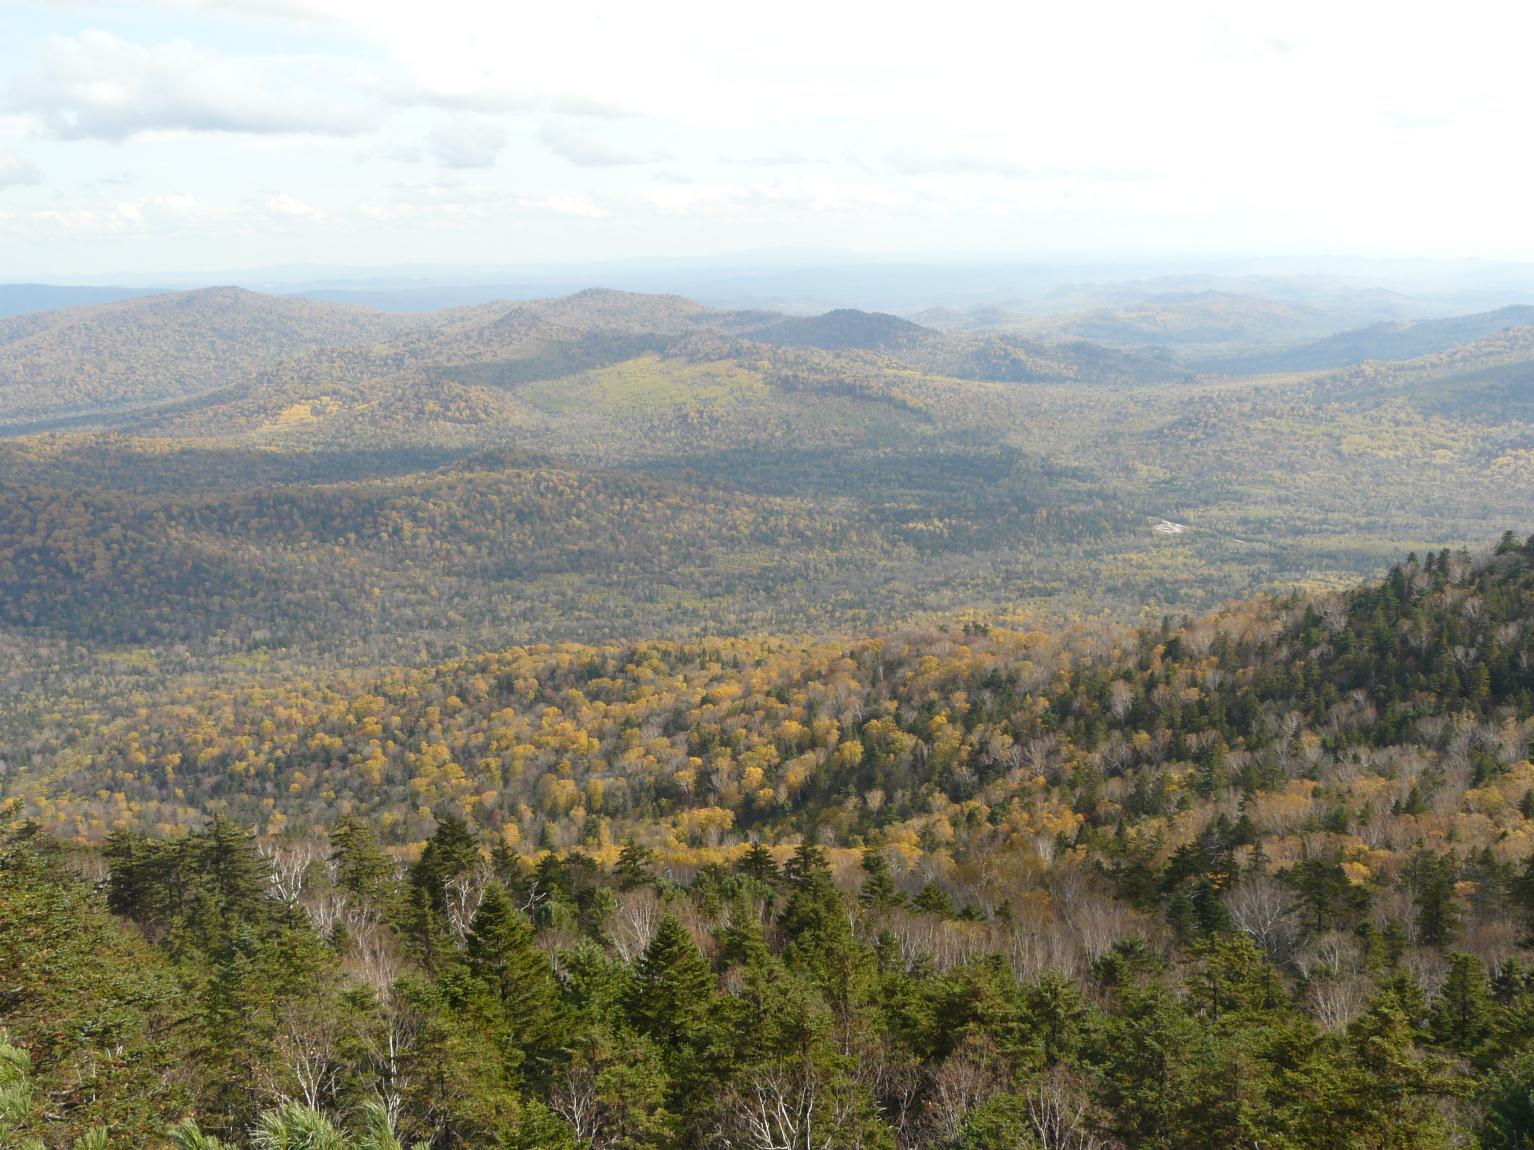
 

Forest trees play a leading role in the global carbon cycle and, along with being the most efficient carbon sink, forest trees will play an increasingly important role in combating climate change and global warming. However, forest trees are characterized by long lifespans, large body sizes and often have long generation times that make them particularly vulnerable to maladaptation under altered climatic scenarios. Some threats due to climate change may even happen within the lifetime of single individuals. Temperate forests in East Asia have high biodiversity, varied ecosystems, and house substantial endemism. However, compared to other regions, temperate forests in this area still lack a comprehensive evaluations of potential climate change impacts. Our study focused on one of the dominant tree species in temperate deciduous forest in East Asia, Populus koreana, to decipher its past demographic history, to reveal the genetic basis of current climate adaptation, and lastly to predict the future vulnerability under climate change.

How to dissect and identify the genetic variation underlying plants’ adaptation to their environments?

 To understand the genetic basis of environmental adaptation and to identify the variation underlying the adaptation of P. koreana, we first generate a de novo high-quality chromosome-scale reference genome for this species. We then utilize large-scale resequencing datasets from 24 natural populations to explore not only SNPs, but also to characterize the short insertion/deletions (Indels) and larger structural variations (SVs). The landscape genomic approaches facilitate a thorough identification of genetic variants that underpin climatic adaptation, and some of which are validated by our experimental functional tests. Overall, our results revealed that the local adaptation of P. koreana to the current variable environments evolved by small polygenic allele frequency shifts as found for many other species.
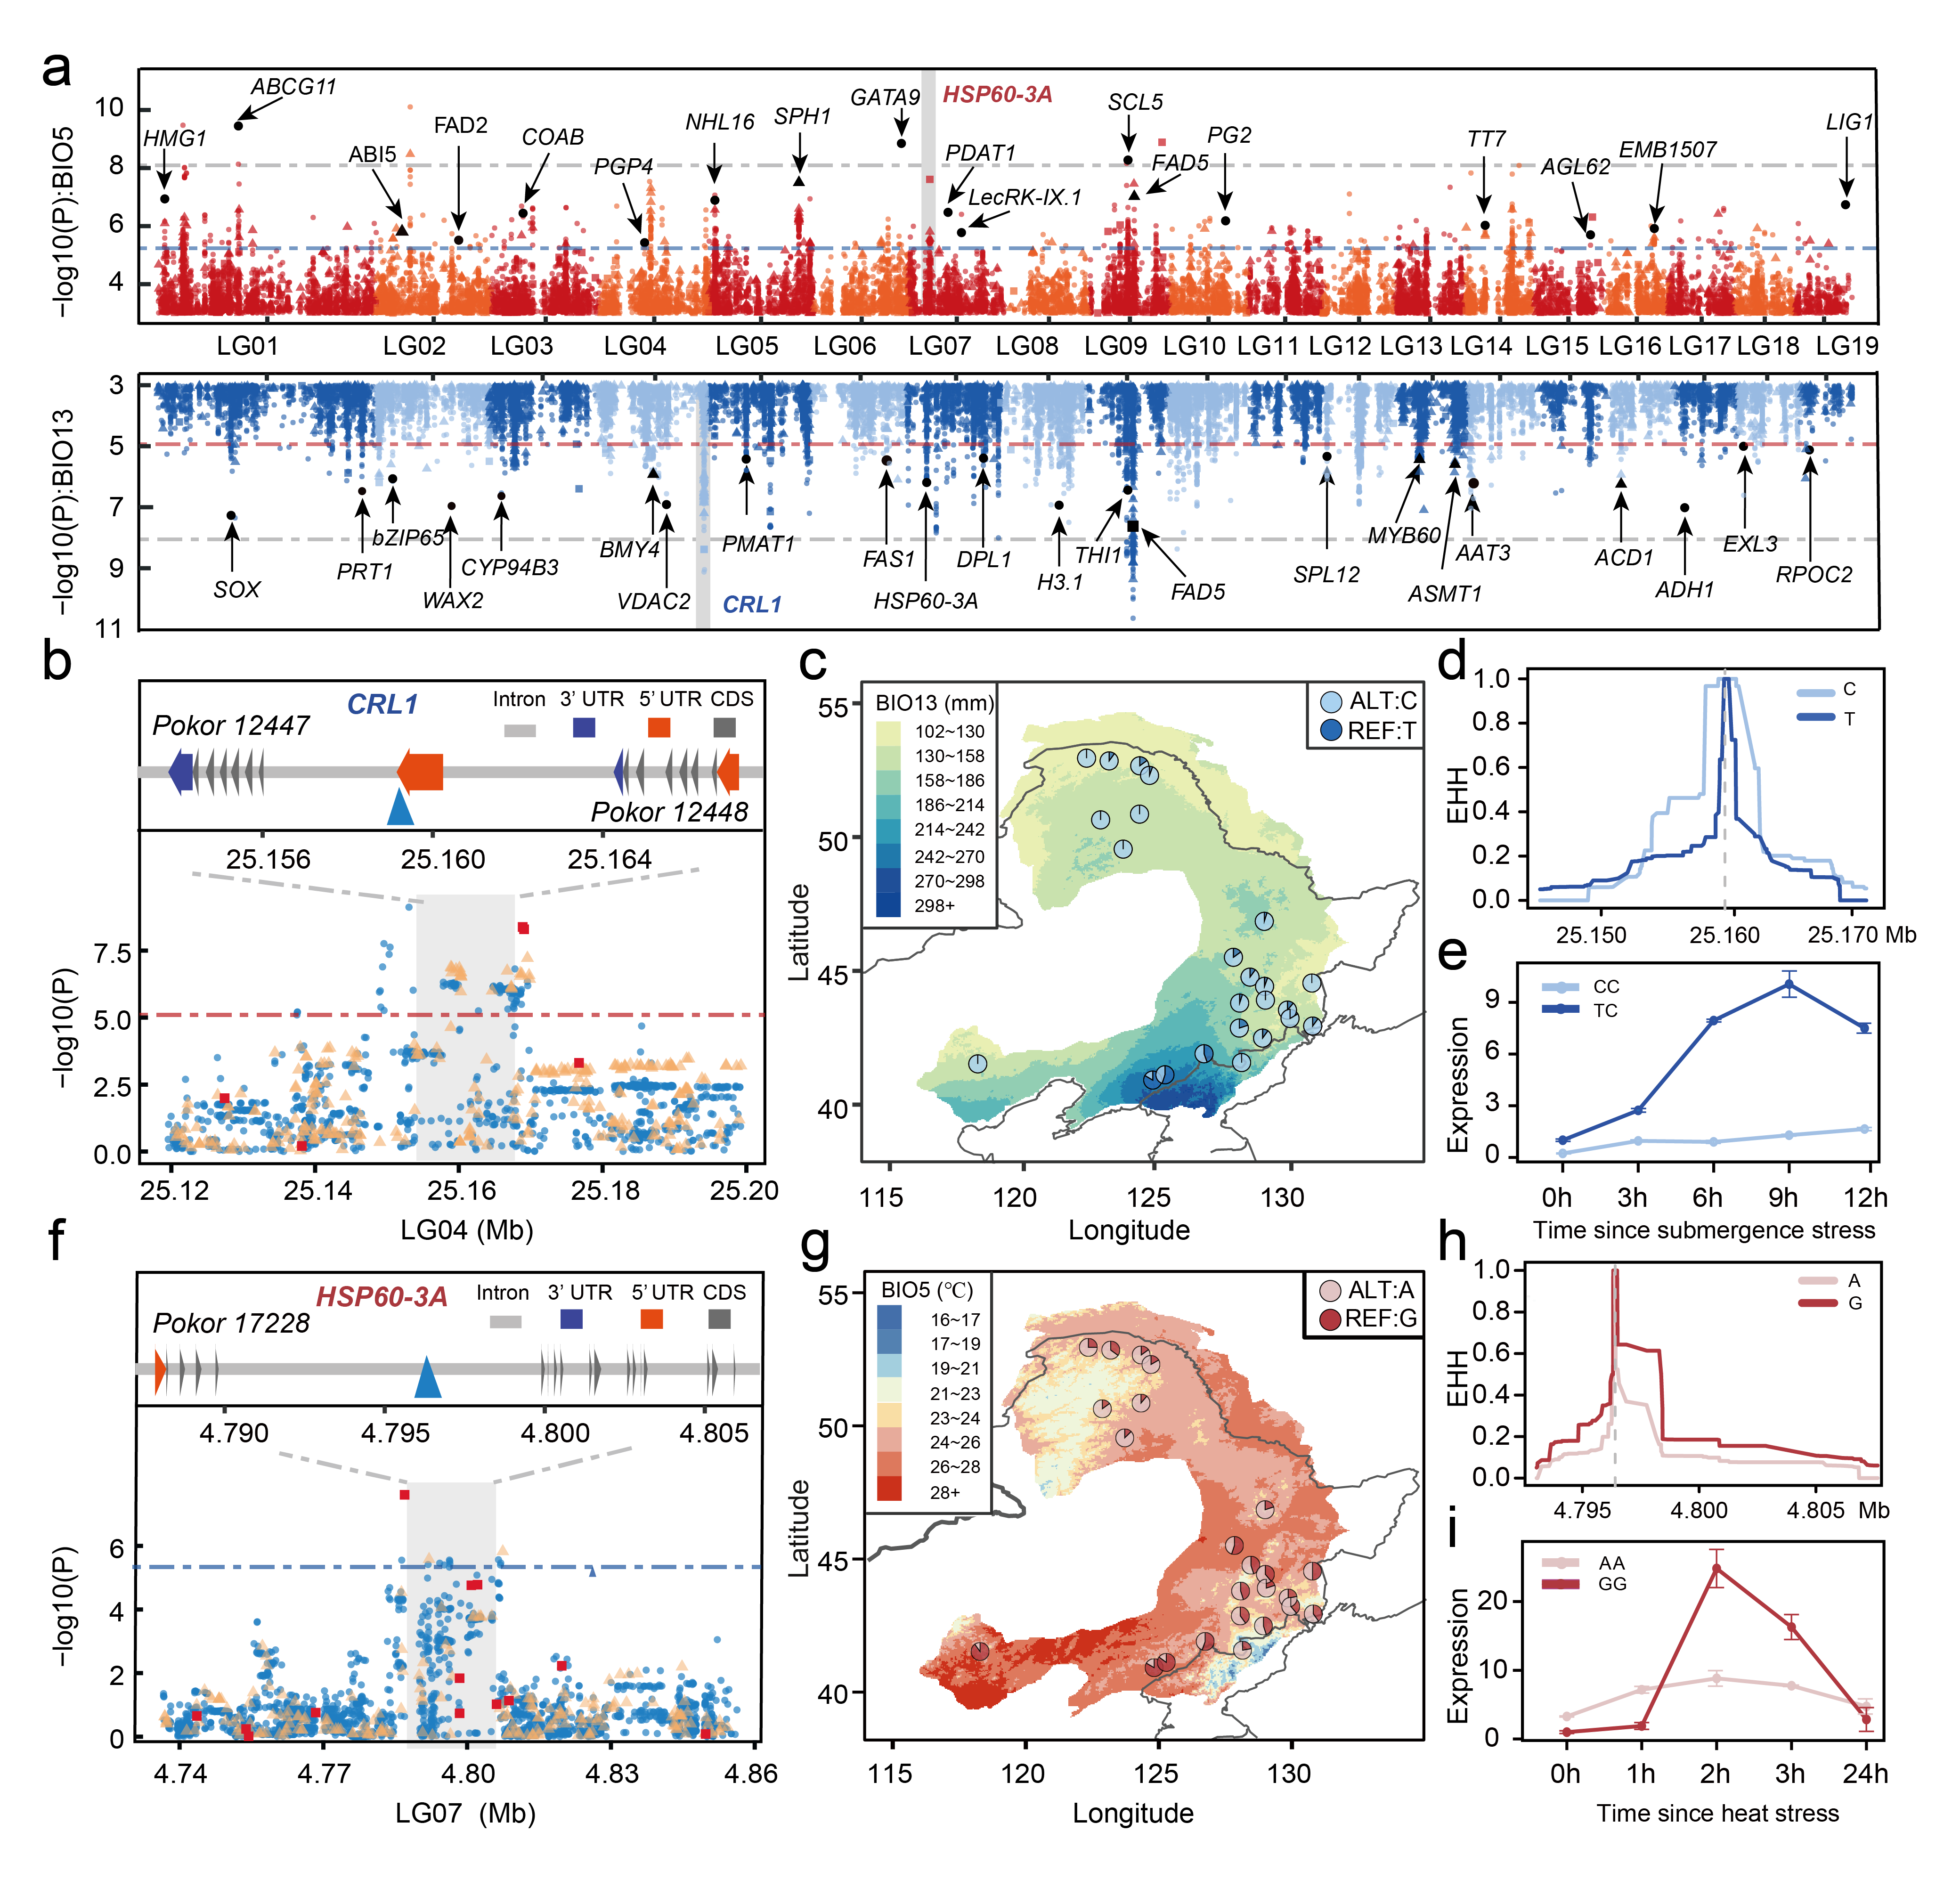
 

Fig. 3 Genome-wide screening of the loci associated with local environmental adaptation. a, Manhattan plots for variants associated with the Maximum Temperature of Warmest Month (BIO5) (red, upper panel) and the Precipitation of Wettest Month (BIO13) (blue, lower panel). Dashed horizontal lines represent significance thresholds (blue or red represents the FDR correction, adjusted P = 0.05; gray represents the Bonferroni correction, adjusted P = 0.05). Selected candidate genes are labeled in the plot at their respective genomic positions. b,f, Upper panels: the gene structure of CRL1 (b) and HSP60-3A (f) (blue triangles: representative candidate adaptive SNPs corresponding to the sites shown in c-e and g-i). Lower panels: local magnification of the Manhattan plots (blue circles: SNPs; yellow triangles: indels; red squares: SVs) around the selected genes (gray shadows). c,g, Allele frequencies of candidate adaptive SNPs (c, LG04:25159299; g, LG07:4796402) associated with BIO5 (c) and BIO13 (g) across the 24 populations. Colors on the map are based on variation of the relevant climate variables across the distribution range. d,h, Decay of EHH for two alternative alleles around LG04:25159299 (d) and LG07:4796402 (h). e,i, Dynamic relative expression level of CRL1 (e) and HSP60-3A (i) genes between the two genotypes using qRT-PCR under submergence (e) and heat (i) treatments. Error bars represent standard deviation, n = 3 biologically independent samples.
Fig. 3 Genome-wide screening of the loci associated with local environmental adaptation. a, Manhattan plots for variants associated with the Maximum Temperature of Warmest Month (BIO5) (red, upper panel) and the Precipitation of Wettest Month (BIO13) (blue, lower panel). Dashed horizontal lines represent significance thresholds (blue or red represents the FDR correction, adjusted P = 0.05; gray represents the Bonferroni correction, adjusted P = 0.05). Selected candidate genes are labeled in the plot at their respective genomic positions. b,f, Upper panels: the gene structure of CRL1 (b) and HSP60-3A (f) (blue triangles: representative candidate adaptive SNPs corresponding to the sites shown in c-e and g-i). Lower panels: local magnification of the Manhattan plots (blue circles: SNPs; yellow triangles: indels; red squares: SVs) around the selected genes (gray shadows). c,g, Allele frequencies of candidate adaptive SNPs (c, LG04:25159299; g, LG07:4796402) associated with BIO5 (c) and BIO13 (g) across the 24 populations. Colors on the map are based on variation of the relevant climate variables across the distribution range. d,h, Decay of EHH for two alternative alleles around LG04:25159299 (d) and LG07:4796402 (h). e,i, Dynamic relative expression level of CRL1 (e) and HSP60-3A (i) genes between the two genotypes using qRT-PCR under submergence (e) and heat (i) treatments. Error bars represent standard deviation, n = 3 biologically independent samples.

How to predict the responses of species and populations to rapid future climate change?


Based on the established contemporary genotype–environment relationships and the identified climate-associated genetic loci, we further predict how populations of P. koreana will respond to future climate change. We used various complementary approaches, including both single-locus-based (RONA), multi-locus-based (GF) as well as models that integrate migration into the analyses, to investigate the spatial pattern of maladaptation across the range of P. koreanaunder future climate conditions. All the results showed that a set of populations located in the southeastern part of the current distribution range are most likely to be vulnerable in the future. These populations, therefore, are needed to be conserved with special management strategies not only because of their high genomic offset to future climate change but also because they contained many unique, climate-adaptive genetic resources. Taken together, our findings highlight the importance of integrating genomic and environmental data to predict adaptive capacity of a key forest to rapid climate change in the future, and also identify many candidate genes and variants that may be useful for future forest tree breeding with special aims.
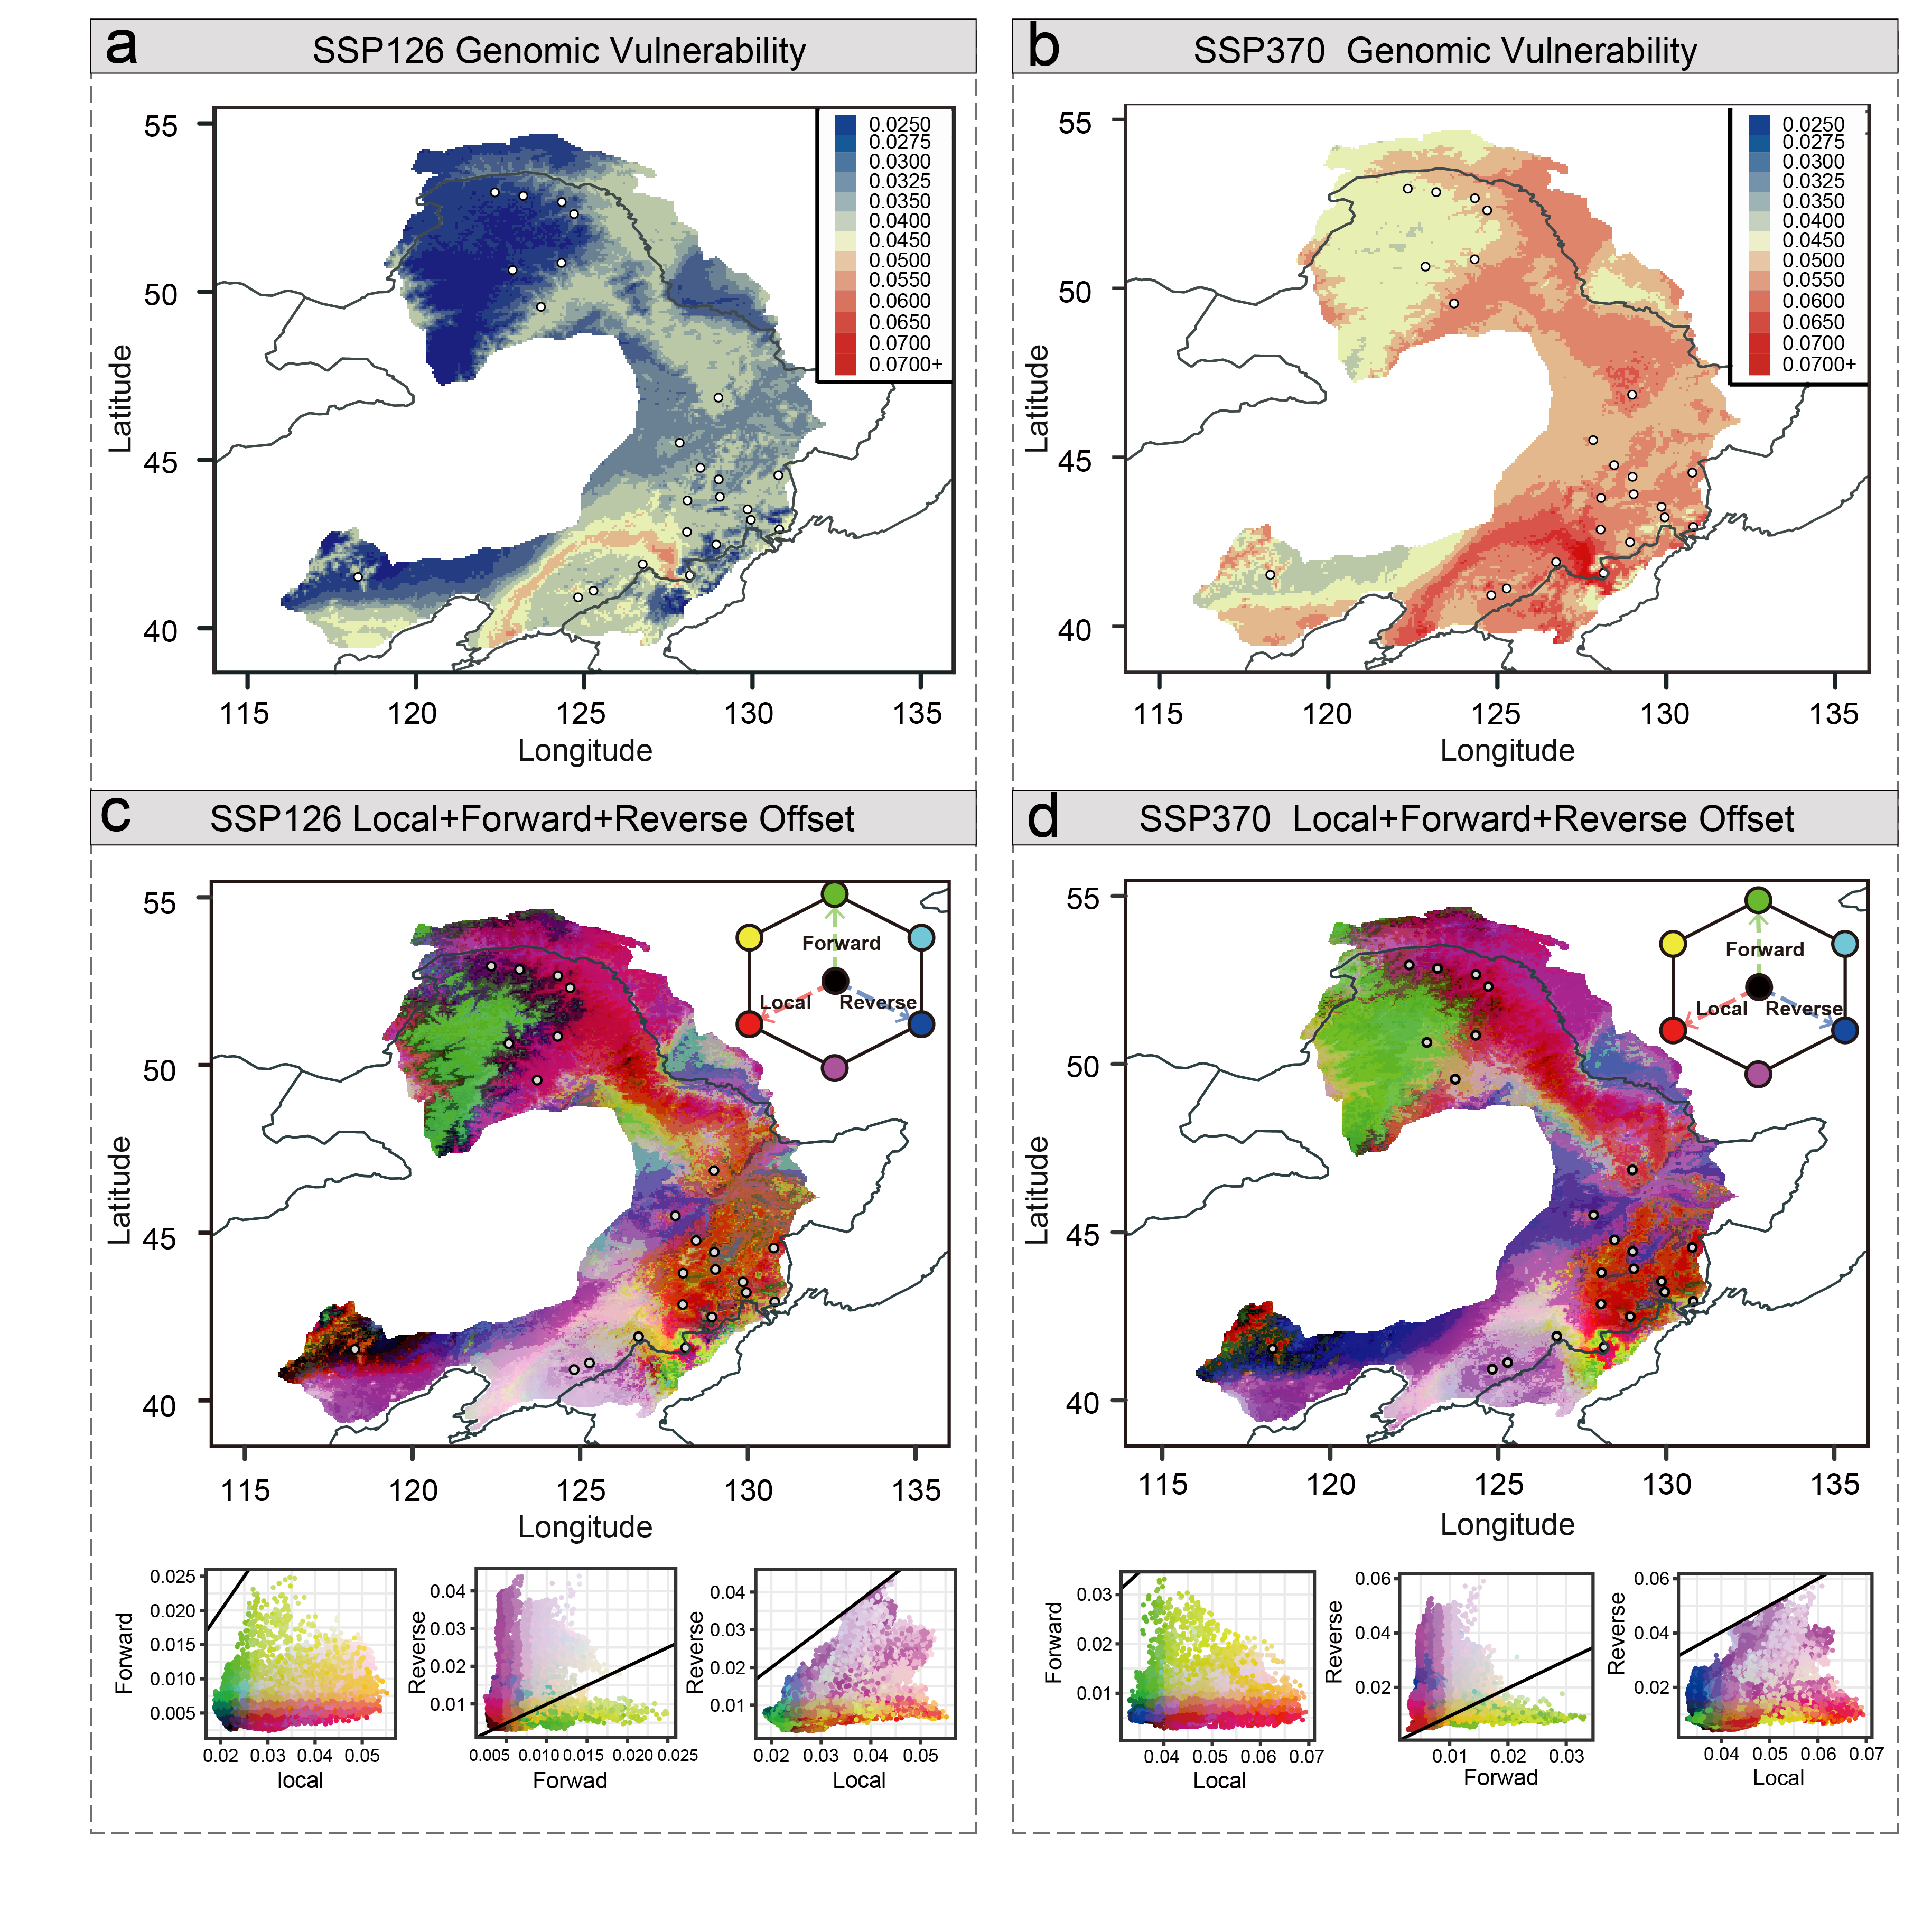
Fig. 5 Predicted genetic offsets to future climate change under SSP126 and SSP370 in 2061-2080. a,b, Map of the GF-predicted genetic offset averaged across four climate models across the distribution of P. koreana (n=60,000 grids) under two scenarios of shared socioeconomic pathways SSP126 (a) and SSP370 scenarios (b) in 2061-2080. The color scale from blue to red refers to increasing values of genetic offset, and points on the map reflect the 24 sampled populations. c,d, RGB map of local (red), forward (green), and reverse (blue) offsets throughout the range of P. koreana (n=60,000 grids) under SSP126 (c) and SSP370 (d) scenarios in 2061-2080. Brighter cells (closer to white) have relatively high values along each of the three axes, whereas darker cells (closer to black) have relatively lower values. Lower panels are the bivariate scattergrams of c and d with 1:1 lines.

Please sign in or register for FREE

If you are a registered user on Research Communities by Springer Nature, please sign in

Go to the profile of Gao Jianguo
about 2 years ago

Hi, Jing, Well Done!
It would be more interesting your field story and field photos here~~Field work is really fun, cheers~

Follow the Topic

Ecology
Life Sciences > Biological Sciences > Ecology

Related Collections

With collections, you can get published faster and increase your visibility.

Carbon dioxide removal, capture and storage

In this cross-journal Collection, we bring together studies that address novel and existing carbon dioxide removal and carbon capture and storage methods and their potential for up-scaling, including critical questions of timing, location, and cost. We also welcome articles on methodologies that measure and verify the climate and environmental impact and explore public perceptions.

Publishing Model: Open Access

Deadline: Mar 22, 2025

Advances in catalytic hydrogen evolution

This collection encourages submissions related to hydrogen evolution catalysis, particularly where hydrogen gas is the primary product. This is a cross-journal partnership between the Energy Materials team at Nature Communications with Communications Chemistry, Communications Engineering, Communications Materials, and Scientific Reports. We seek studies covering a range of perspectives including materials design & development, catalytic performance, or underlying mechanistic understanding. Other works focused on potential applications and large-scale demonstration of hydrogen evolution are also welcome.

Publishing Model: Open Access

Deadline: Dec 31, 2024