Connecting the dots: The Hidden Network of Urban Centres
Published in Social Sciences, Earth & Environment, and Research Data

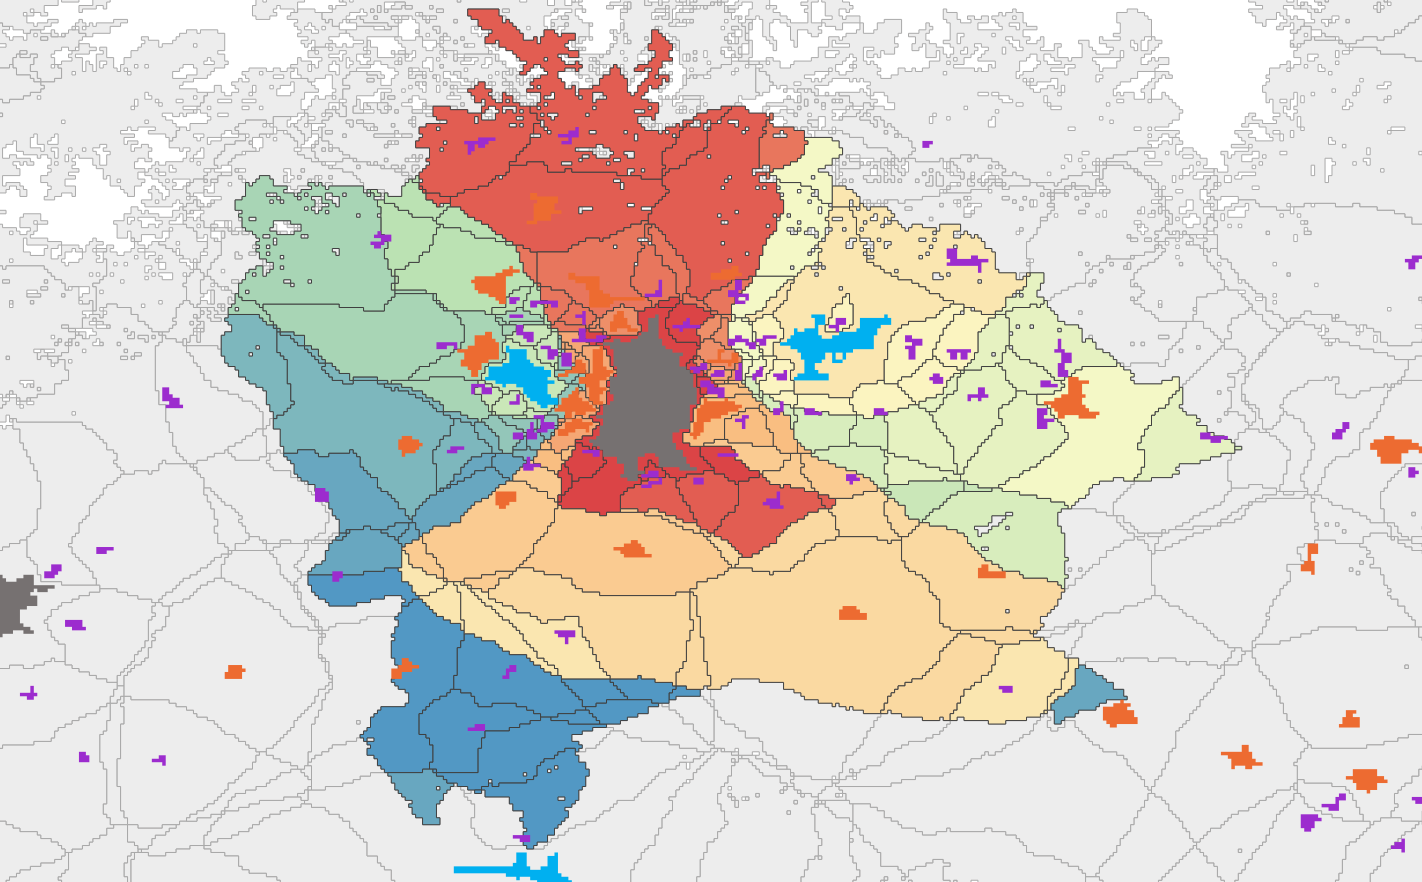
Our informal collaboration began by asking what rural and urban mean in today’s connected world and ended up answering how countries across the globe are organized around multiple urban centres of different sizes. This is a story of transforming local insights into a comprehensive global framework and dataset.
Andrea:
I really enjoy going back to seminal papers that have shaped how we think about a problem today even though we may not be aware of it. Our paper is very much the product of applying the tools of today – computers and geographic information systems (GIS) – to theories that were conceptualized nearly hundred years ago. Central Place Theory (CPT), first formalized by Walter Christaller in the 1930s, has been hugely influential, and still is to this day [1]. CPT posits that urban centres come to be strategically distributed to ensure that people—from big cities to rural areas—can access the goods and services they need. It assumes that larger cities offer more specialized goods and services as well as all the essentials available in smaller urban centres. Developing CPT in the 1930s required very constraining assumptions about the spatial distribution of urban centres, to be handled with simple geometry. However, the advent of GIS allows for analyzing central places in actual spatial terms and their regions of influence.
An intriguing insight for our research came from Charles J. Galpin, an eclectic educator and pastor turned sociologist, based at the University of Wisconsin in the early 1900s. In 1915 he wrote a pivotal paper entitled The Social Anatomy of an Agricultural Community in which he showed how “each farm could belong to a community of its own differing from that of every other” [2]. Based on its location a farm could rely on a school in one town, on a bank in another, and a church in yet a different location, and these may differ from those for a neighbouring farm. This idea would be considered unconventional even today when defining what constitutes a rural community. However, that insight about diversity based on location is highly relevant in today’s world, more than a century later. This is the central insight I wanted to capture: each location in a spatial GIS framework could have different centres of reference for employment, commodities, services, and cultural activities, and this could be done within the CPT framework.
In earlier work, meant to overcome the urban-rural dichotomy, my co-authors and I had introduced the idea of urban-rural catchment areas and published a global mapping of these [3]. However, that work had the limit that every location had only one urban centre of reference, which had several drawbacks. So, we set out to expand that approach and consider access to multiple urban centres from any location Little did I know that following this intuition would lead us to provide the first systematic representation of multi-tier city–regions around the world. However, this seemingly simple improvement was unexpectedly complex. I really had no idea how to handle that level of complexity.

Serkan:
When Andrea approached us with the idea to create a dataset of regions around cities that are linked to multiple urban centres based on possible services provided, it was clear that this required a sophisticated geospatial analysis, presenting multiple challenges. First, it entailed calculating the proximity of each location on the Earth to various urban centres in their vicinity. Available GIS tools would require complex workflows with long processing times to perform such an analysis at global scale for 219 million land-based locations with 30 arc-seconds granularity and over 30,000 urban centres. This challenge was a good match for the geospatial tool I was in the process of finalizing: the open-source Globetrotter software, which is specifically designed to delineate such regions by using gridded travel friction data as input, such as the 30-arcsecond global land-based travel friction grid of Weiss et al. [4], and by leveraging parallel computing capabilities of modern computing hardware [5]. An early version of the tool was used to examine the resilience of domestic transport networks for national food systems [6]. Globetrotter, written in Go language, is efficient, quick, and handles large datasets easily. Here too we rely on seminal papers of the past, employing Edsger W. Dijkstra’s 1959 algorithm for finding the shortest path between grid cells over a friction grid [7].
The second challenge in identifying multi-tier city-regions was the classification of urban centres into different tiers based on levels of services they can provide, such as education, health, shopping, and transport facilities, as well as employment opportunities. Since a global spatial registry of such facilities is not available, we had to use population as a proxy to determine service tiers of the urban centres. Using population for this purpose may sound straightforward, but unfortunately it is also complicated due to the diversity and discrepancy of available population datasets at high spatial granularity. To address this, I developed a methodology that uses a decision tree to assign urban centres to a specific tier, considering multiple population datasets concurrently, resulting in a robust classification that exploits accordance between datasets without overlooking their differences.
The final challenge was how to organize all the information being processed. The 219 million locations had to be aggregated into ‘patches’ describing locations served by the same set of urban centres. The last step was then delineating city–regions by assembling the over 100,000 patches we obtained, which was akin to completing a gigantic puzzle. In the end, we've expanded Charles J. Galpin's 1915 insights from a small survey in Walworth County, Wisconsin, to a comprehensive global scale. We invite readers to explore this dataset [8] that can be used for regional planning, natural resource management, and developing sustainable city–regions globally.
References
- Christaller, W. (1933). Die zentralen Orte in Süddeutschland : Eine ökonomisch-geographische Untersuchung über die Gesetzmässigkeit der Verbreitung und Entwicklung der Siedlungen mit städtischen Funktionen. Jena Fischer.
- Galpin, C. J. (1915). The social anatomy of an agricultural community (No. 34). Agricultural Experiment Station of the University of Wisconsin.
- Cattaneo, A., Nelson, A. and McMenomy, T., (2021). Global mapping of urban–rural catchment areas reveals unequal access to services. Proceedings of the National Academy of Sciences, 118(2), p.e2011990118.
- Weiss, D.J., Nelson, A., Vargas-Ruiz, C.A. et al. (2020). Global maps of travel time to healthcare facilities. Nature Medicine 26, 1835–1838. doi:10.1038/s41591-020-1059-1.
- Girgin, S. (2024). Globetrotter: Fast minimum cumulative weighted distance and catchment analysis [Software]. Zenodo. doi:10.5281/zenodo.11668651
- Nelson, A., de By, R., Thomas, T., Girgin, S., Brussel, M., Venus, V. and Ohuru, R. (2021). The resilience of domestic transport networks in the context of food security – A multi-country analysis. Background paper for The State of Food and Agriculture 2021. FAO Agricultural Development Economics Technical Study No. 14. Rome, FAO. doi:10.4060/cb7757en
- Dijkstra, E. W. (1959) A note on two problems in connexion with graphs, Numerische Mathematik, 1:269-271, doi:10.1007/BF01386390
- Cattaneo, A., Girgin, S., de By, R. A., McMenomy, T., Nelson, A., and Vaz, S. (2024). Worldwide Delineation of Multi-Tier City-Regions [Data set]. Zenodo. doi:10.5281/zenodo.11187634
Follow the Topic
-
Nature Cities

This journal aims to deepen and integrate basic and applied understanding of the character and dynamics of cities, including their roles, impacts and influences — past, present and future.


Please sign in or register for FREE
If you are a registered user on Research Communities by Springer Nature, please sign in