Discovering Tehran’s Hidden Urban Patterns: How Traffic and Mobile Data Reveal the City’s Pulse
Published in Social Sciences, Earth & Environment, and Civil Engineering
Explore the Research

 elsevier.com
Just a moment...
Skip to main content
Introduction
Cities are living, breathing entities shaped by the movements of their inhabitants. In our recent study, "Hidden Urban Patterns: Existential Discovery of Urban Patterns Based on Traffic and Virtual Space," published in Transportation Research Interdisciplinary Perspectives, we explored how human mobility data—derived from mobile phones and traffic indicators—can uncover the invisible rhythms of Tehran. This research not only highlights the challenges of urban mobility but also offers actionable insights for planners and policymakers.
The Heart of the Study
The core question driving our research was: How do traffic indicators and daily trips based on mobile data influence the formation of congested areas in Tehran? To answer this, we combined two innovative data sources:
-
Tehran Municipality API: Provided real-time traffic metrics like average speed, travel delays, and transit capacity.
-
Neshan Locator Software: Mapped high-mobility hotspots using geospatial data and distance matrices.
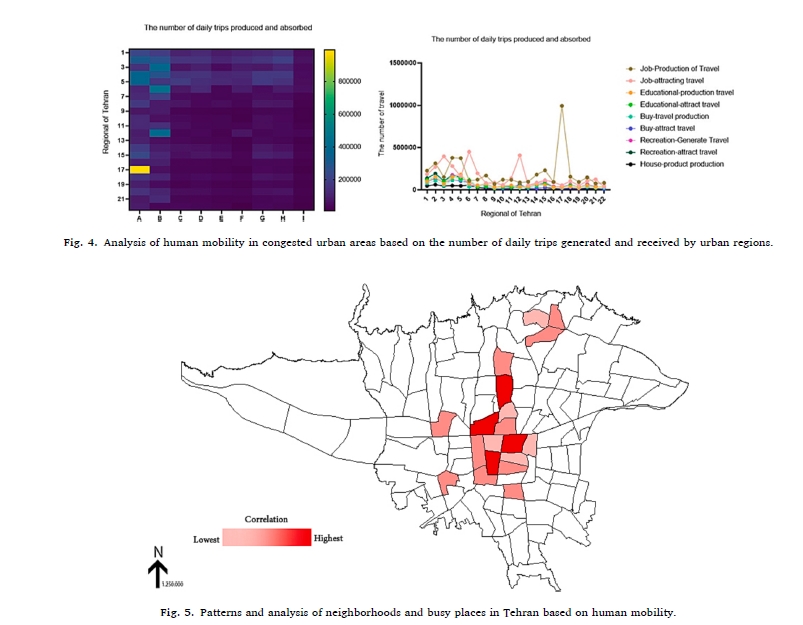
Our methodology leveraged heat maps and meta-analyses to visualize patterns, revealing how human movement clusters around specific activities—work, education, shopping, and leisure.
Key Findings
-
Congestion Hotspots: Regions 6, 11, and 12 emerged as Tehran’s busiest zones, with the highest trip generation and absorption. The Grand Bazaar (Region 12) and government hubs (Region 6) were major attractors.
-
Traffic Indicators: Lower average speeds correlated with higher mobility and delays. For example, Region 22’s higher speeds indicated fewer congestion issues, while central regions suffered from chronic slowdowns.
-
Seasonal Trends: Summer saw peak mobility, especially around terminals like West and South, linked to travel and tourism.
-
Cost of Congestion: Accidental damages and road maintenance costs were the most significant burdens tied to mobility conflicts.
Why This Matters
Understanding these patterns isn’t just academic—it’s a toolkit for smarter cities:
-
Transport Planning: Redirecting resources to high-congestion areas can reduce delays.
-
Public Health: Mobility data can predict disease spread, as seen during COVID-19.
-
Economic & Environmental Gains: Reducing congestion lowers pollution and urban costs.
A New Lens for Urban Challenges
Our study shifts the narrative from linear mobility models to a decentralized, multi-dimensional view. By treating streets as "mobility patterns," we’ve created a framework applicable to cities worldwide, especially in developing contexts where data is scarce.
Final Thoughts
Tehran’s story is a microcosm of global urban challenges. As we move toward smarter cities, real-time data and interdisciplinary tools will be key to designing spaces that work for people, not against them.
Read the full paper here (link to DOI: 10.1016/j.trip.2023.100997).
Let’s discuss! How does your city handle mobility challenges? Share your thoughts in the comments.
Authors: Ehsan Dorostkar & Mahsa Najarsadeghi
Follow our research on Twitter | LinkedIn for more urban insights!


Please sign in or register for FREE
If you are a registered user on Research Communities by Springer Nature, please sign in