Gridded precipitation intensity-duration-frequency curves in Qinghai-Tibet Plateau
Published in Earth & Environment, Sustainability, and Statistics
Why the QTPPIDFC dataset is generated?
Qinghai-Tibet Plateau (QTP) is one of the hotspots for natural disaster studies on Earth, and it is highly vulnerable to destructive rainstorm hazard and related natural disasters, which seriously threaten lives of billions of people locally and in its downstream areas, accompanied by extensive damage to buildings, farms, roads, and other property. Short-duration heavy precipitation at sub-daily scales is an important trigger for flash flood, landslide, debris flows and other natural disasters in QTP. Confronted with increasing flash flood susceptibility in QTP due to climate change, investigating extreme precipitation characteristics is therefore of marked importance for mitigating and controlling natural disasters, as well as supporting hydrological design and risk management strategies in the region.
However, QTP is a typical ungauged high mountain region, observed data for sub-daily precipitation is extremely limited. Although there have been several satellite products for sub-daily precipitation in QTP, their quality has large bias, leaving a large data gap for supporting rainstorm-related natural disaster studies in the region.
Precipitation intensity-duration-frequency (IDF) curves afford a feasible approach to quantitatively describe extreme precipitation characteristics and have been widely applied in the field of Hydrology. They graphically represent the relationship among intensity, duration, and the occurring probability of extreme precipitation, providing a solid foundation for the research of rainstorm-related disasters, as well as the design of hydraulic infrastructures and drainage systems. Thereby, in the research we employed the concept of IDF, and generated the Qinghai-Tibet Plateau Precipitation Intensity-Duration-Frequency Curves (QTPPIDFC) dataset, the first gridded dataset tailored for estimating extreme precipitation characteristics in QTP.
How the QTPPIDFC dataset is generated?
For filling the data gap, we collected observed hourly precipitation data at 203 weather stations in and around QTP (Figure 1), and used the annual maxima sampling method to extract the annual maxima hourly precipitation data samples. We found that the generalized extreme value distribution performs the best in fitting these hourly precipitation data samples, based on which the at-site IDF curves were estimated. Considering the high spatial inhomogeneity in extreme precipitation characteristics and the sparse distribution of limited rainfall stations in QTP, we alternatively applied the principal component analysis (Figure 2) to identify the southeast-northwest spatial pattern of at-site IDF curves, and its first principal component gives an explained variance as high as 96%. Finally, we did spatial interpolation using the established random forest model to estimate gridded IDF curves, with geographical and climatic variables as explanation factors.
Figure 1. Qinghai-Tibet Plateau (QTP) and locations of the 203 weather stations used for this research.
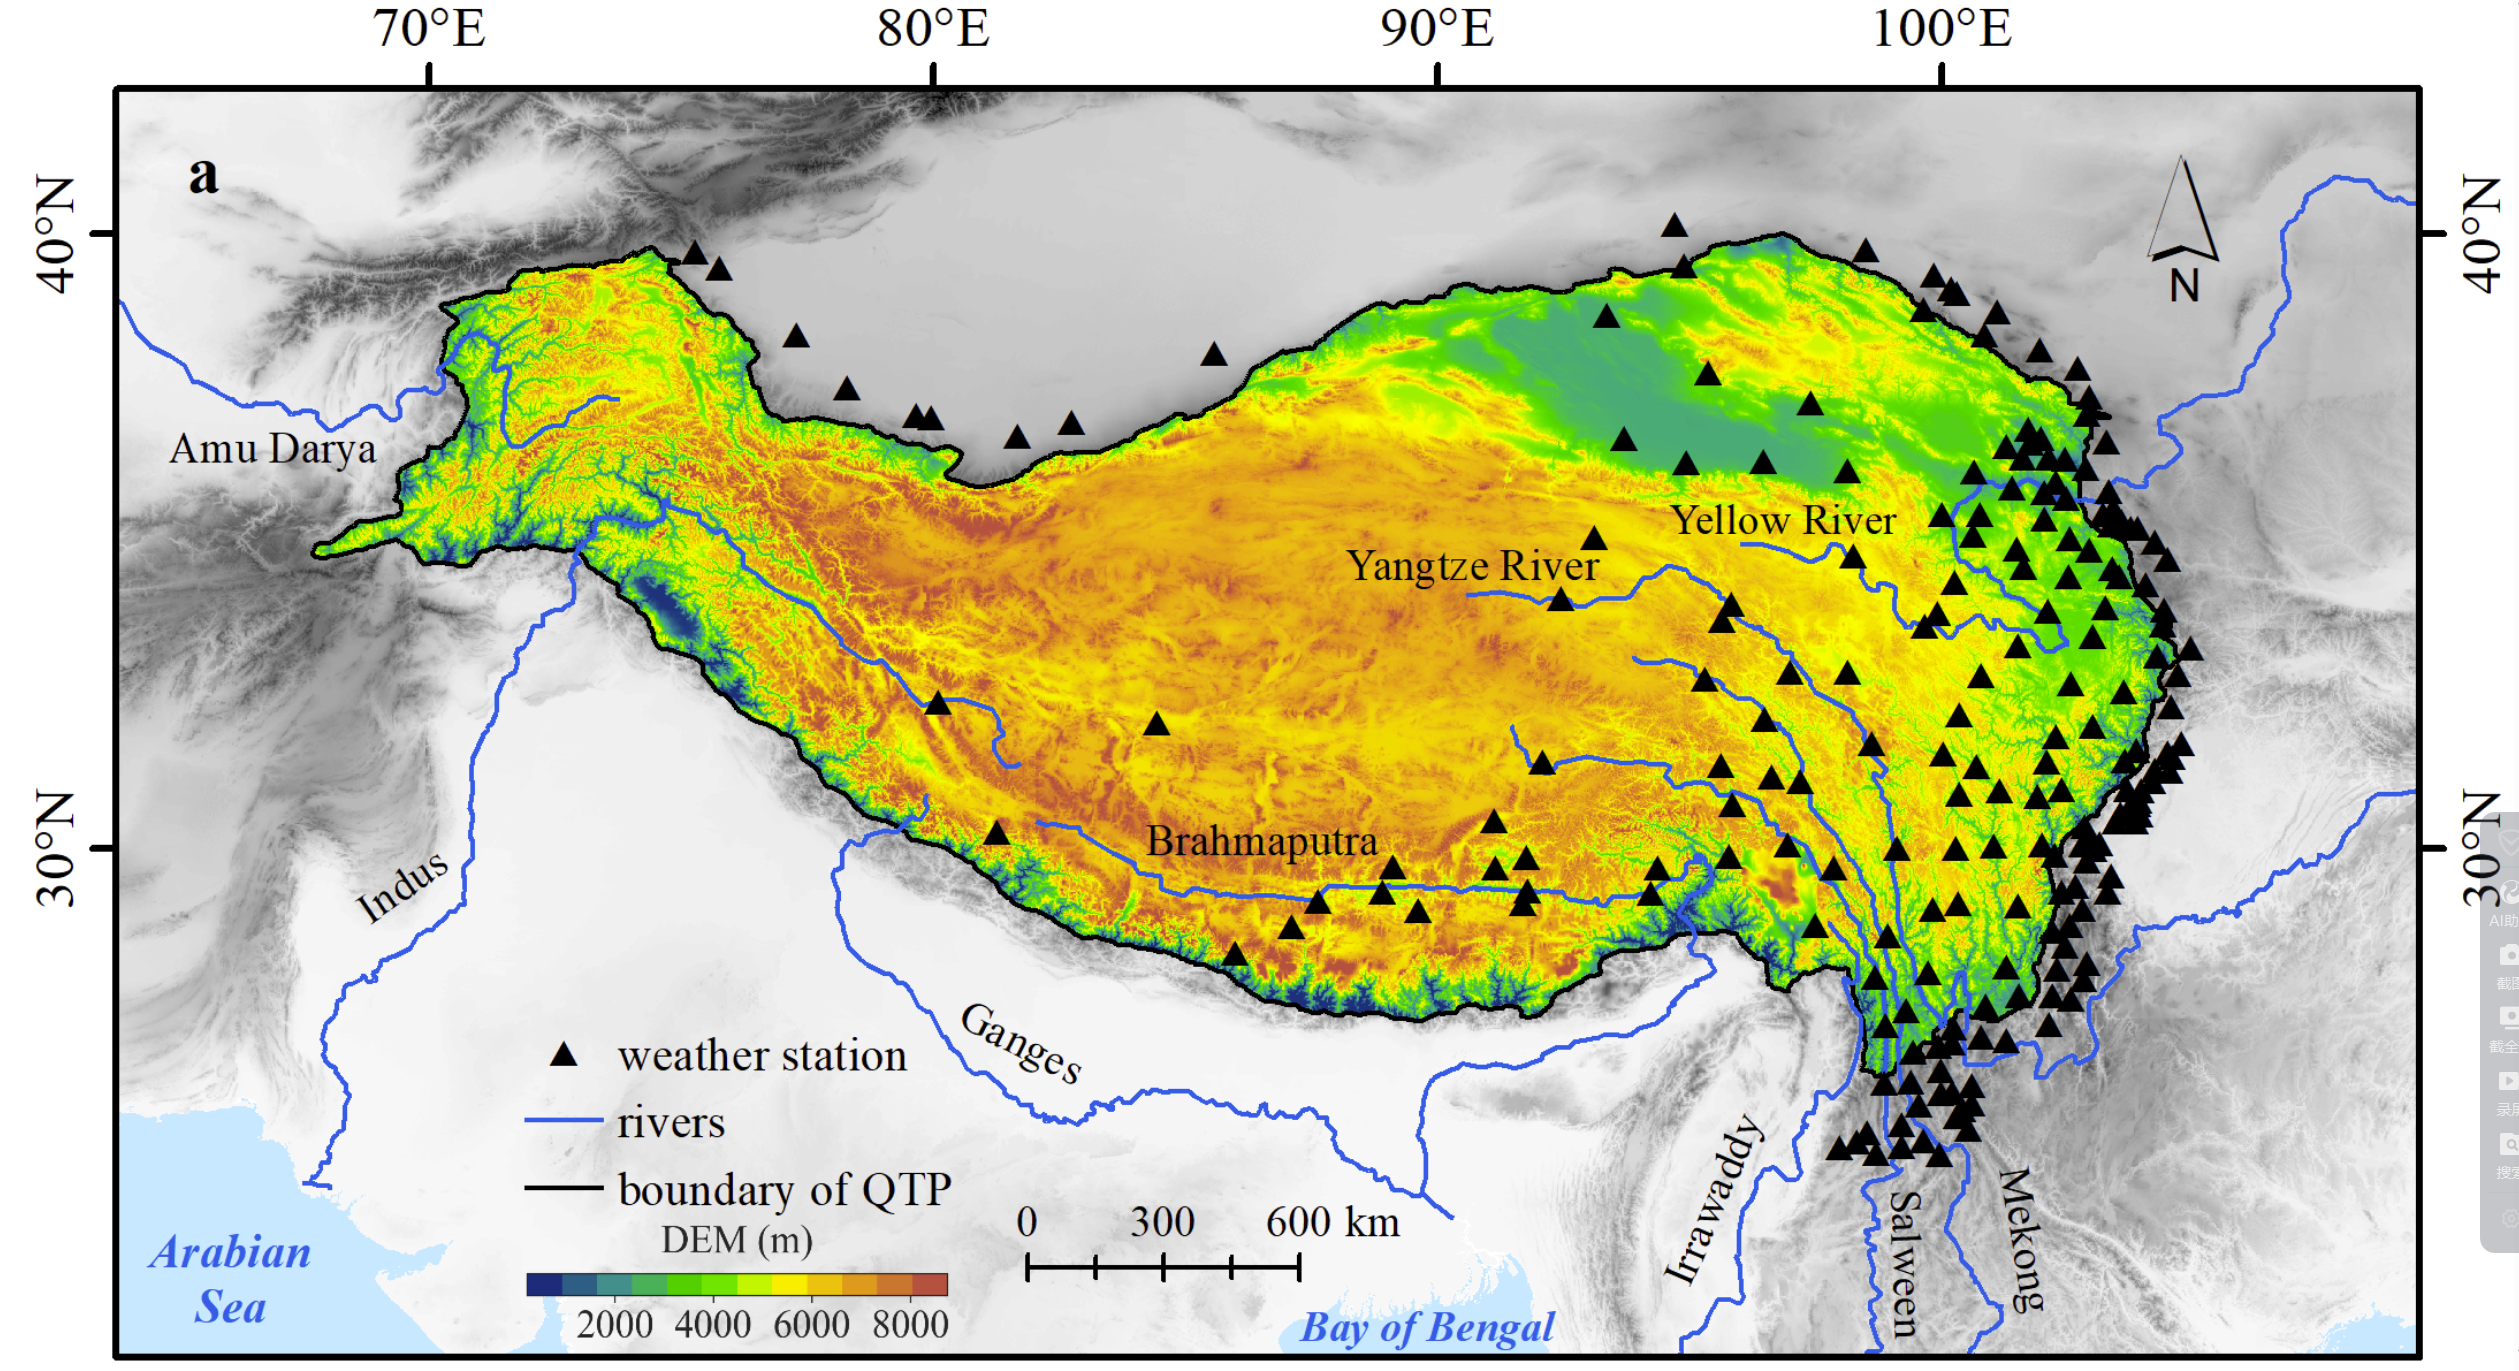
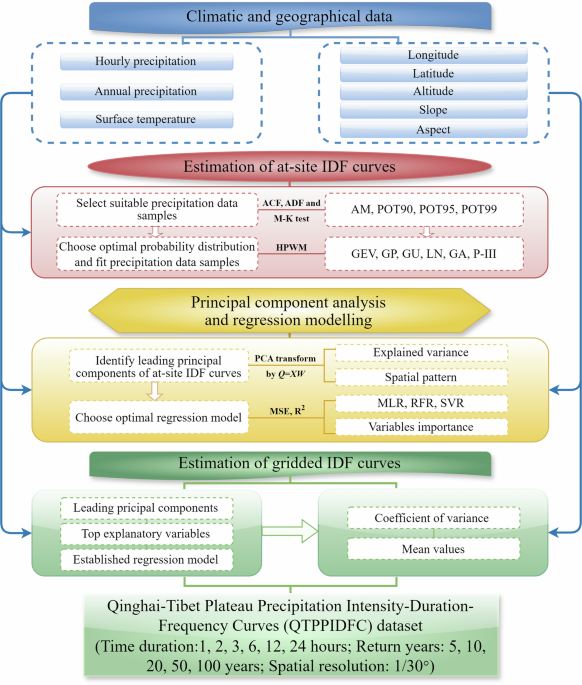
Figure 2. Workflow of generating the QTPPIDFC dataset in this research.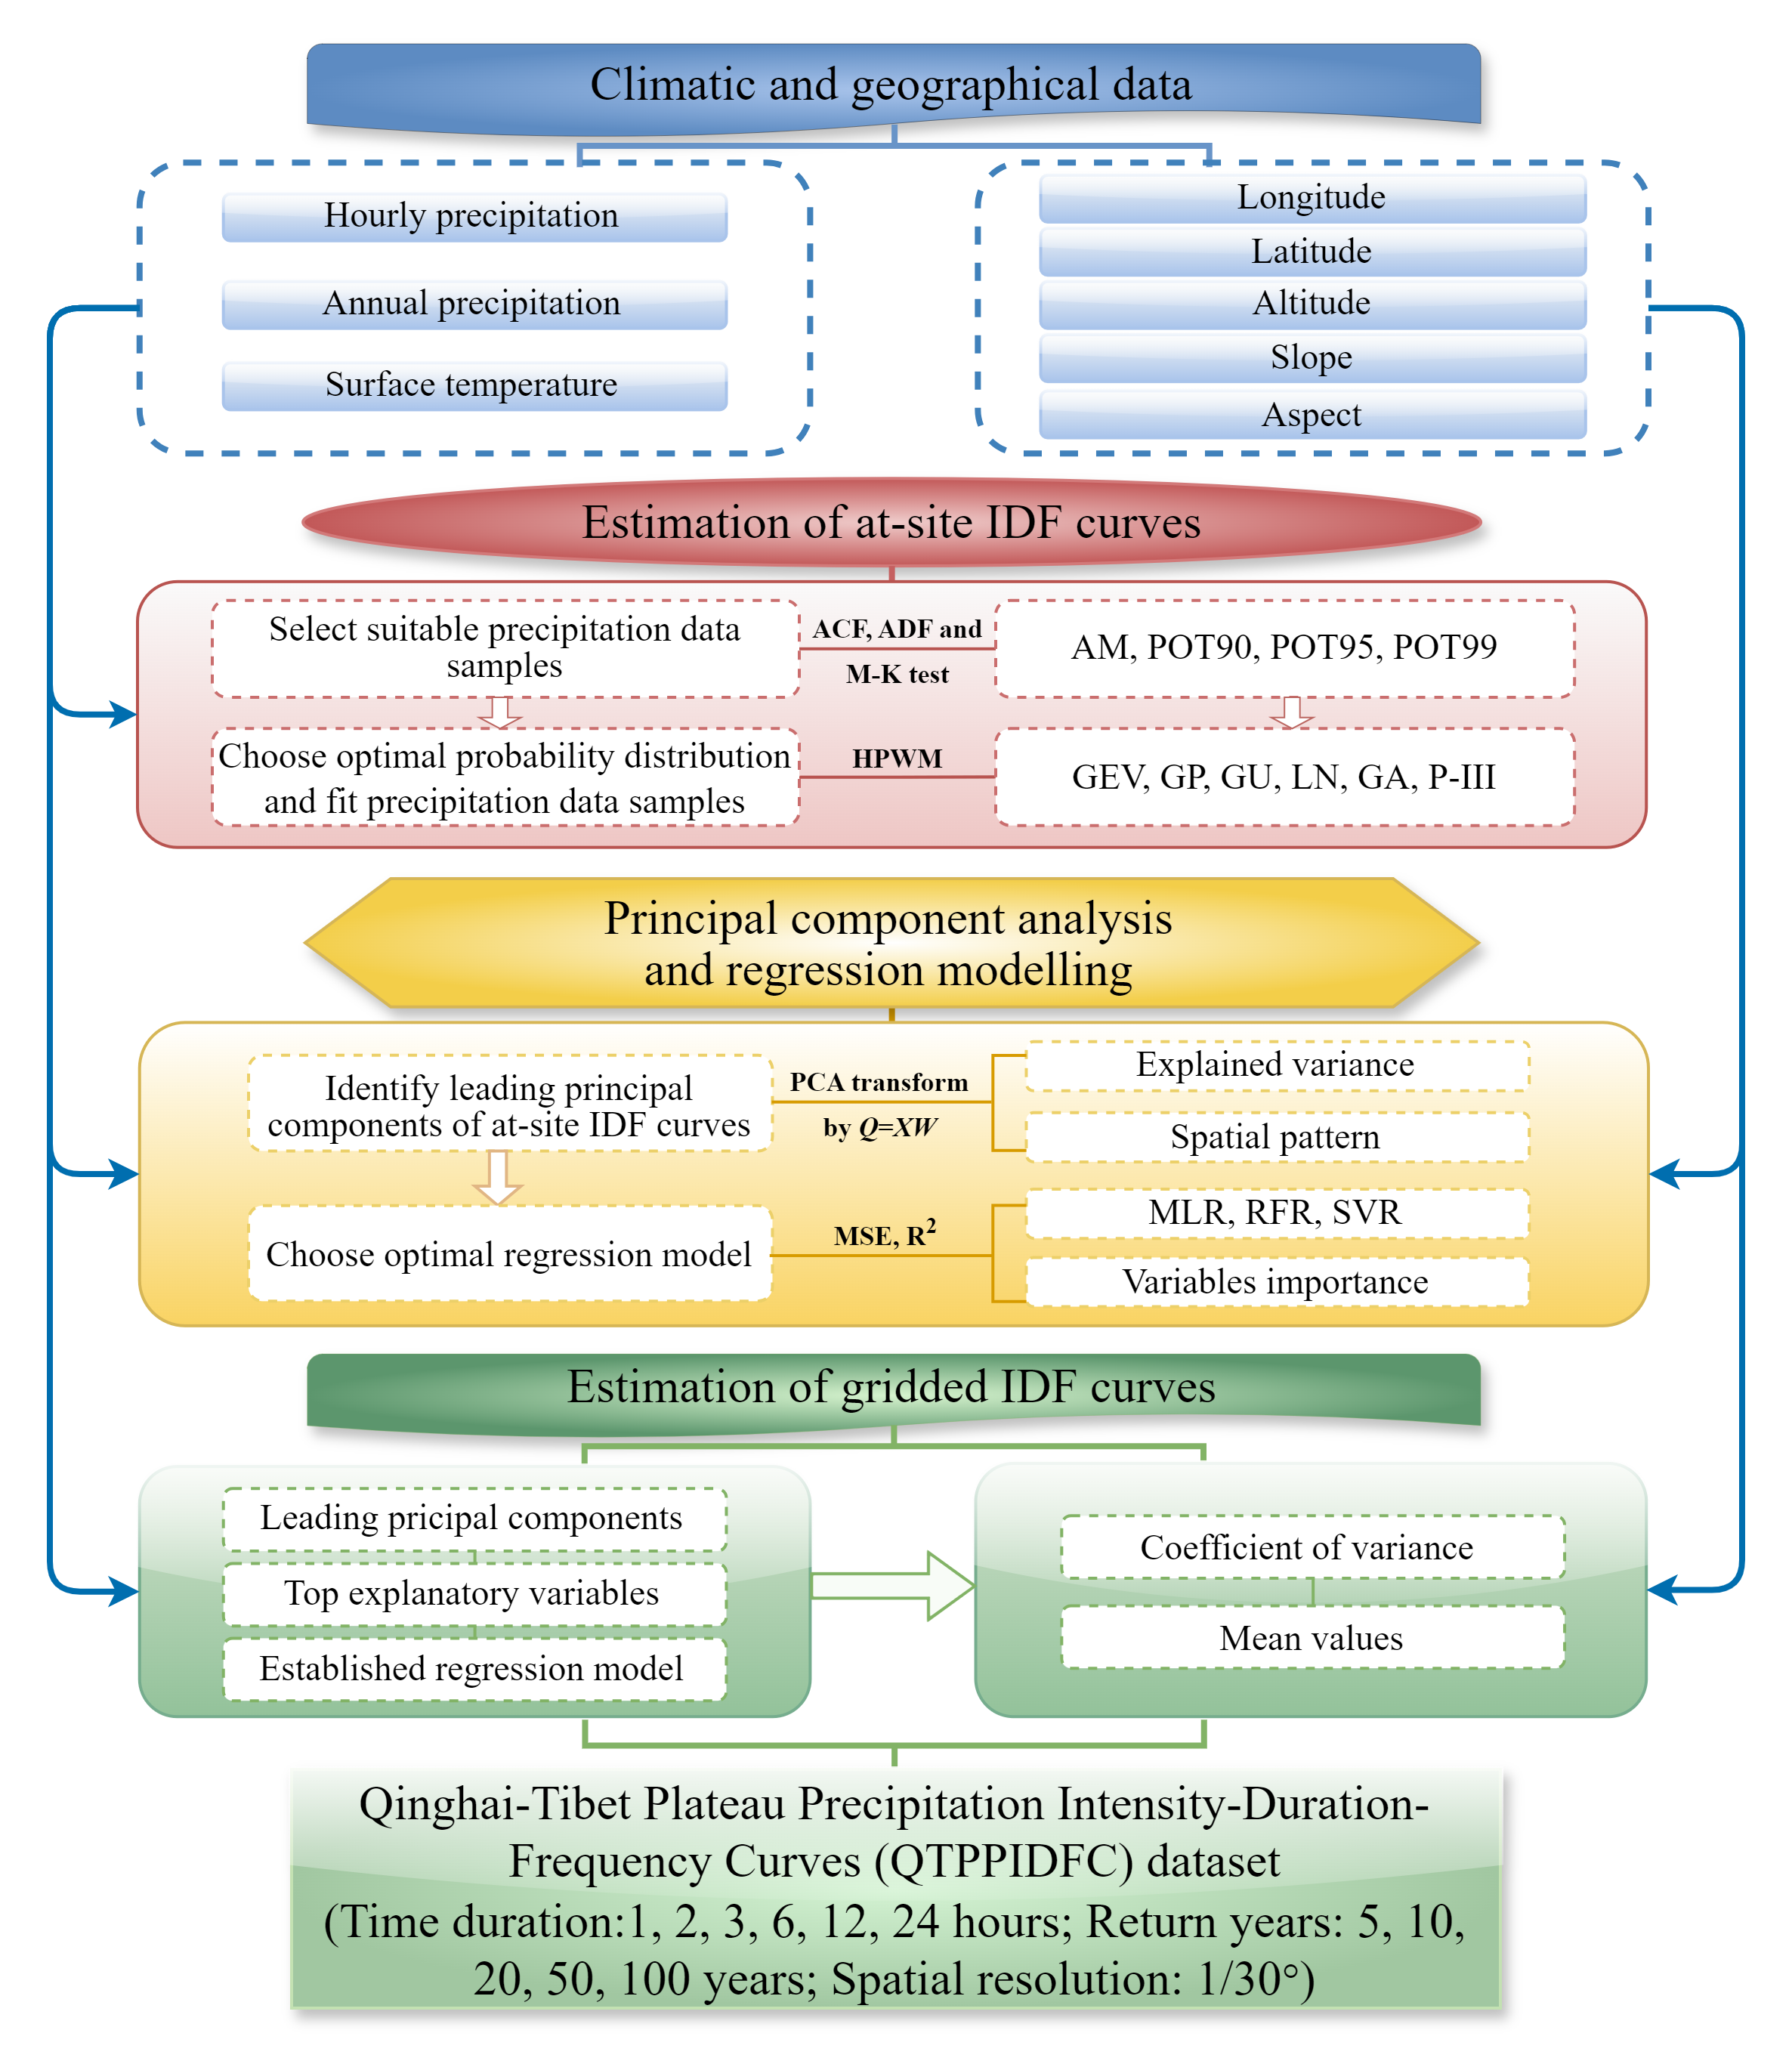
What the QTPPIDFC dataset can be used for?
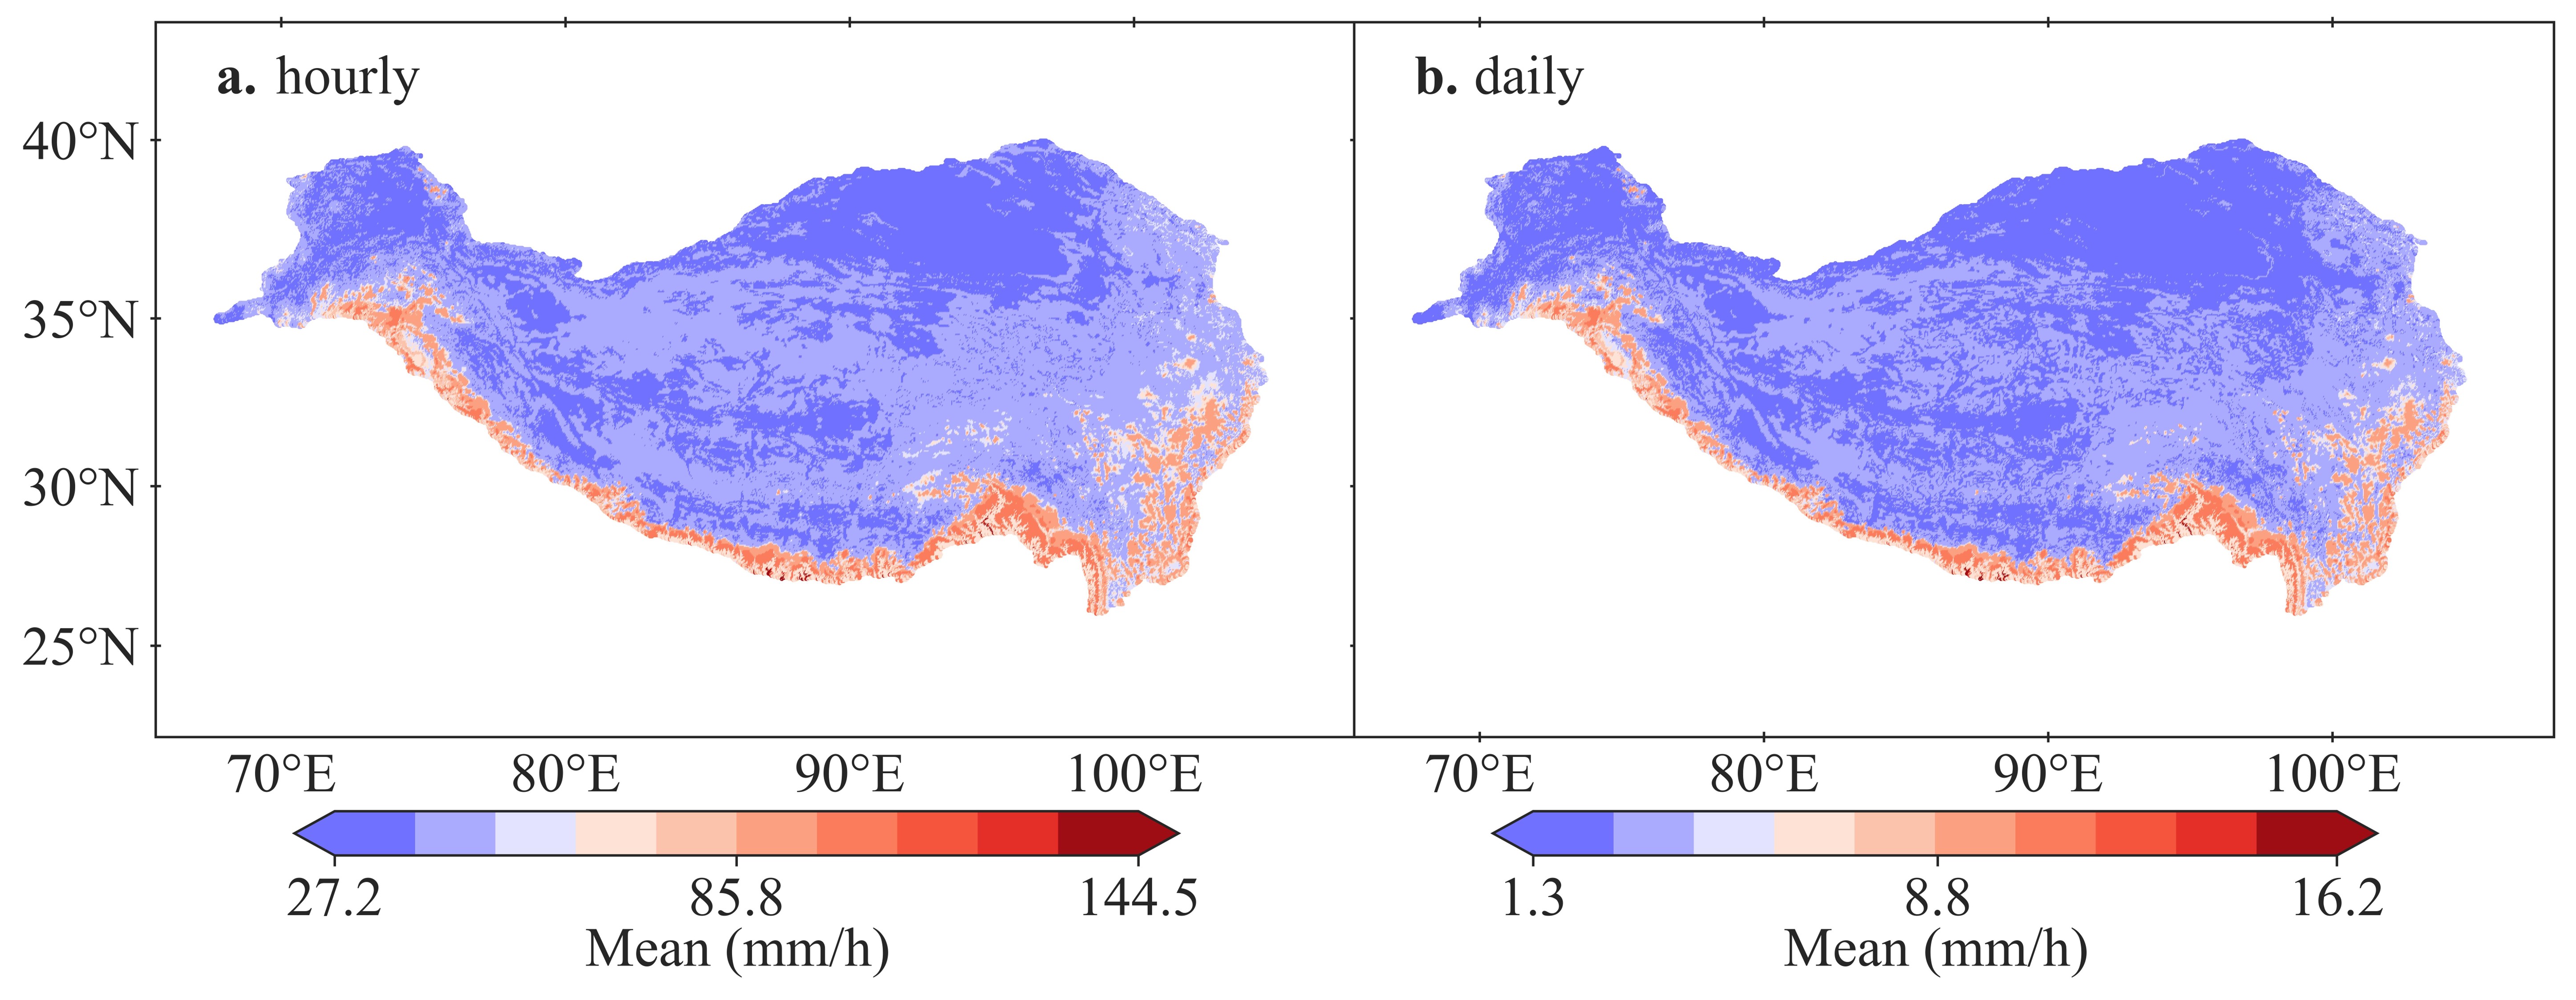
Anyone can freely access the dataset using the link: https://data.tpdc.ac.cn/zh-hans/data/c13b2392-4f09-472f-8ad6-2c8d130f84e7. The dataset can directly provide precipitation information within 1, 2, 3, 6, 12, 24 hours and 5, 10, 20, 50,100 return years, with a 1/30° spatial resolution (Figure 3). The dataset can solidly serve for hydrometeorological-related risk management and hydraulic/hydrologic engineering design in QTP.
Figure 3. Spatial distribution of the estimated gridded hourly precipitation intensity (a) and daily precipitation intensity (b) in 100 return years in QTP, with a 1/30° spatial resolution.
 We warmly welcome cooperation in the research of rainstorm-related natural disasters in High Mountain Areas.
The link of this research:
Follow the Topic
-
Scientific Data
A peer-reviewed, open-access journal for descriptions of datasets, and research that advances the sharing and reuse of scientific data.

What are SDG Topics?
An introduction to Sustainable Development Goals (SDGs) Topics and their role in highlighting sustainable development research.
Continue reading announcementRelated Collections
With Collections, you can get published faster and increase your visibility.
Computer vision in plant science and agriculture
Publishing Model: Open Access
Deadline: Oct 10, 2026
Wearable and Computer Vision Data for Health and Behaviour Research
Publishing Model: Open Access
Deadline: Aug 08, 2026


Please sign in or register for FREE
If you are a registered user on Research Communities by Springer Nature, please sign in