High-resolution maps of Antarctica reveal higher snowfall and surface melt than previously estimated
Published in Earth & Environment

Since the early 2000s, GRACE and GRACE-FO satellite missions monitor mass change of the Antarctic ice sheet (AIS) from space. They show a clear mass loss trend, that is expected to continue under future climate warming. Mass loss is concentrated in coastal West Antarctica and results from increased ice discharge (D) across the ice sheet grounding line (blue contour in Fig. 1), where land ice transitions into floating ice shelves. Satellites also detect large year-to-year mass fluctuations, that are driven by the ice sheet surface mass balance (SMB), i.e., the difference between mass gained from snowfall, and mass lost from sublimation and meltwater runoff to the ocean.
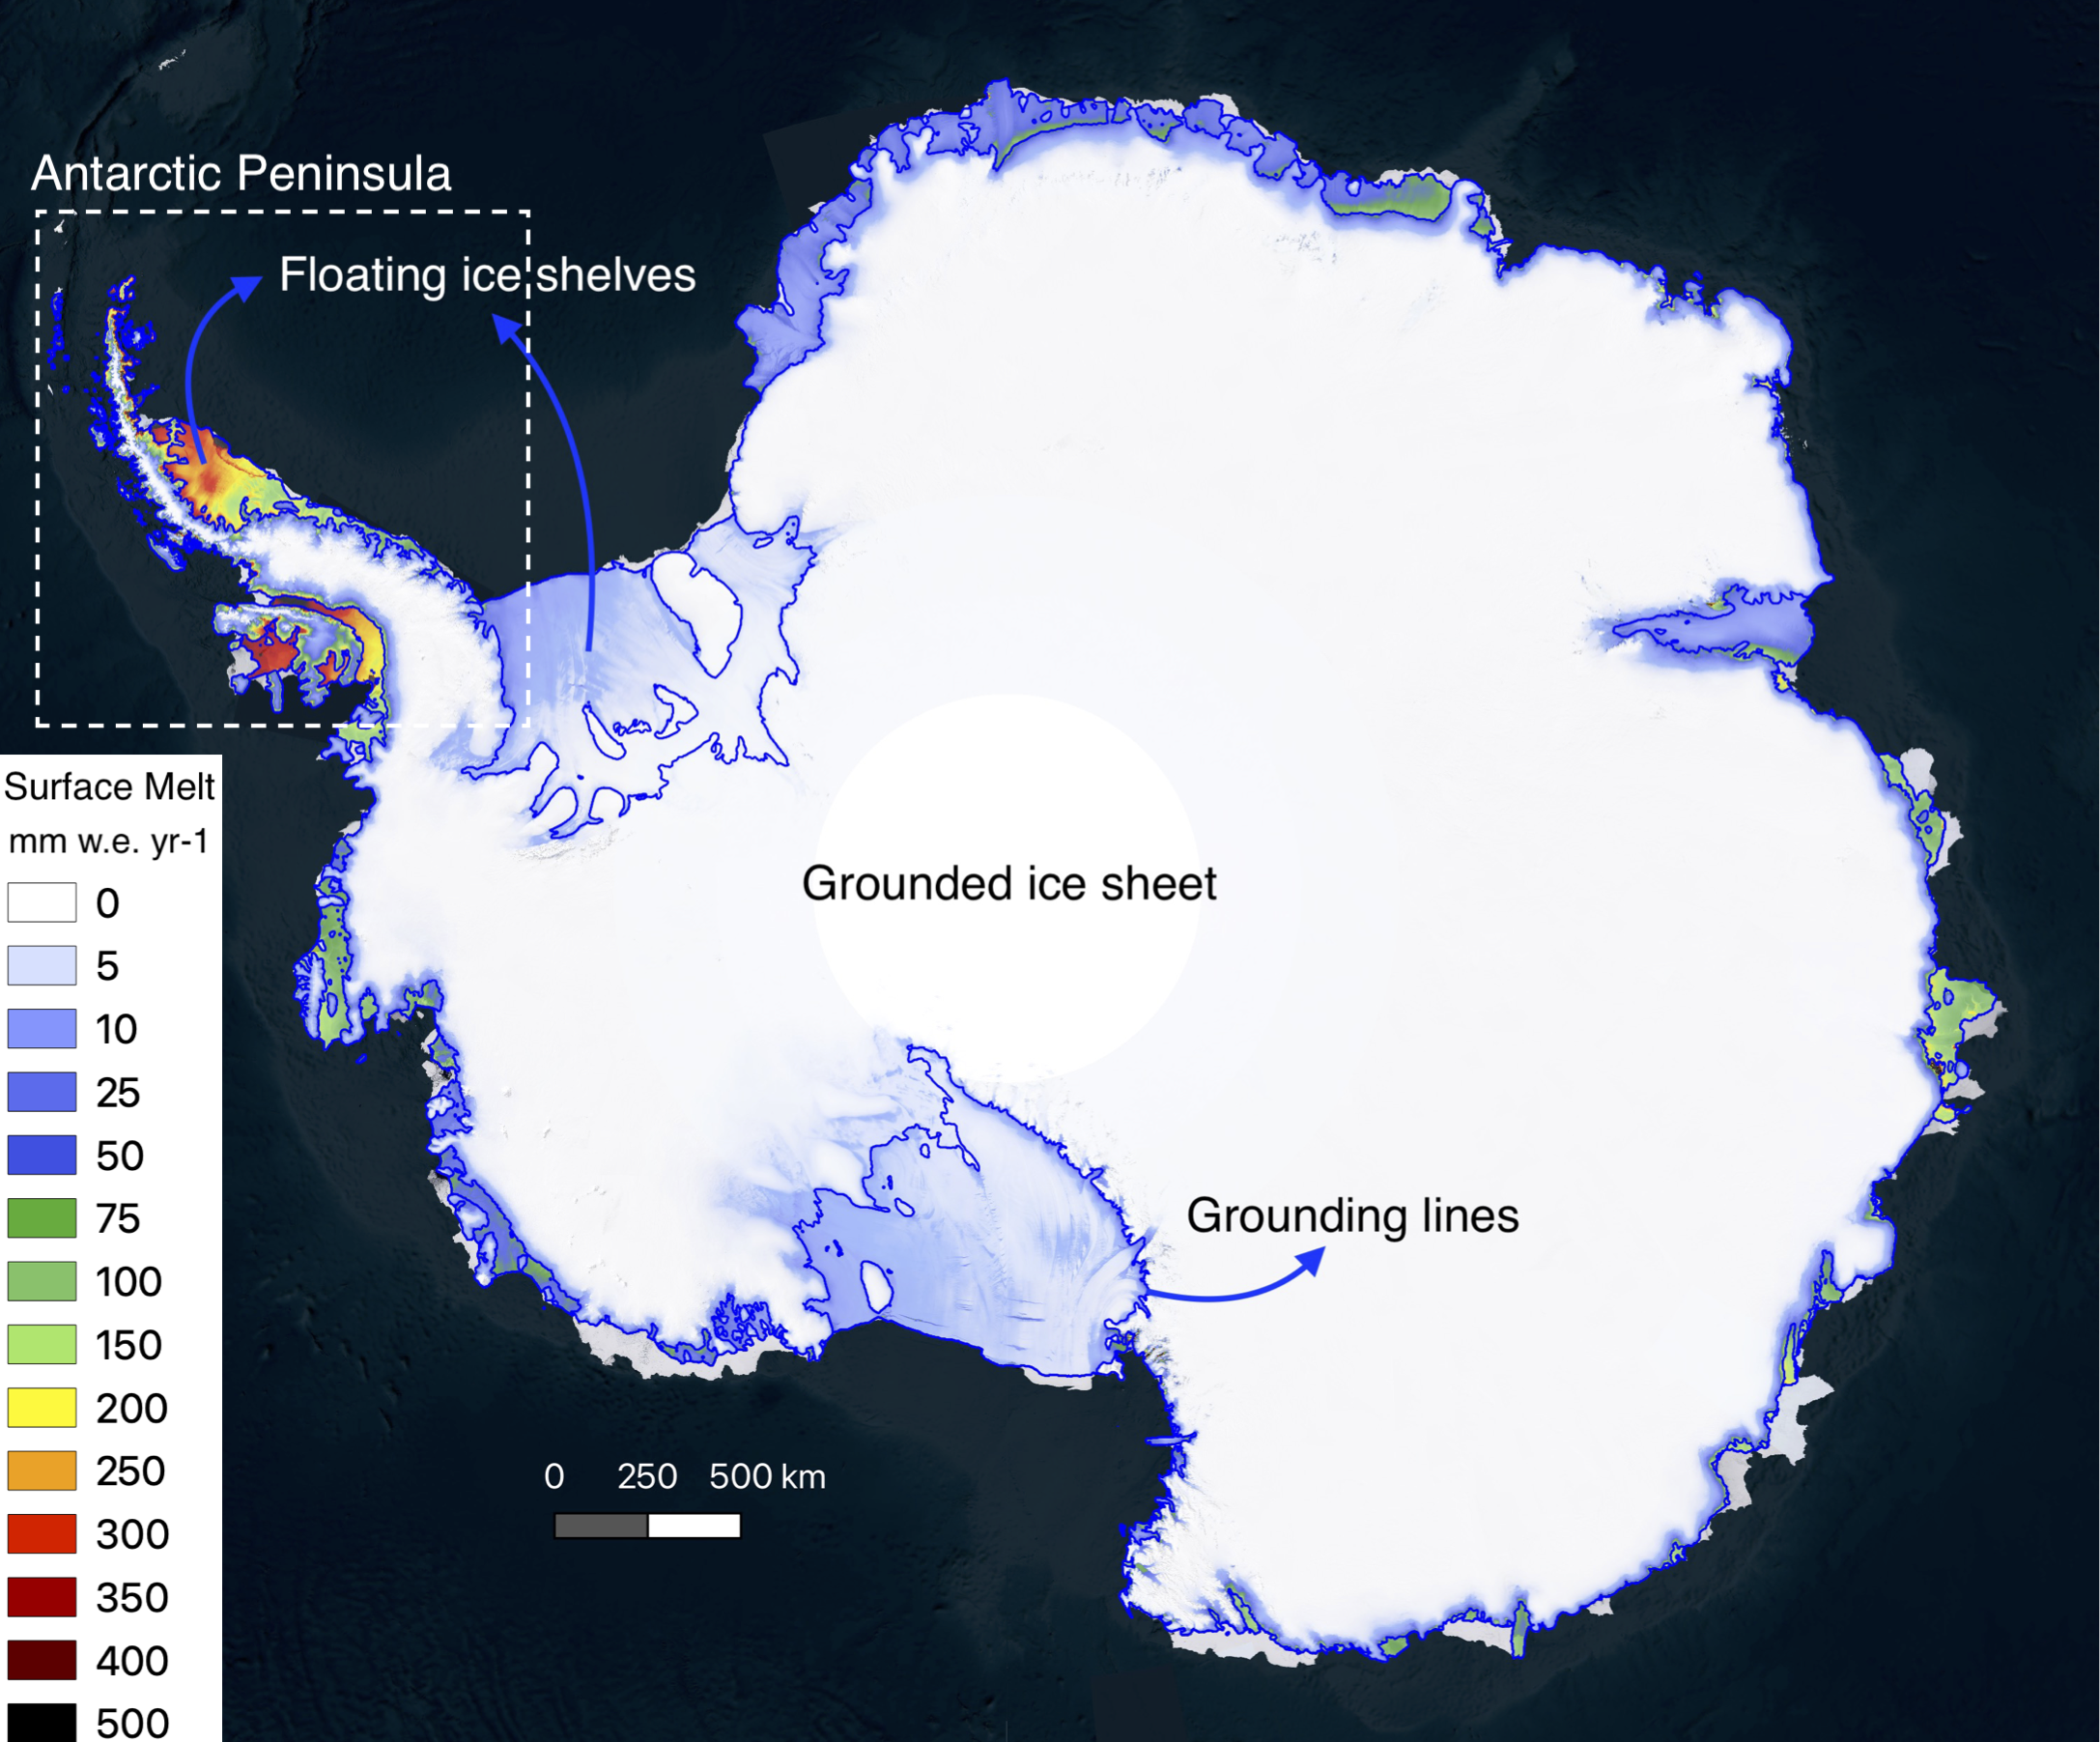
Figure 1: Map of annual surface melt over the whole of Antarctica at 2 km spatial resolution (1979-2021). The Antarctic Peninsula is shown as dashed lines. Floating ice shelves and grounding lines are shown as blue contours.
Although most meltwater refreezes in the cold Antarctic snow, thus not significantly contributing to mass loss, floating ice shelves are vulnerable to surface melt (Fig. 1). The reason is that meltwater can trigger a destructive mechanism called hydrofracturing, i.e., when meltwater fills pre-existing crevasses and pushes them further open. When ice shelves break up, this reduces the buttressing effect on the grounded ice sheet, further enhancing mass loss.
Surface processes are therefore very important to understand and predict ice sheet mass change. However, our knowledge of these processes largely relies on climate models that typically run at 25-100 km spatial resolution (Fig. 2A-B), too coarse to capture mountain ranges of e.g., the Antarctic Peninsula, or the steep ice sheet grounding lines. To address this, we present a statistical downscaling procedure that refines a low-resolution regional climate model at 27 km to a high-resolution 2 km grid, resolving rugged terrains in much greater detail (Fig. 2C).

Figure 2: Surface elevation from A the global climate model CESM2 at ~100 km spatial resolution, B the regional climate model RACMO2.3p2 at 27 km, and C the digital elevation model REMA at 2 km used in the statistical downscaling procedure.
The downscaling procedure enhances orographic snowfall over steep mountain ranges, that were spatially smoothed in the low-resolution climate model (Fig. 2B-C). This pattern is clearly visible over the Antarctic Peninsula (Fig. 3).
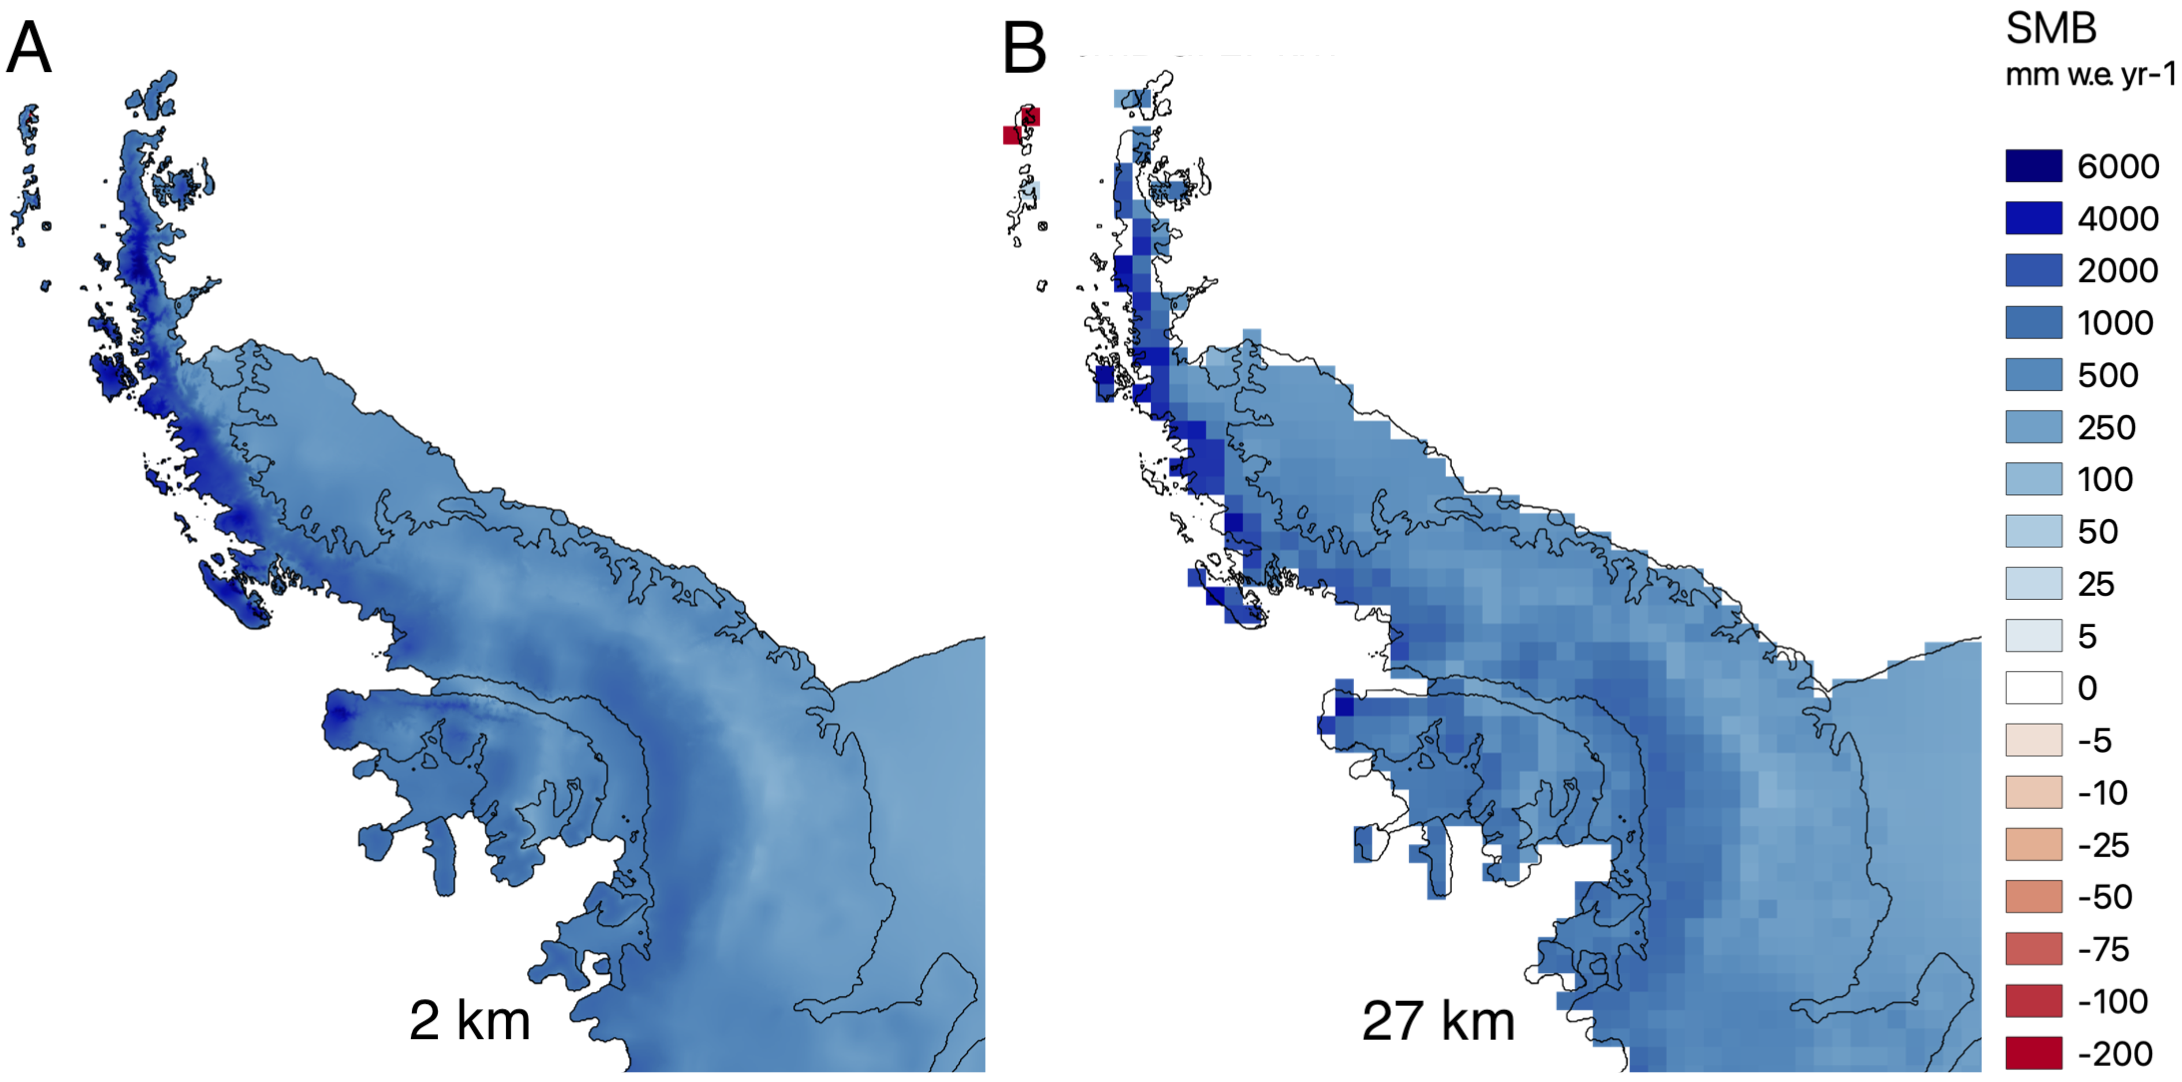
When integrated over the grounded ice sheet, snowfall and thus the surface mass balance (SMB) increase by 2%, sufficient to reconcile satellite-observed mass change (MB = SMB - D) from GRACE and GRACE-FO sensors (Fig. 4).
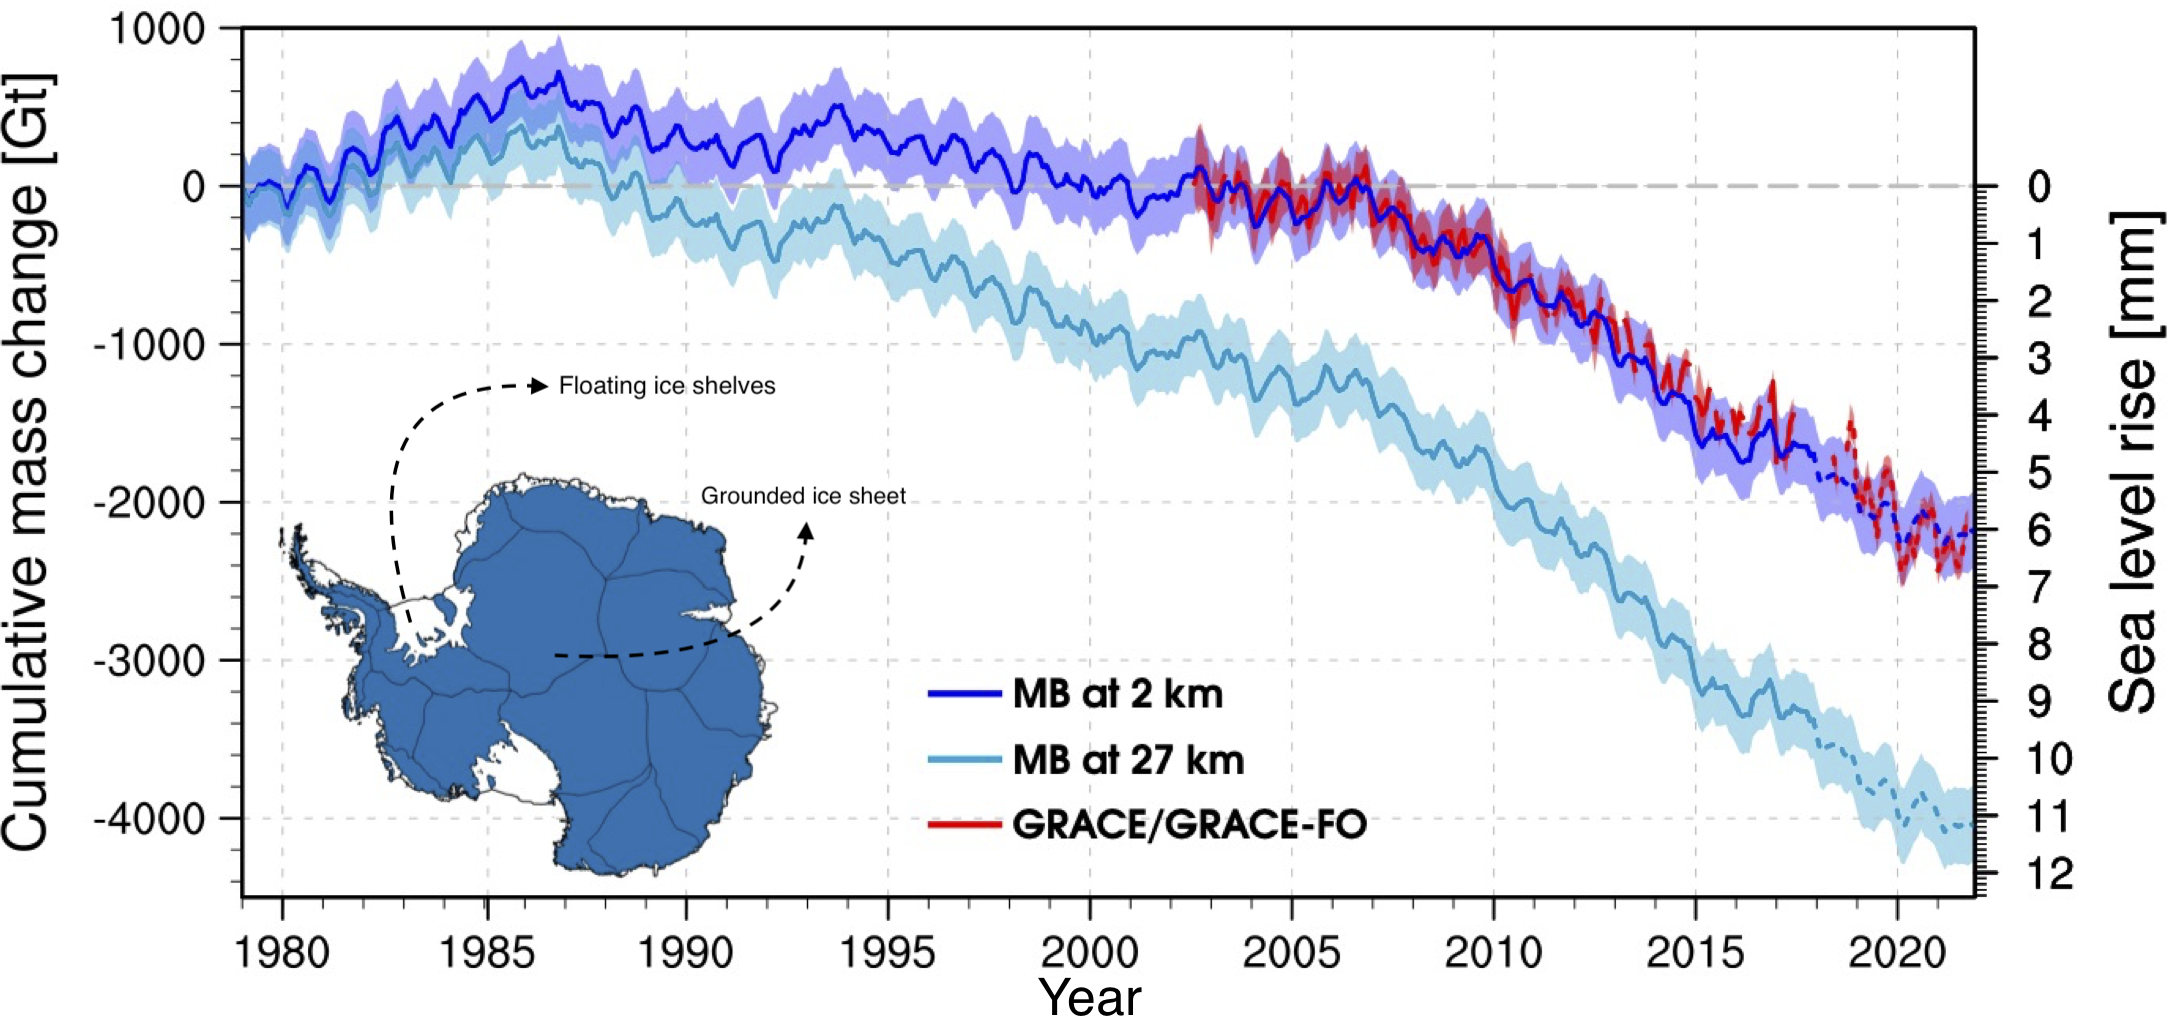
Figure 4: Time series of grounded Antarctic ice sheet (AIS) mass change. Mass change (MB) is estimated as the difference between surface mass balance (SMB) from the downscaled product at 2 km (dark blue) or RACMO2.3p2 at 27 km (light blue) and ice discharge (D) from Rignot et al. (2019). Satellite-observed mass change (GRACE/GRACE-FO sensors) is shown in red. Mass change is converted to sea level rise equivalent on the right y-axis.
The downscaling procedure also increases surface melt by no less than 46%, notably near grounding lines that were not well resolved at low resolution (Fig. 1). This is clearly visible across the grounding line of Larsen C ice shelf fringing the Antarctic Peninsula (Fig. 5).
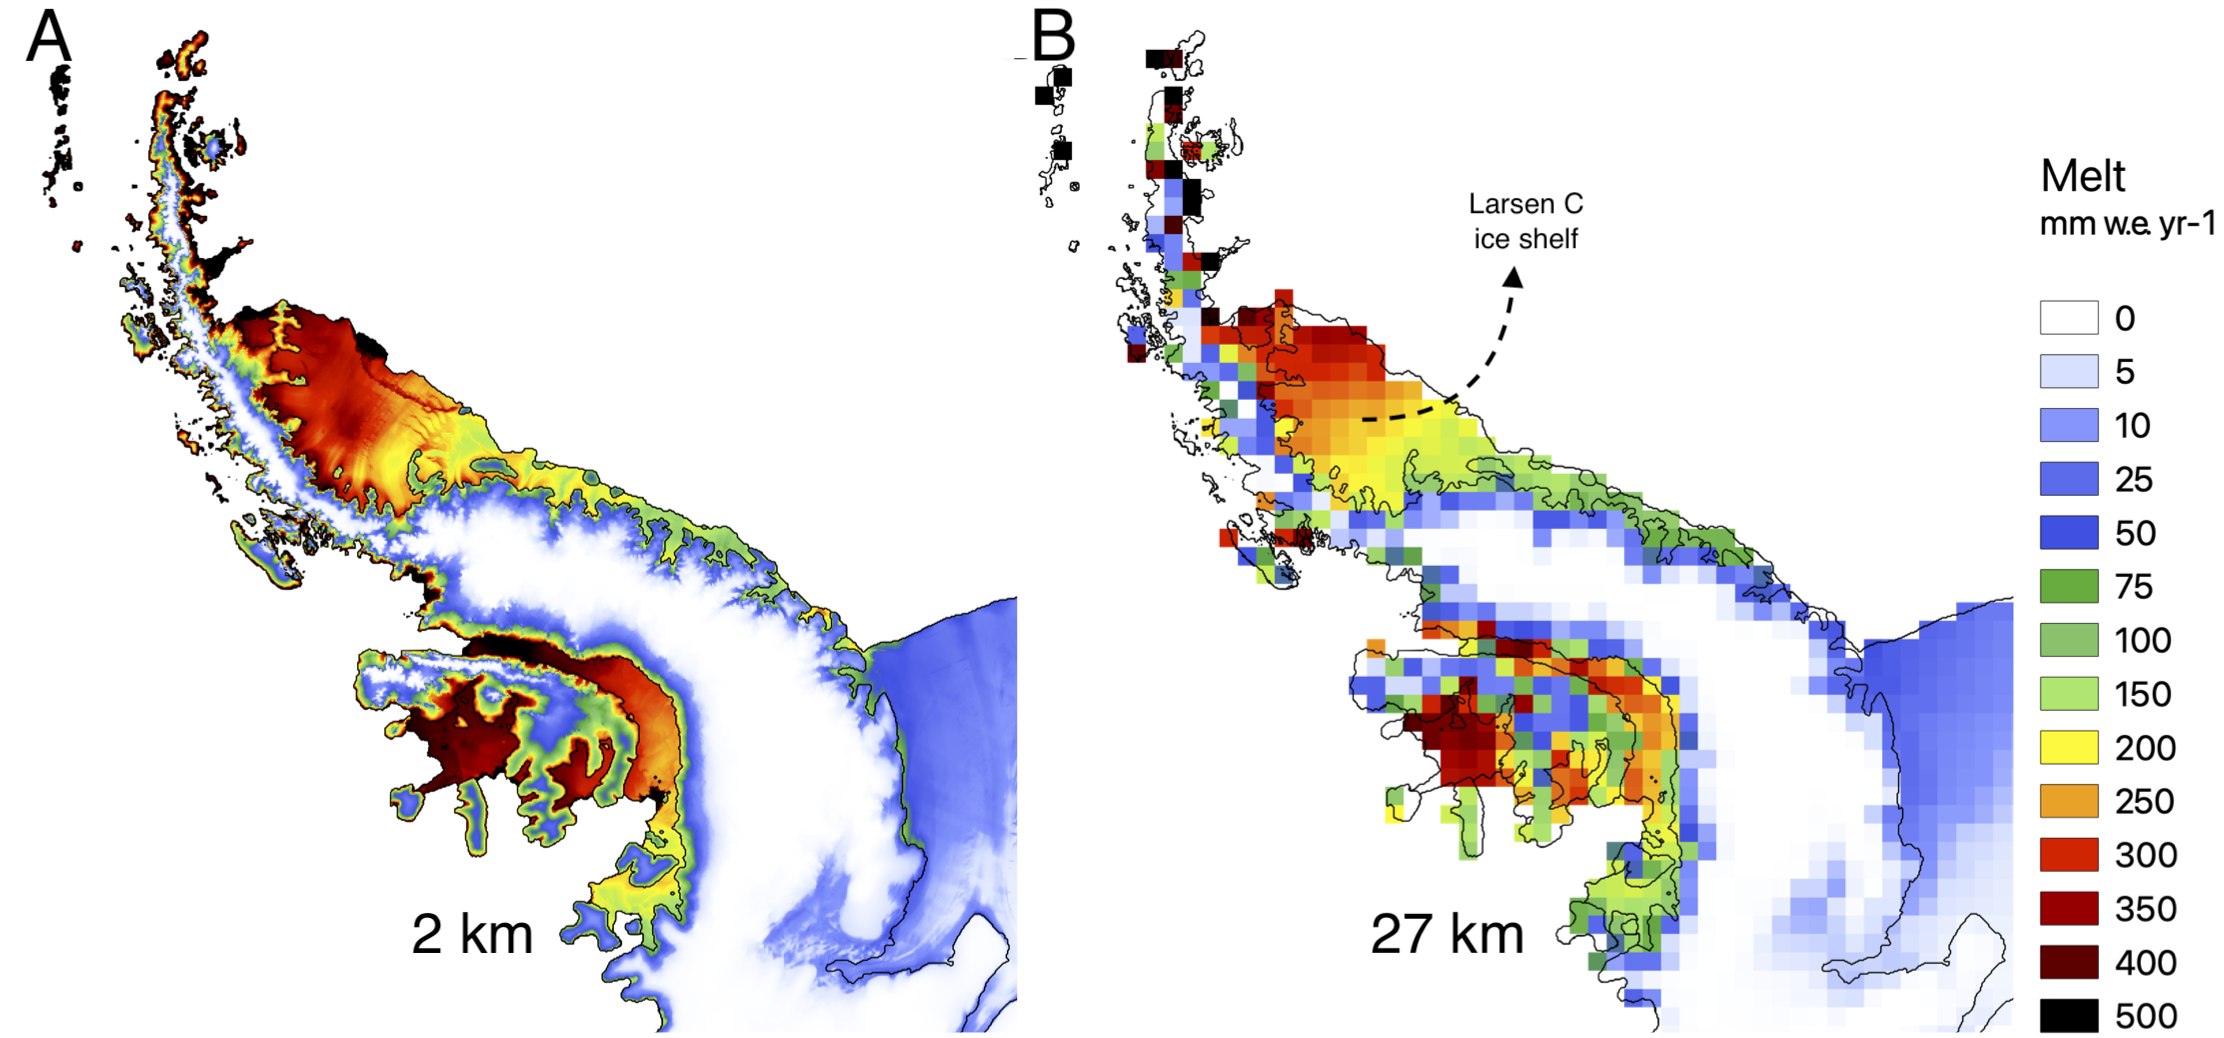
Figure 5: Maps of annual surface melt over the Antarctic Peninsula (1979-2021) in A the statistically downscaled product at 2 km, B RACMO2.3p2 at 27 km.
We applied statistical downscaling to model runs until 2100 using climate projections from the global climate model CESM2 (Fig. 3A) under a low-end, moderate and high-end warming scenario (Fig. 6). Our results show that the higher surface melt near grounding lines persists under all warming scenarios, further endangering the stability of vulnerable ice shelves.

Figure 6: Maps of annual surface melt over the whole of Antarctica (2090-2099) in the statistically downscaled product at 2 km under A a low-end (SSP1-2.6), B moderate (SSP2-4.5), and C high-end (SSP5-8.5) warming scenario.
Our study highlights the importance of capturing snowfall and surface melt with high spatial detail to yield reliable estimates of Antarctic ice sheet mass change. Until models can be run at such high resolutions, statistical downscaling is a powerful tool to better resolve and understand these surface processes.
Follow the Topic
-
Nature Communications

An open access, multidisciplinary journal dedicated to publishing high-quality research in all areas of the biological, health, physical, chemical and Earth sciences.
Related Collections
With Collections, you can get published faster and increase your visibility.
Women's Health
Publishing Model: Hybrid
Deadline: Ongoing
Advances in neurodegenerative diseases
Publishing Model: Hybrid
Deadline: Mar 24, 2026


Please sign in or register for FREE
If you are a registered user on Research Communities by Springer Nature, please sign in