How Vo’, a small village in the Paduan hills in Northern Italy, became the place that taught us about SARS-CoV-2 transmission, control and immunity
Published in Microbiology

Why Vo’?
Around the beginning of December 2019, the first cases of coronavirus disease 19 (COVID-19) were detected in Wuhan city, Hubei province (China).
Since then, the virus started spreading in different countries, with the first COVID-19-related death detected in Italy on 21st February 2020 in the municipality of Vo’, a small town near Venice, Italy (Figure 1). In response, mass swab testing was initiated, and the regional authorities declared the whole municipality under lockdown for 14 days. This is how Vo’ became the perfect place to study the transmission dynamics of SARS-CoV-2.
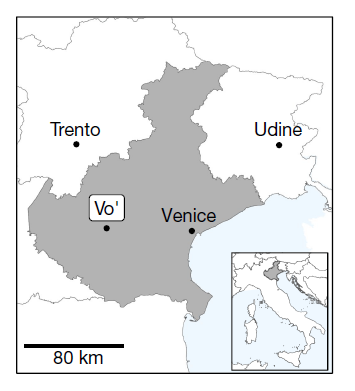
Fig.1. The study location. Vo’ is a small town of 3,275 inhabitants located in the province of Padua, Veneto region, Italy, approximately 50 km west from Venice. This is where we run four community-wide surveys to assess the impact of mass testing, lockdown, contact tracing and how immunity evolves in time.
What did we do?
- Detection of infection prevalence and assessment of the impact of lockdown
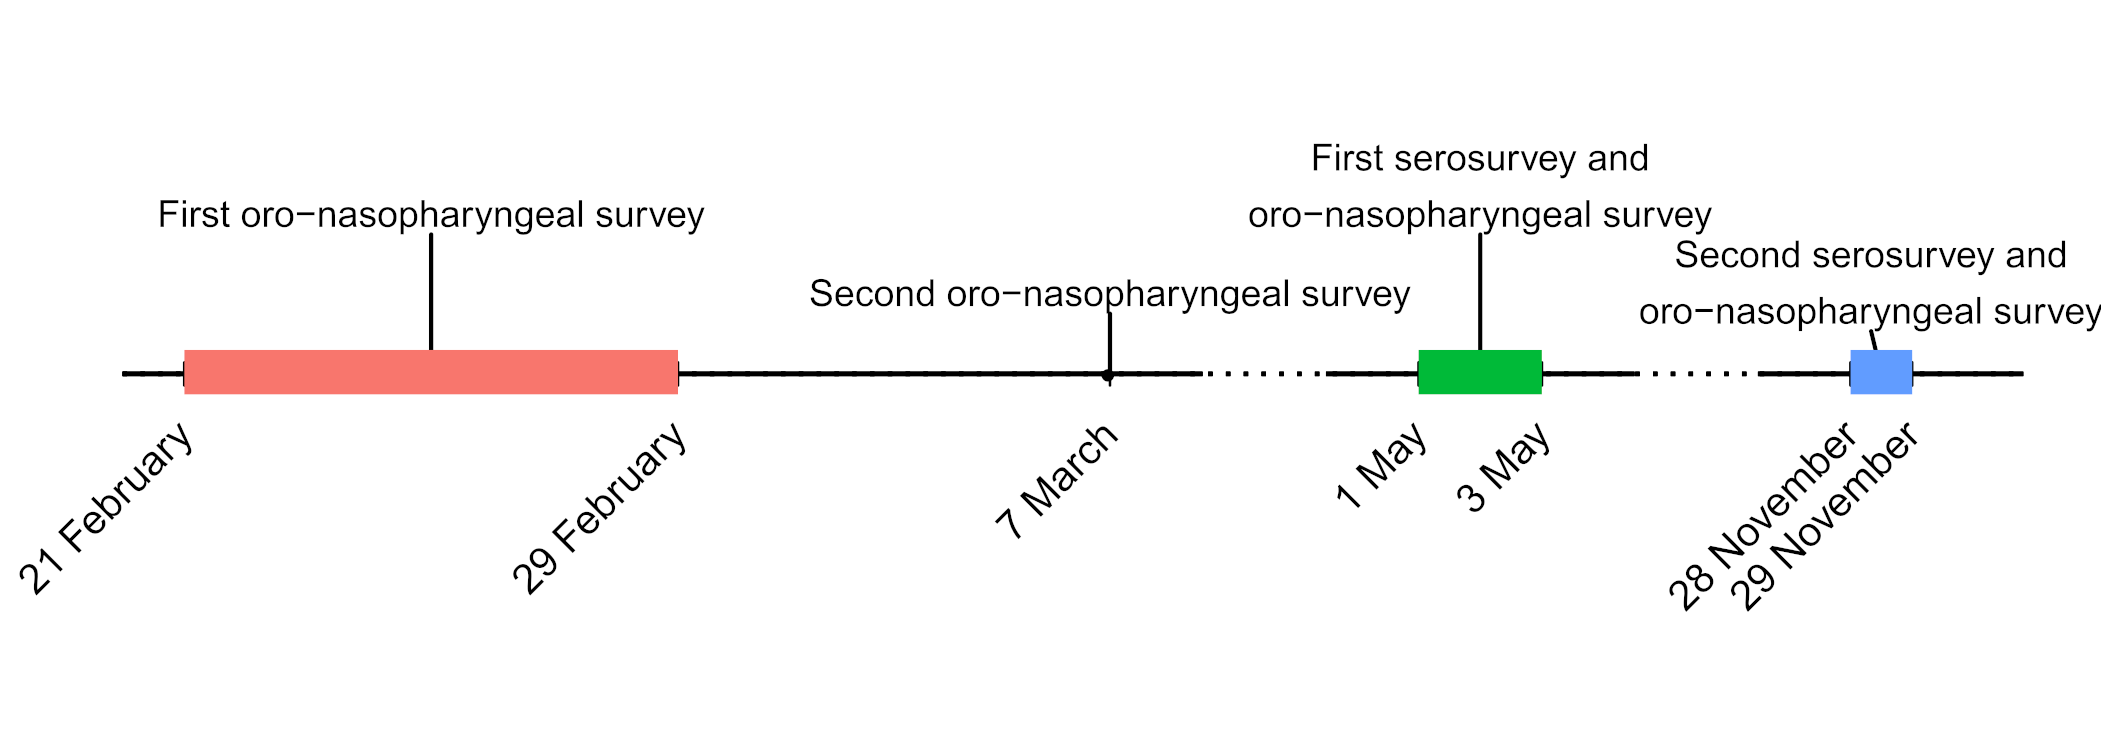
On the same day of the detection of SARS-CoV-2 in a deceased resident of Vo’ on 21st February 2020, we conducted an epidemiological study to investigate the prevalence of SARS-CoV-2 infection in the entire village. Oro-nasopharyngeal swab samples were collected at two consecutive time points (on 21-29 February and 7 March) from 86% and 72% of the population, respectively (Figure 2).
To better understand the mechanism, features and drivers of the infection, we also collected information on the demography, clinical presentation, hospitalization and contact network of the population.
The analysis of the swabs using RT-PCR, revealed a prevalence of the infection of 2.6% in the first time point, that decreased to 1.2% after the lockdown (second time point). Interestingly, of all infected individuals, 42.5% were asymptomatic, meaning that they did not report any symptom at the time of the swab test, nor afterwards.
A mathematical model allowed to estimate an overall prevalence of the infection of around 5%, which could have increased up to around 86% in the absence of the lockdown, thus highlighting the impact that mass testing and the lockdown had in controlling the epidemic.
- Variation of antibody levels over time, efficiency of contact tracing and within-household transmission
With the COVID-19 outbreak declared as a global pandemic by the World Health Organization (WHO) on March 11th 2020, it became pivotal to learn more about the ability of the immune system to develop antibodies and assess their levels and duration. This is why we conducted a second study, in the same population, using commercial immuno-assays detecting antibodies against the spike (S) and nucleocapsid (N) antigens as well as neutralisation assays . 78% of the Vo’ population took part in the study in May 2020, and 156 (6%) of the positive individuals were tested again in November 2020. Swab tests were also performed to detect new infections or potential re-infections.
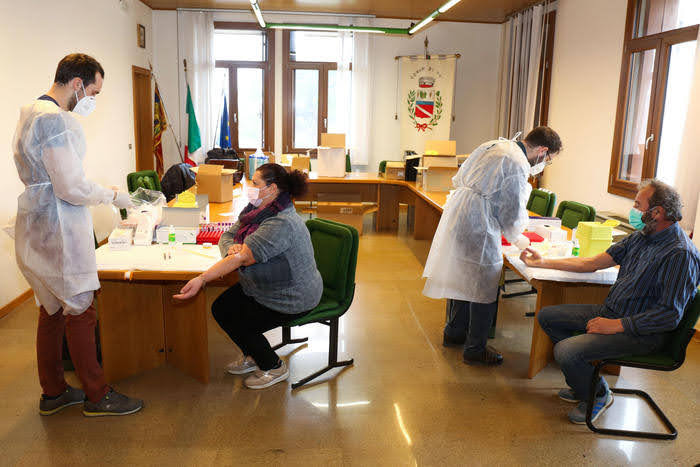
Fig.3. Blood draw was carried out in the council chamber of the town hall in Vo’, Italy. The “vadensi”, the inhabitants of Vo’, participated en-masse and with enthusiasm to the multiple rounds of testing, giving essential data for a better understanding of SARS-CoV-2 infection and transmission. The mayor, the local authorities, and the Italian Red Cross provided unreserved support throughout the study.
Where does transmission occur?
We developed a mathematical model to predict the chance of SARS-CoV-2 infection being caught by a household member, accounting for the probability of contracting the infection outside the household. We found that there were about 1 in 4 chances that SARS-CoV-2 transmission occurred within the household, and the probability of within-household transmission decreases with larger household sizes. Moreover, around 80% of transmission could be attributed to 20% of the infections, suggesting that a small number of infections act as super-spreaders while most infections generate no (or a small number) of new infections.
Would contact tracing have been sufficient as a containment strategy to limit the epidemic in Vo’?
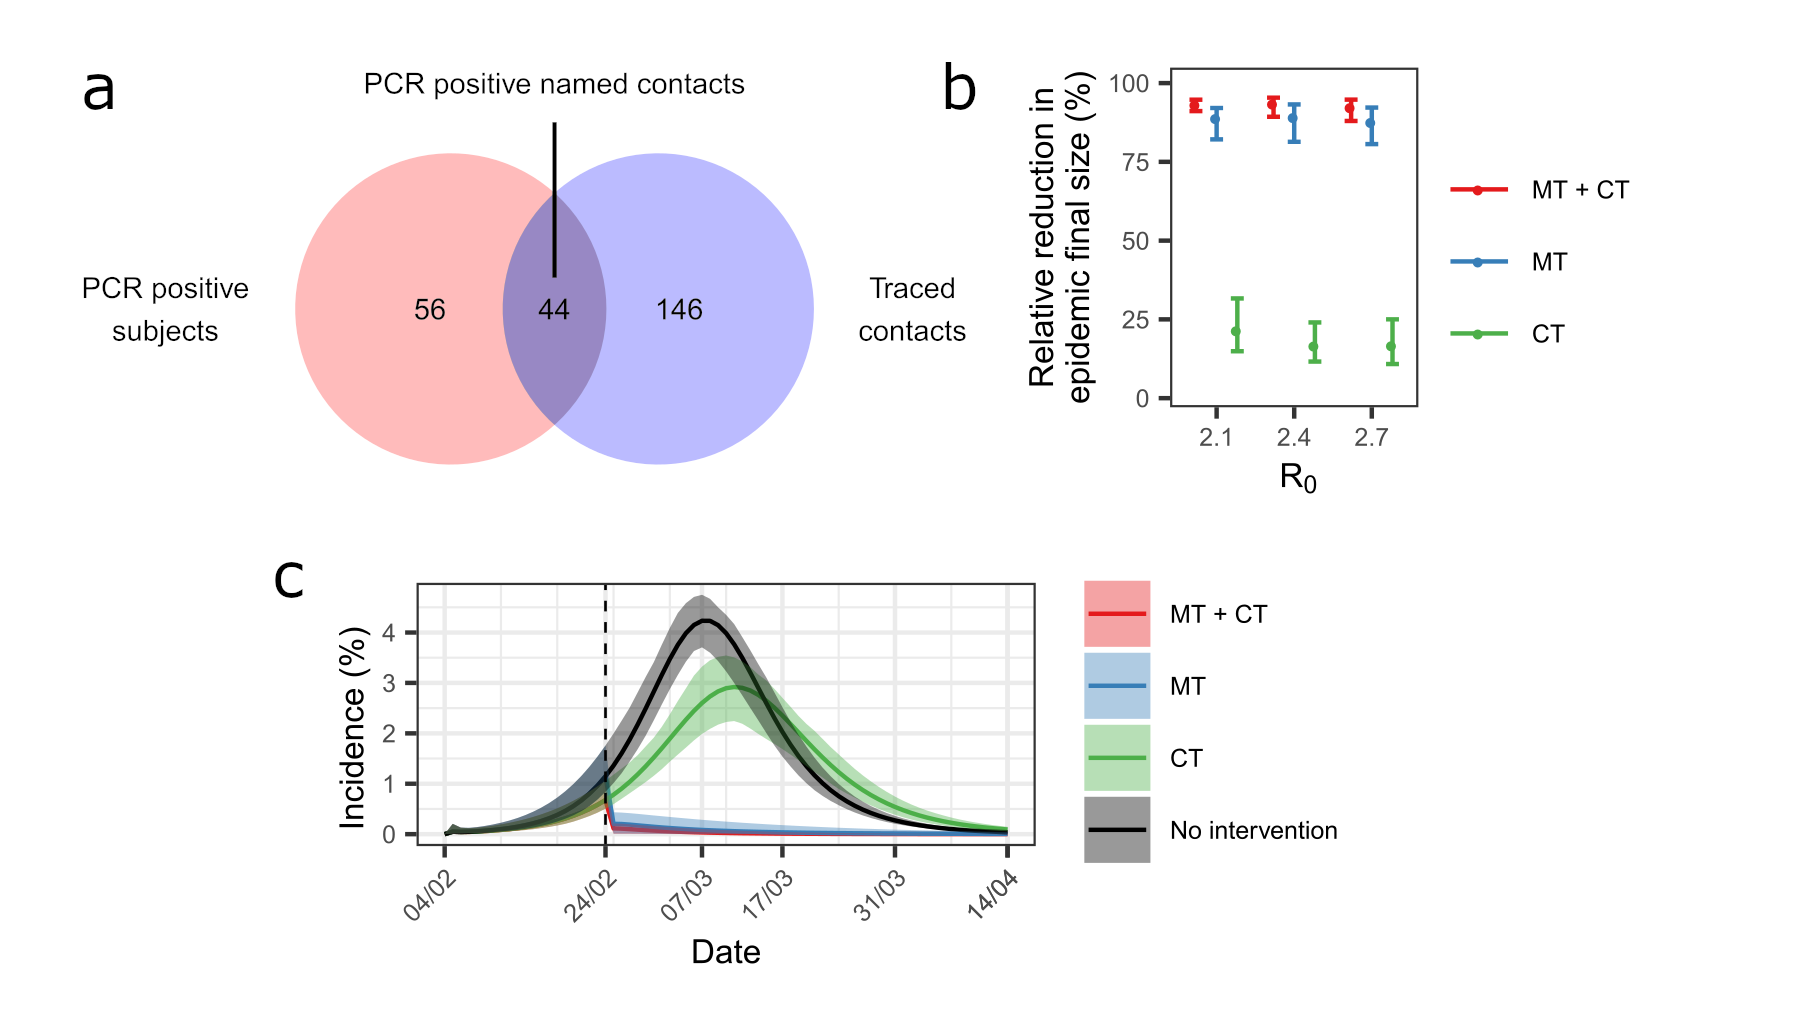
We linked the official contact tracing records compiled independently by the local health authorities with the dataset including the infected individuals identified in our surveys and estimated that 44% of the PCR positive subjects were detected by contact tracing while 23% of the traced subjects were PCR positive (Figure 4). We explored a counterfactual scenario – i.e., what would have happened to the epidemic dynamics in the absence of mass testing and lockdown and using contact tracing instead – and found that contact tracing would have had a limited impact of the epidemic final size. These results highlight the importance of mass testing and lockdown in controlling the epidemic.
What did we learn about antibody levels?
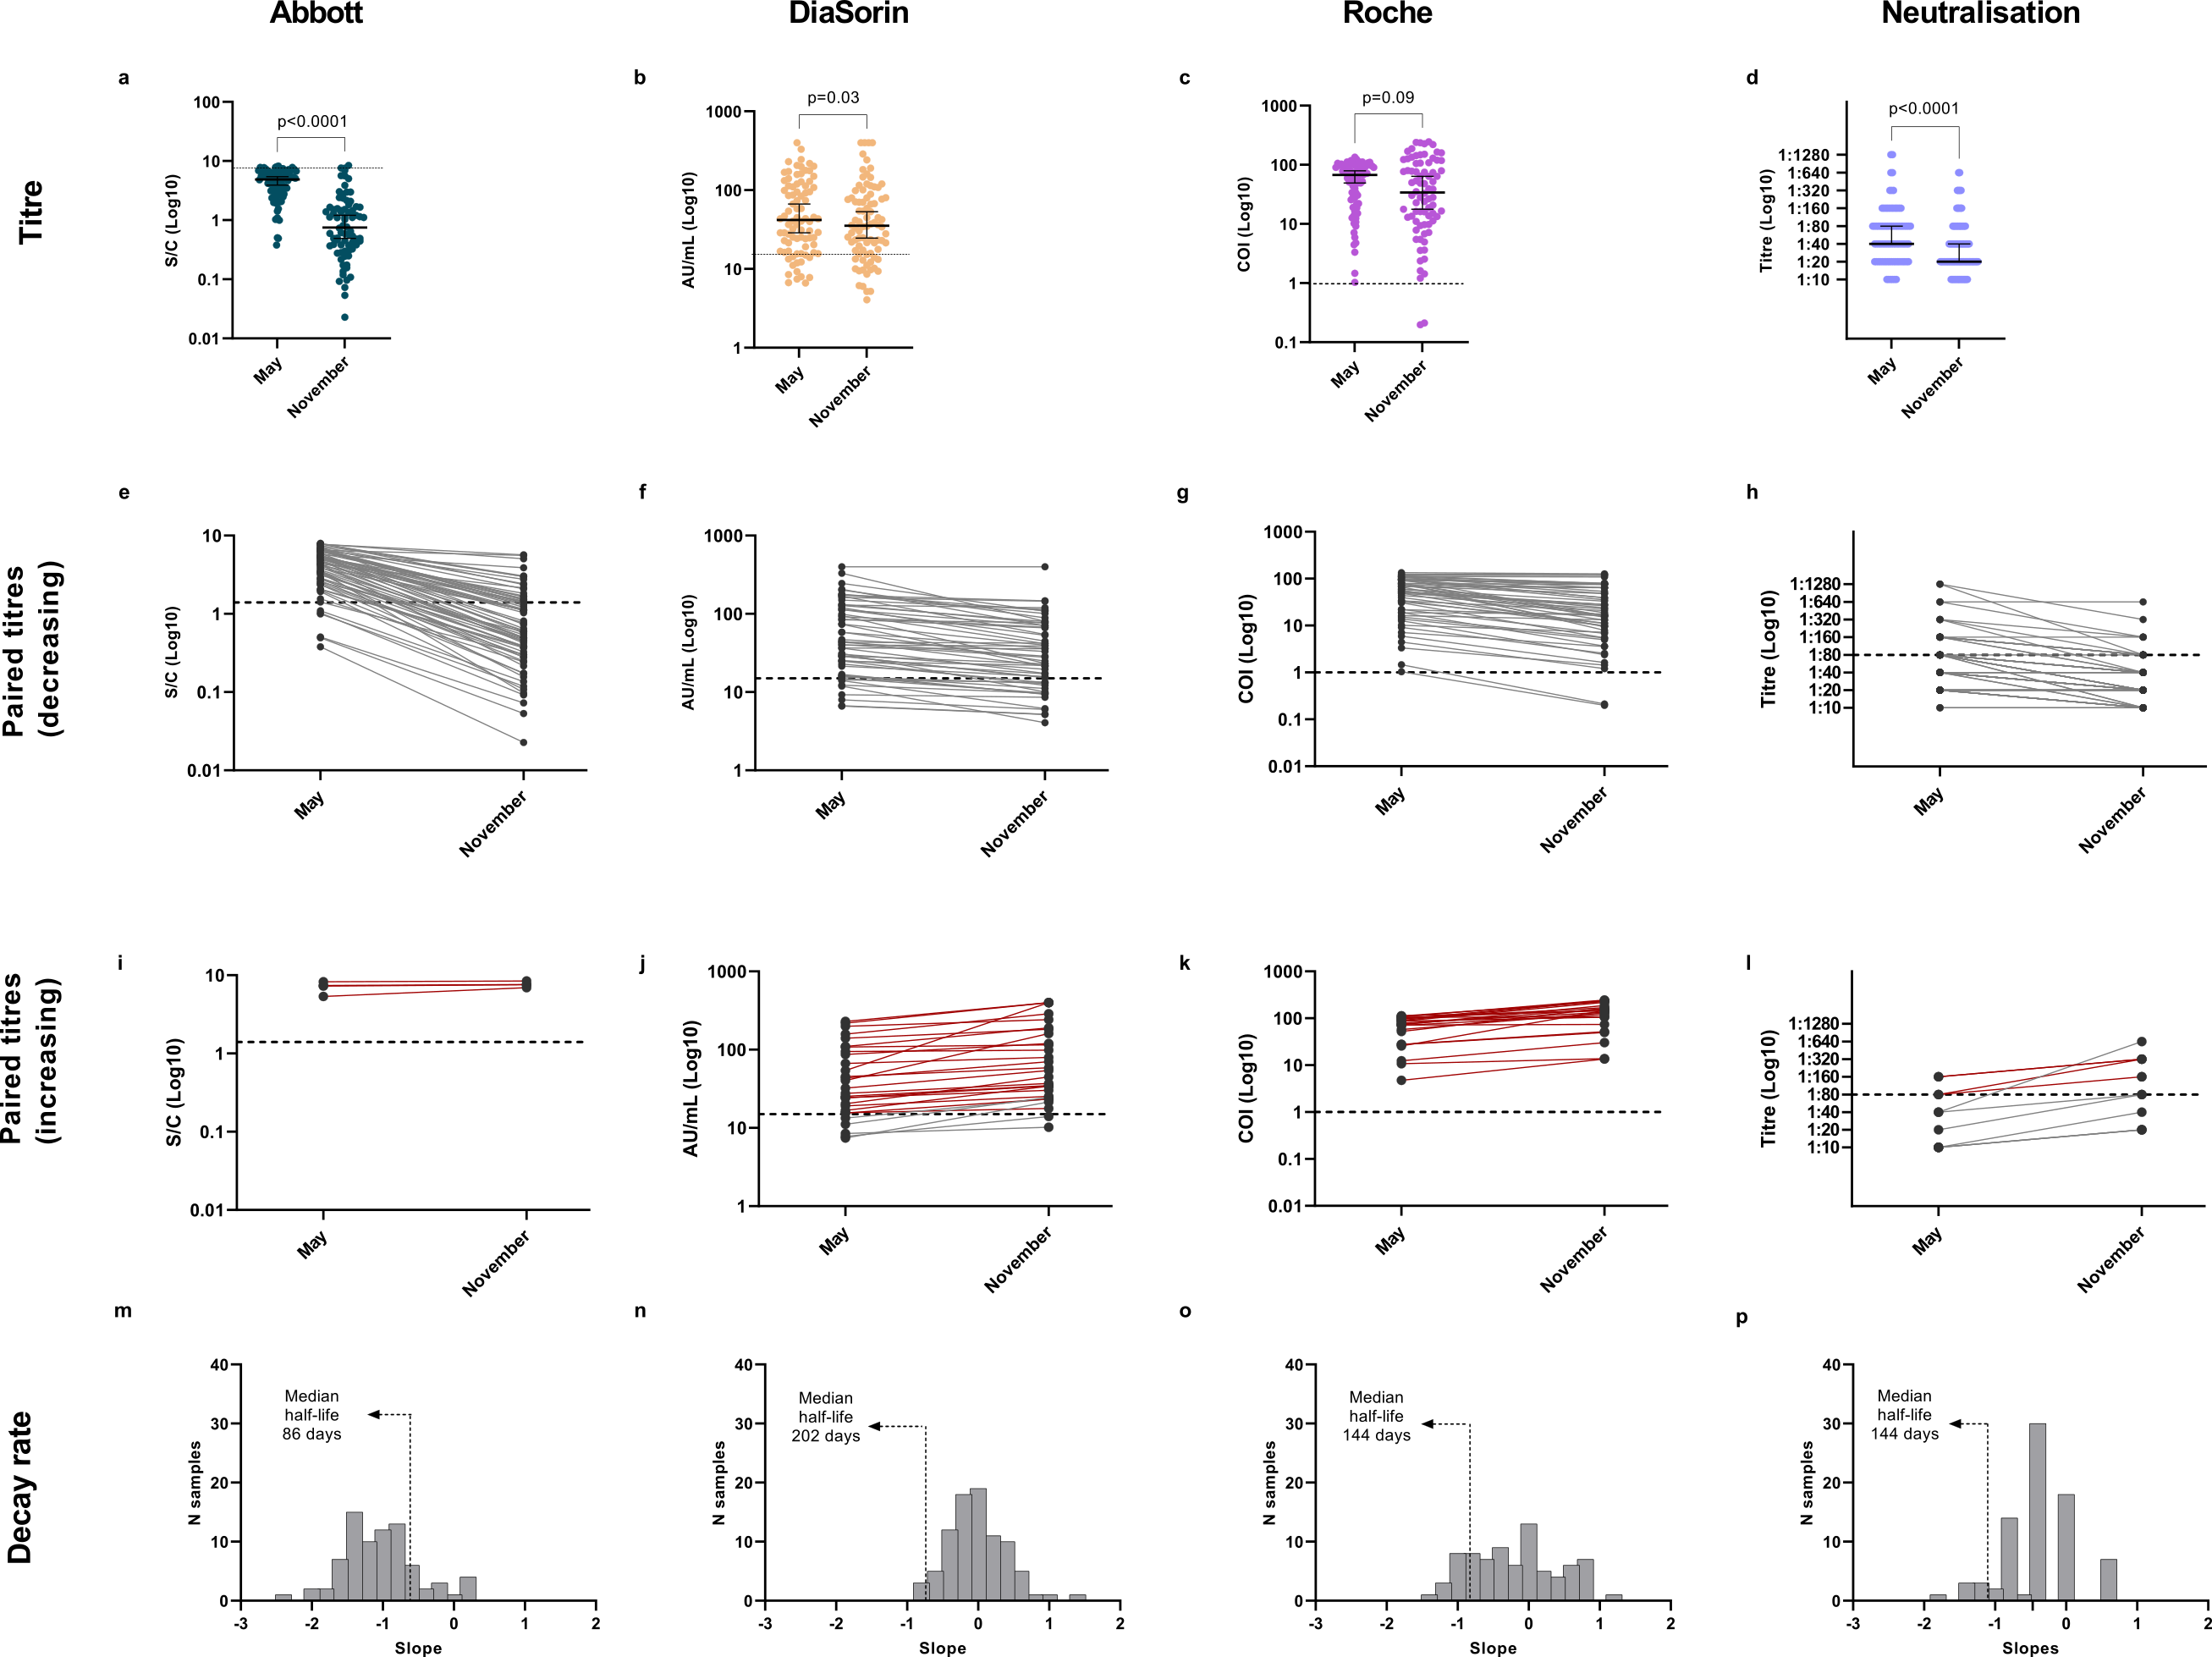
The use of different immune-assays on the same samples brought to light how individual-level discrepancies on assay results can lead to different seroprevalence estimates at the population level. We found a general decrease in antibodies and viral neutralisation between May and November, using all assays. Nevertheless, 98.8% of tested individuals were still positive to at least one serological assay in November, confirming the persistence of SARS-CoV-2 antibodies for at least 9 months. Moreover, a marked increase in antibodies or neutralisation titres could be observed in 18.6% of individuals (red lines Figure 5 (i-j)), associated with known or likely re-exposure to the virus. We found no association between antibody levels and disease severity, but we observed significant differences of antibody titres according to age group and BMI (Body Mass Index). By linking together the serological data collected with the different assays in May 2020, a prevalence of 3.5 % of SARS-CoV-2 infected individuals was estimated.
To learn more about our study, read the full article:
To be continued...
Since the persistence of anti-SARS-CoV-2 antibodies is still unknown, we are following-up this cohort with periodic serological screenings, the last one performed in early June 2021.
With the advent of vaccines and the concomitant emergence of new viral variants, more efforts are needed for evaluating the immune response to vaccines in naïve and previously exposed individuals, so stay tuned to learn more about the updates.
Follow the Topic
-
Nature Communications

An open access, multidisciplinary journal dedicated to publishing high-quality research in all areas of the biological, health, physical, chemical and Earth sciences.
Related Collections
With Collections, you can get published faster and increase your visibility.
Women's Health
Publishing Model: Hybrid
Deadline: Ongoing
Advances in neurodegenerative diseases
Publishing Model: Hybrid
Deadline: Mar 24, 2026


Please sign in or register for FREE
If you are a registered user on Research Communities by Springer Nature, please sign in