It Takes Patience to Measure Change
Published in Chemistry and Earth & Environment

Understanding how contaminants like mercury move and transform within the environment is essential for protecting human and ecosystem health. One of the primary pathways of human exposure to mercury is through seafood, where mercury accumulates in its most neurotoxic form: methylmercury. Our recent study, published in Communications Earth & Environment, analyzed four years of mercury measurements in seawater from Scripps Pier in La Jolla, CA, revealing important interannual and seasonal patterns that could only be detected through sustained, high-frequency monitoring. Yet work like this is increasingly at risk as long-term environmental monitoring programs across the United States face threats from shifting policies and federal funding cuts. In this post, we take you behind the scenes of our study to highlight why long-term monitoring isn’t just valuable; it’s essential for understanding and responding to environmental change.
It takes patience to see the full picture
Imagine trying to understand a 1,000-piece puzzle with only a handful of pieces. You might make guesses, but without more, the picture stays incomplete. Only as more pieces fall into place do the patterns emerge, the image sharpens, and the story begins to make sense.
That’s what it felt like when we began collecting water samples for mercury analysis at Scripps Pier.
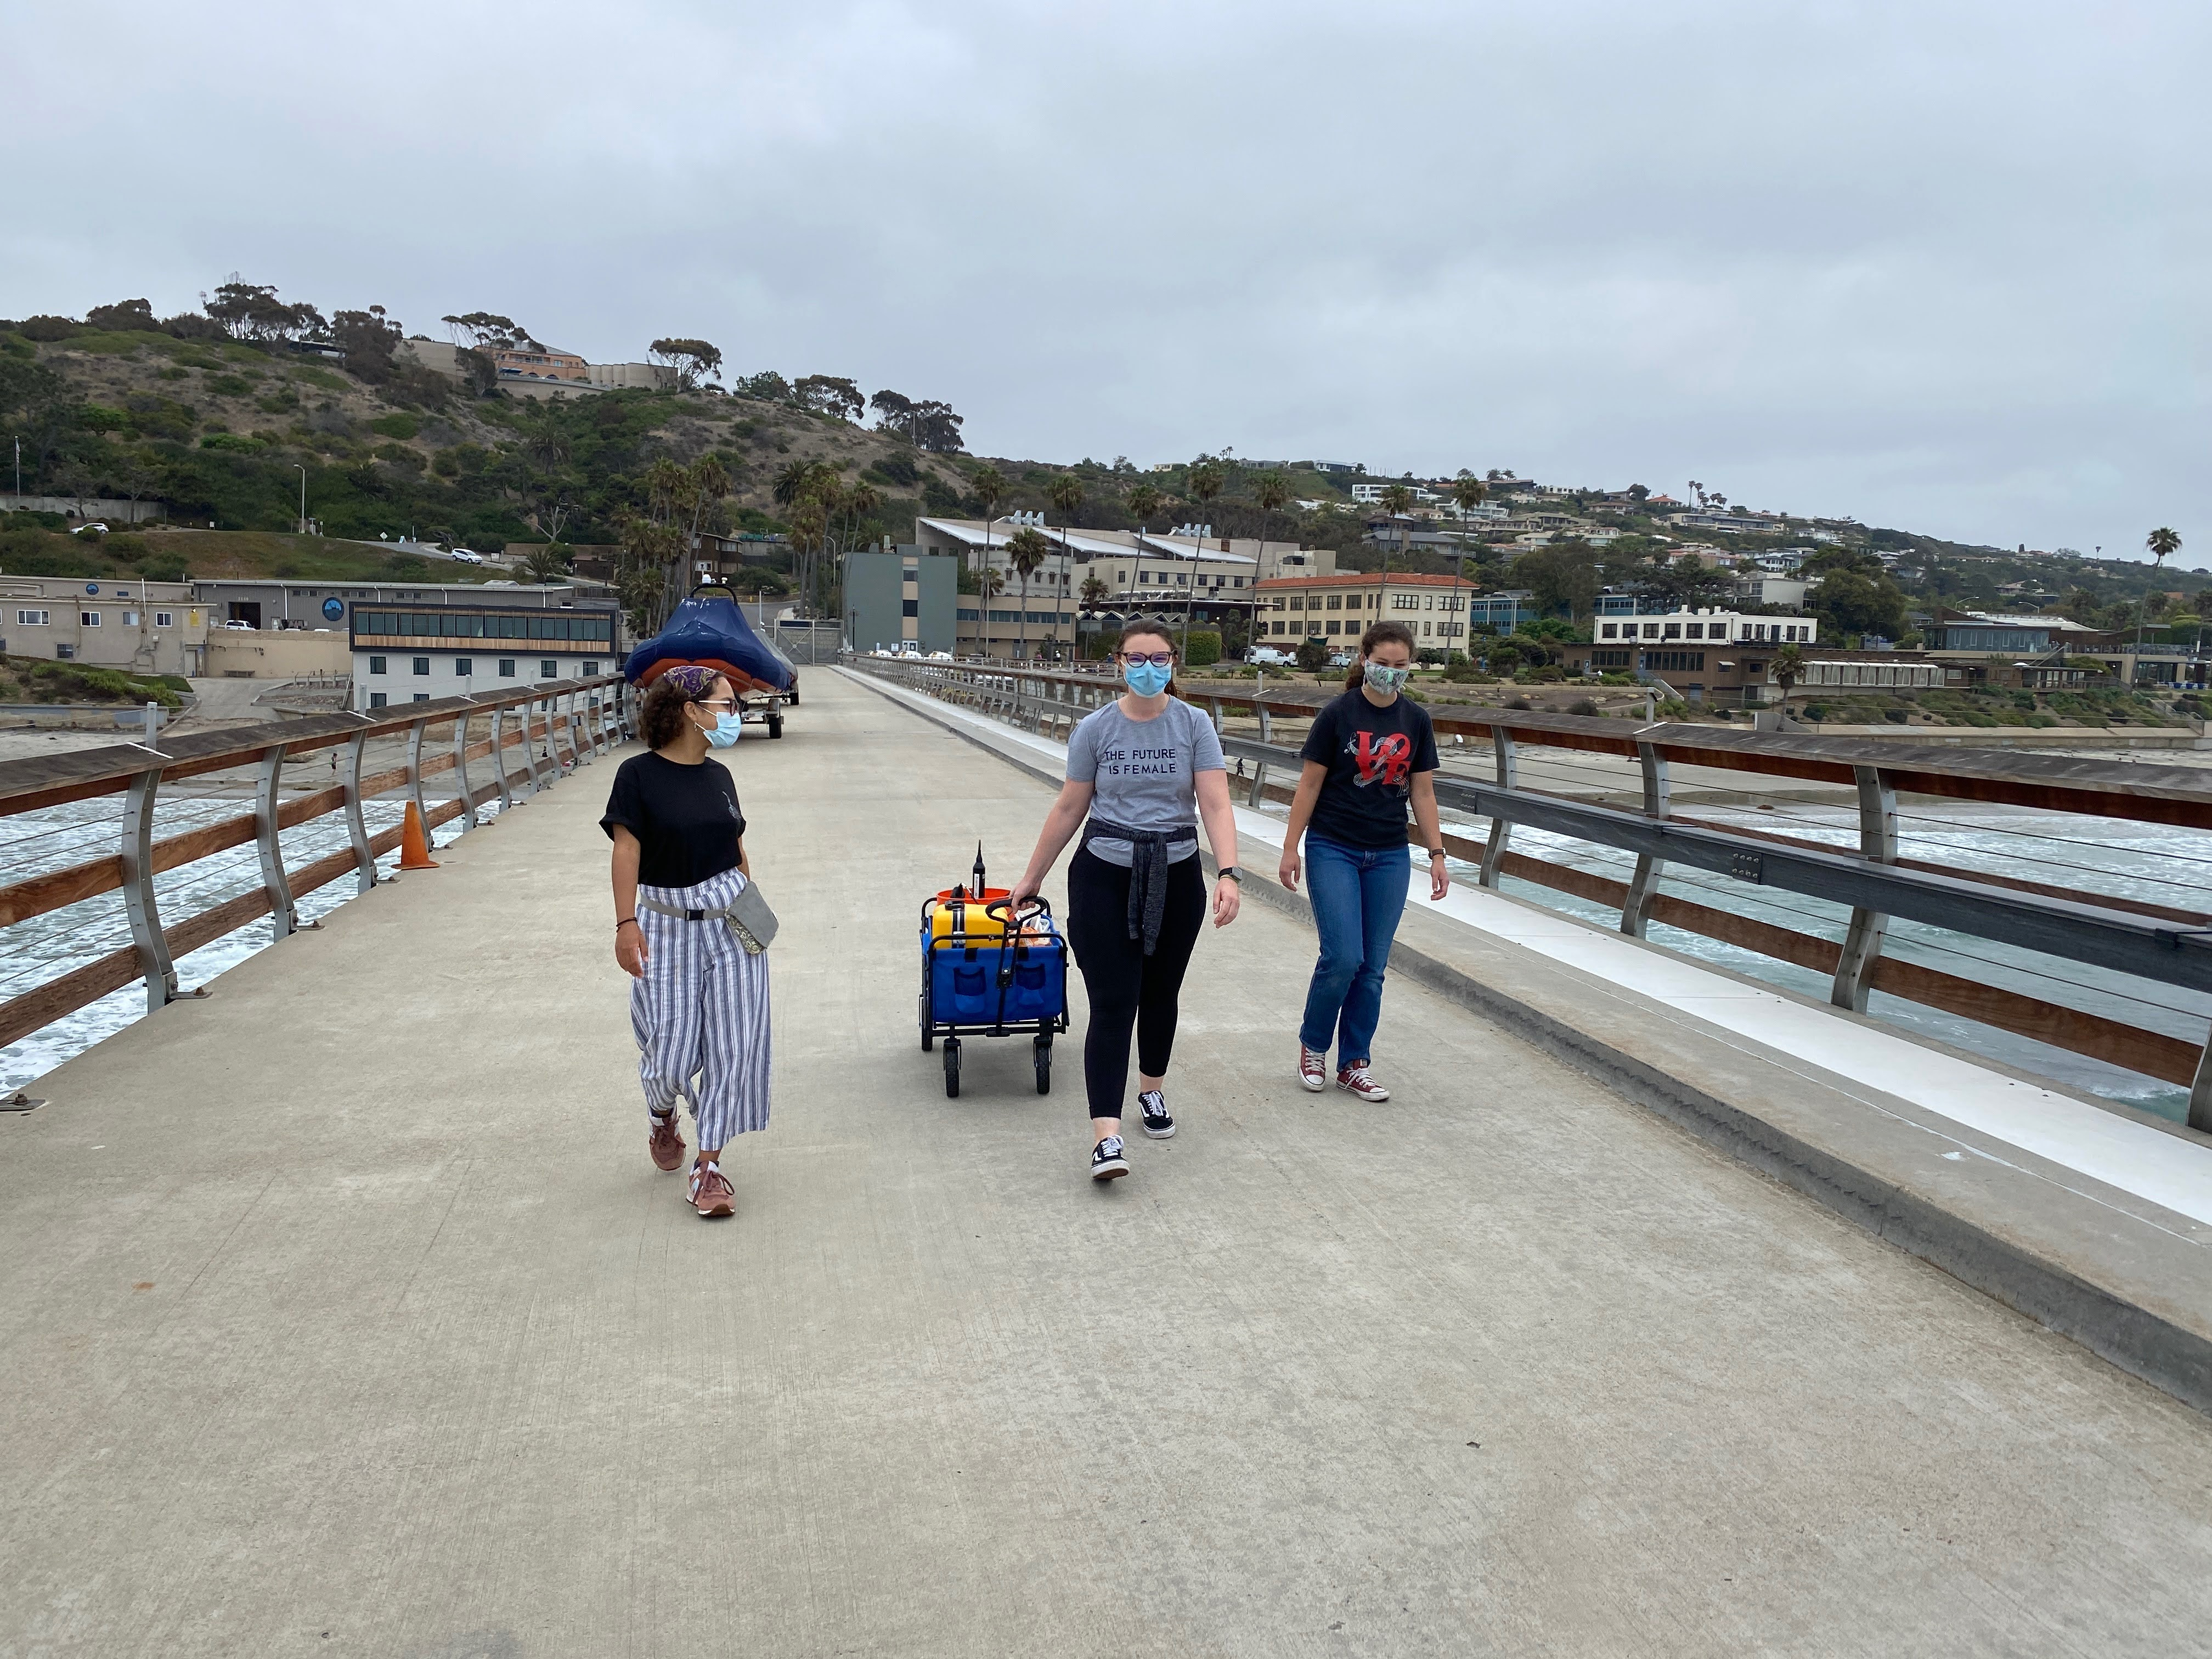
In the early years of weekly sampling, the data felt more like noise than signal. Concentrations seemed to go up and down with no clear logic. It was discouraging, but we stuck with it. Week after week, PhD student Hannah Adams wheeled her blue wagon down to the pier, battled through equipment hiccups, tides, and weather, and faithfully collected and preserved each data point. The effort was sustained and sometimes monotonous, but when we reached year three, a pattern finally emerged — mercury concentrations peaked and dropped in concert with environmental shifts we’d observed in the field. It was like watching a puzzle snap into place!
One step at a time, the picture comes into focus
When we first set out to investigate mercury dynamics in California’s coastal waters, we knew it would take time. Our goal was to build the first long-term marine mercury speciation time series in the region. With Scripps Pier, located just a few steps from our lab and embedded in a network of coastal monitoring efforts, such as the Southern California Coastal Ocean Observing System, it was an obvious place to begin. The sunny San Diego weather didn’t hurt either. Still, we knew that even with ideal conditions, building a dataset capable of revealing meaningful patterns would require years of consistent effort.
For Hannah Adams, who joined the Schartup Lab as a PhD student in 2020, this meant weaving weekly sampling into her life – rain or shine, battery issues or broken pier stairs, high tide or post-storm chaos. Over time, the routine became more than just a task; it became a relationship with the site itself. Hannah learned how subtle changes in ocean patterns, tidal cycles, ocean swells, or bloom cycles could disrupt the sampling or affect the composition of the water column. Through repetition, trial and error, she gained an understanding, a “feeling” for the site, that no spreadsheet could teach. For example, she learned that the ocean often remained too rough for sampling even a day after a storm or that you were more likely to encounter a sea lion in the spring and summer. There was something refreshingly old-school about this work, immersing oneself in the environment, observing closely, and letting patterns reveal themselves. In an era of computers, big data, fast results, and constant digital distraction, it was a reminder that sometimes understanding comes from simply being present and observing slow change over time.
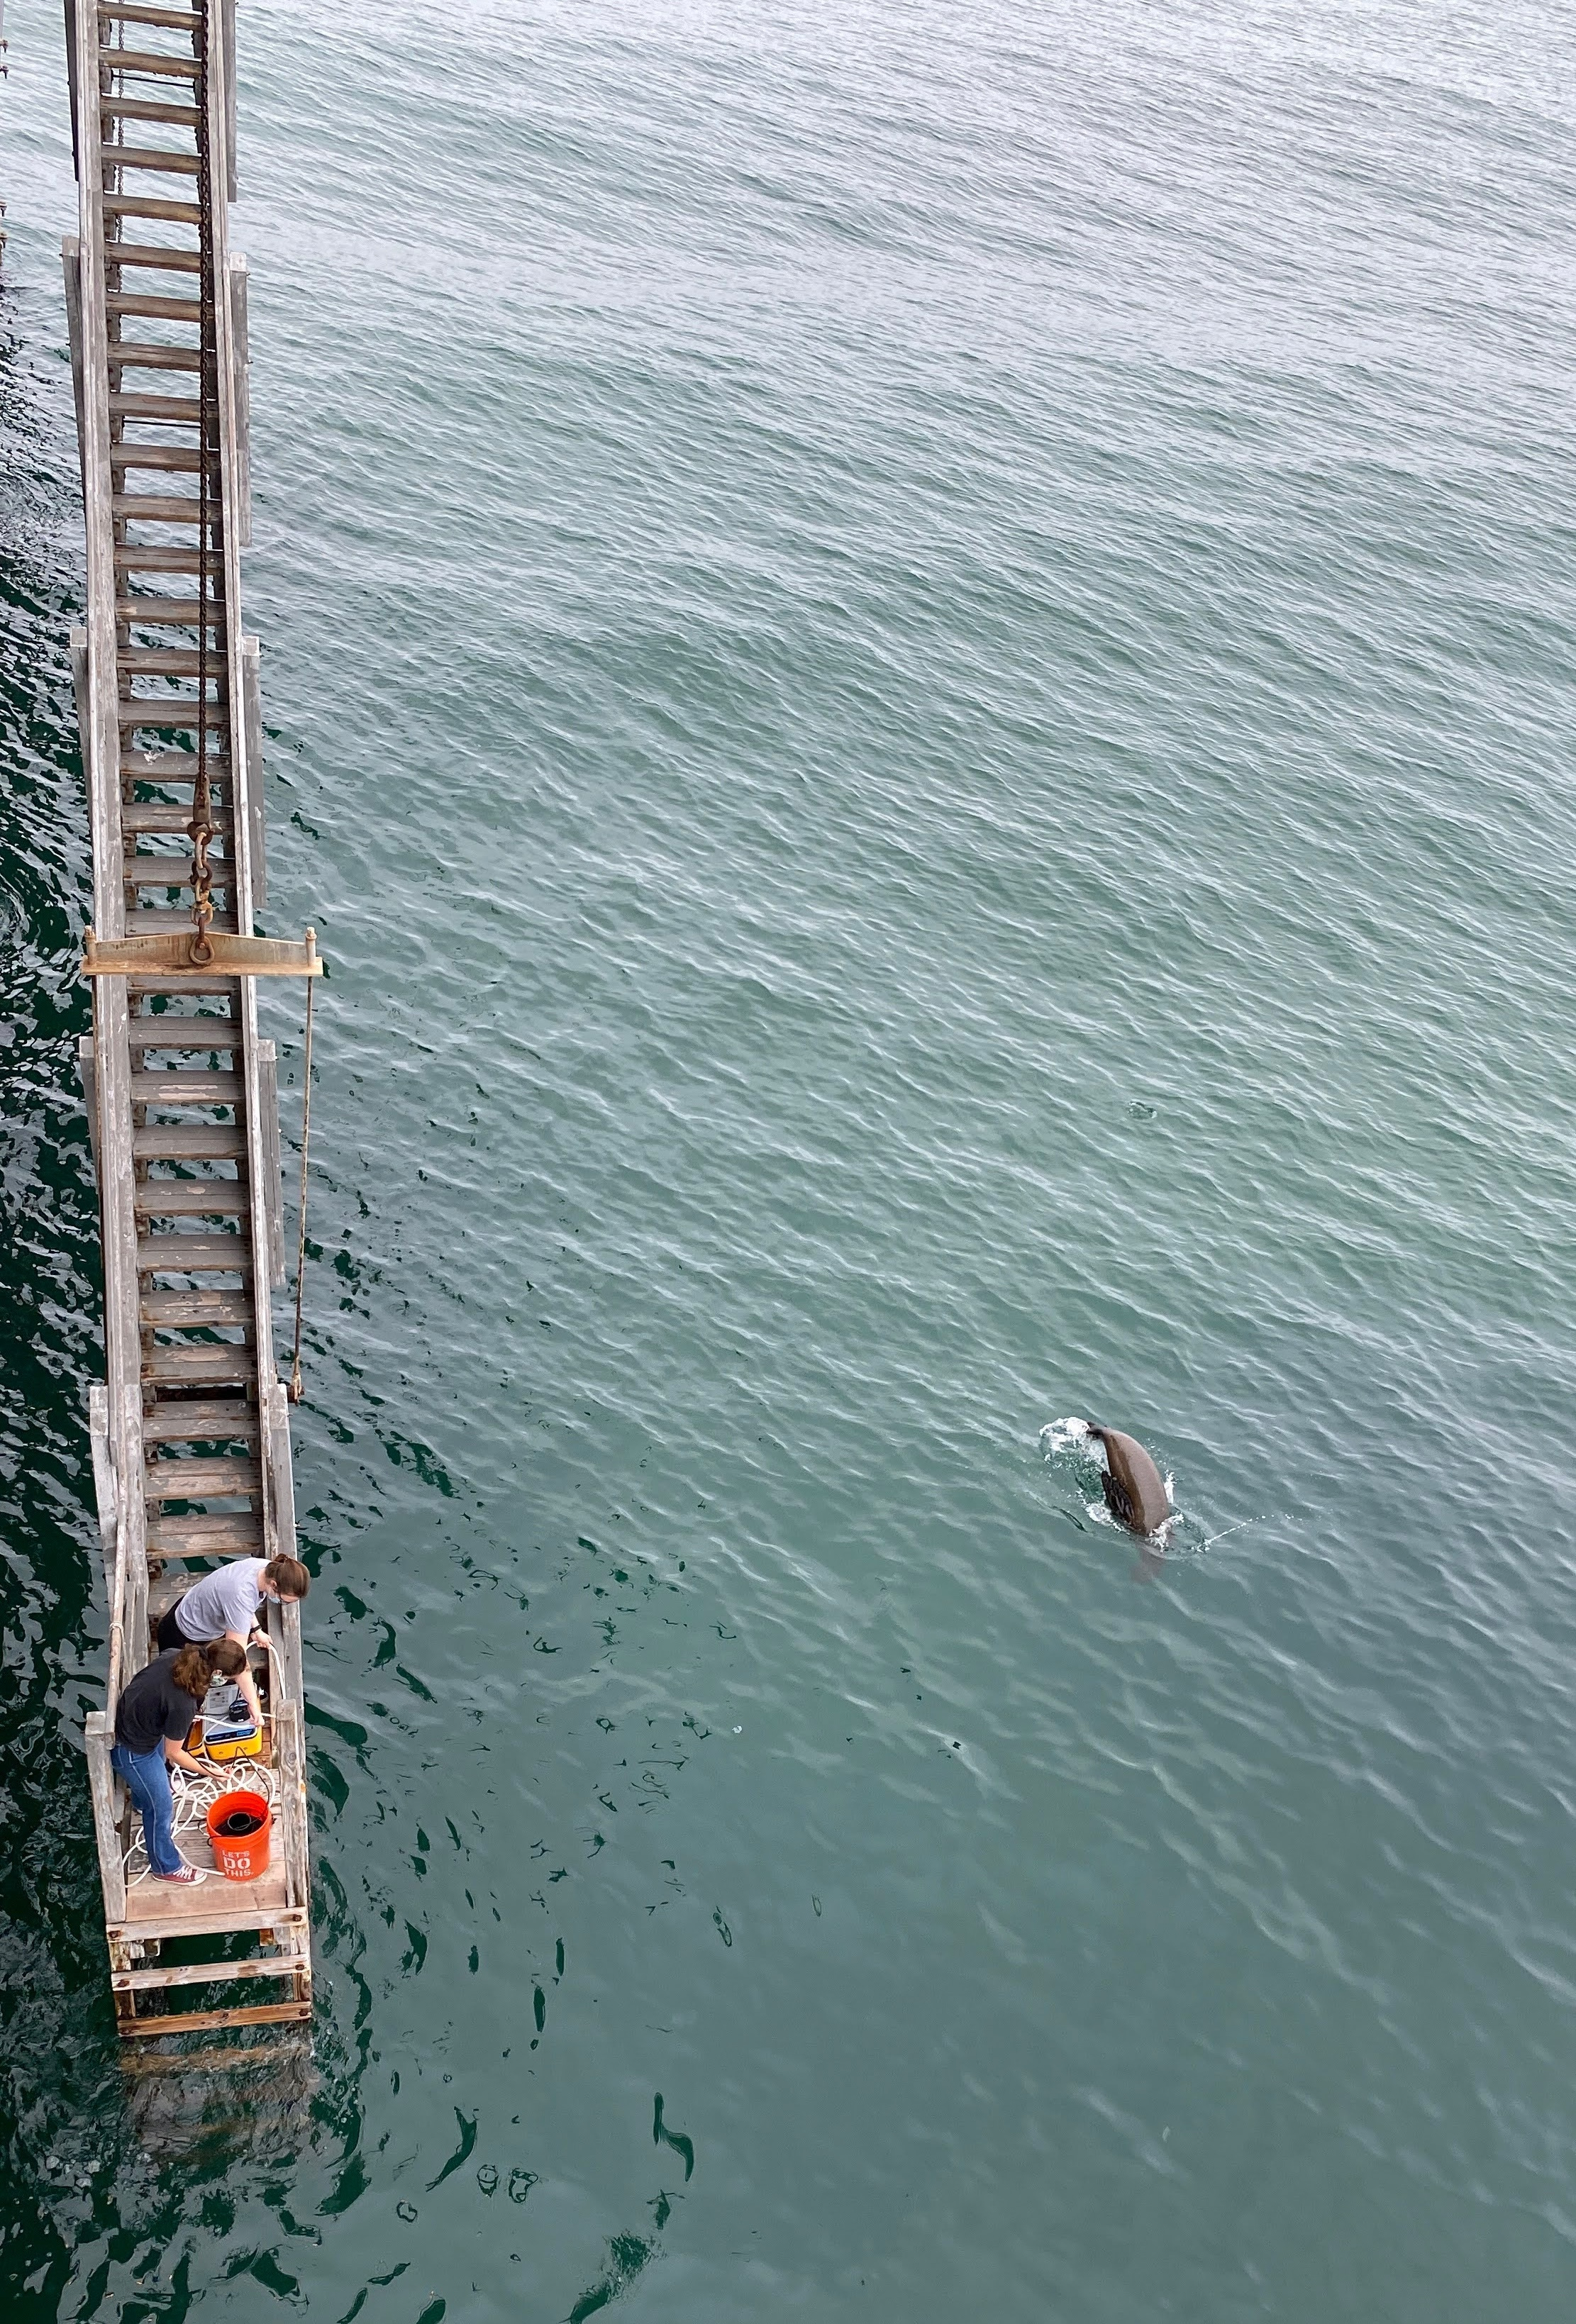
Still, after more than a hundred weeks of sampling, the data felt frustratingly inconclusive. Mercury concentrations seemed to fluctuate randomly. But we kept going. Then, around week 150, the pieces started to connect. What looked like noise became a clear seasonal signal: mercury concentrations peaked in the winter and dropped in the summer. These shifts aligned with changes in environmental conditions, such as storm-driven mixing, runoff, and ocean turbulence. It was a moment of both excitement and relief, one that validated not just our approach but the very premise of long-term, slow science. Our persistence had paid off.

Of course, once the pattern became visible, Hannah pulled out her computer, dusted off her spreadsheets, and applied data analysis tools, such as trend decomposition and regression modeling, to quantify and better understand the drivers behind the data.
It takes a team (and the government)
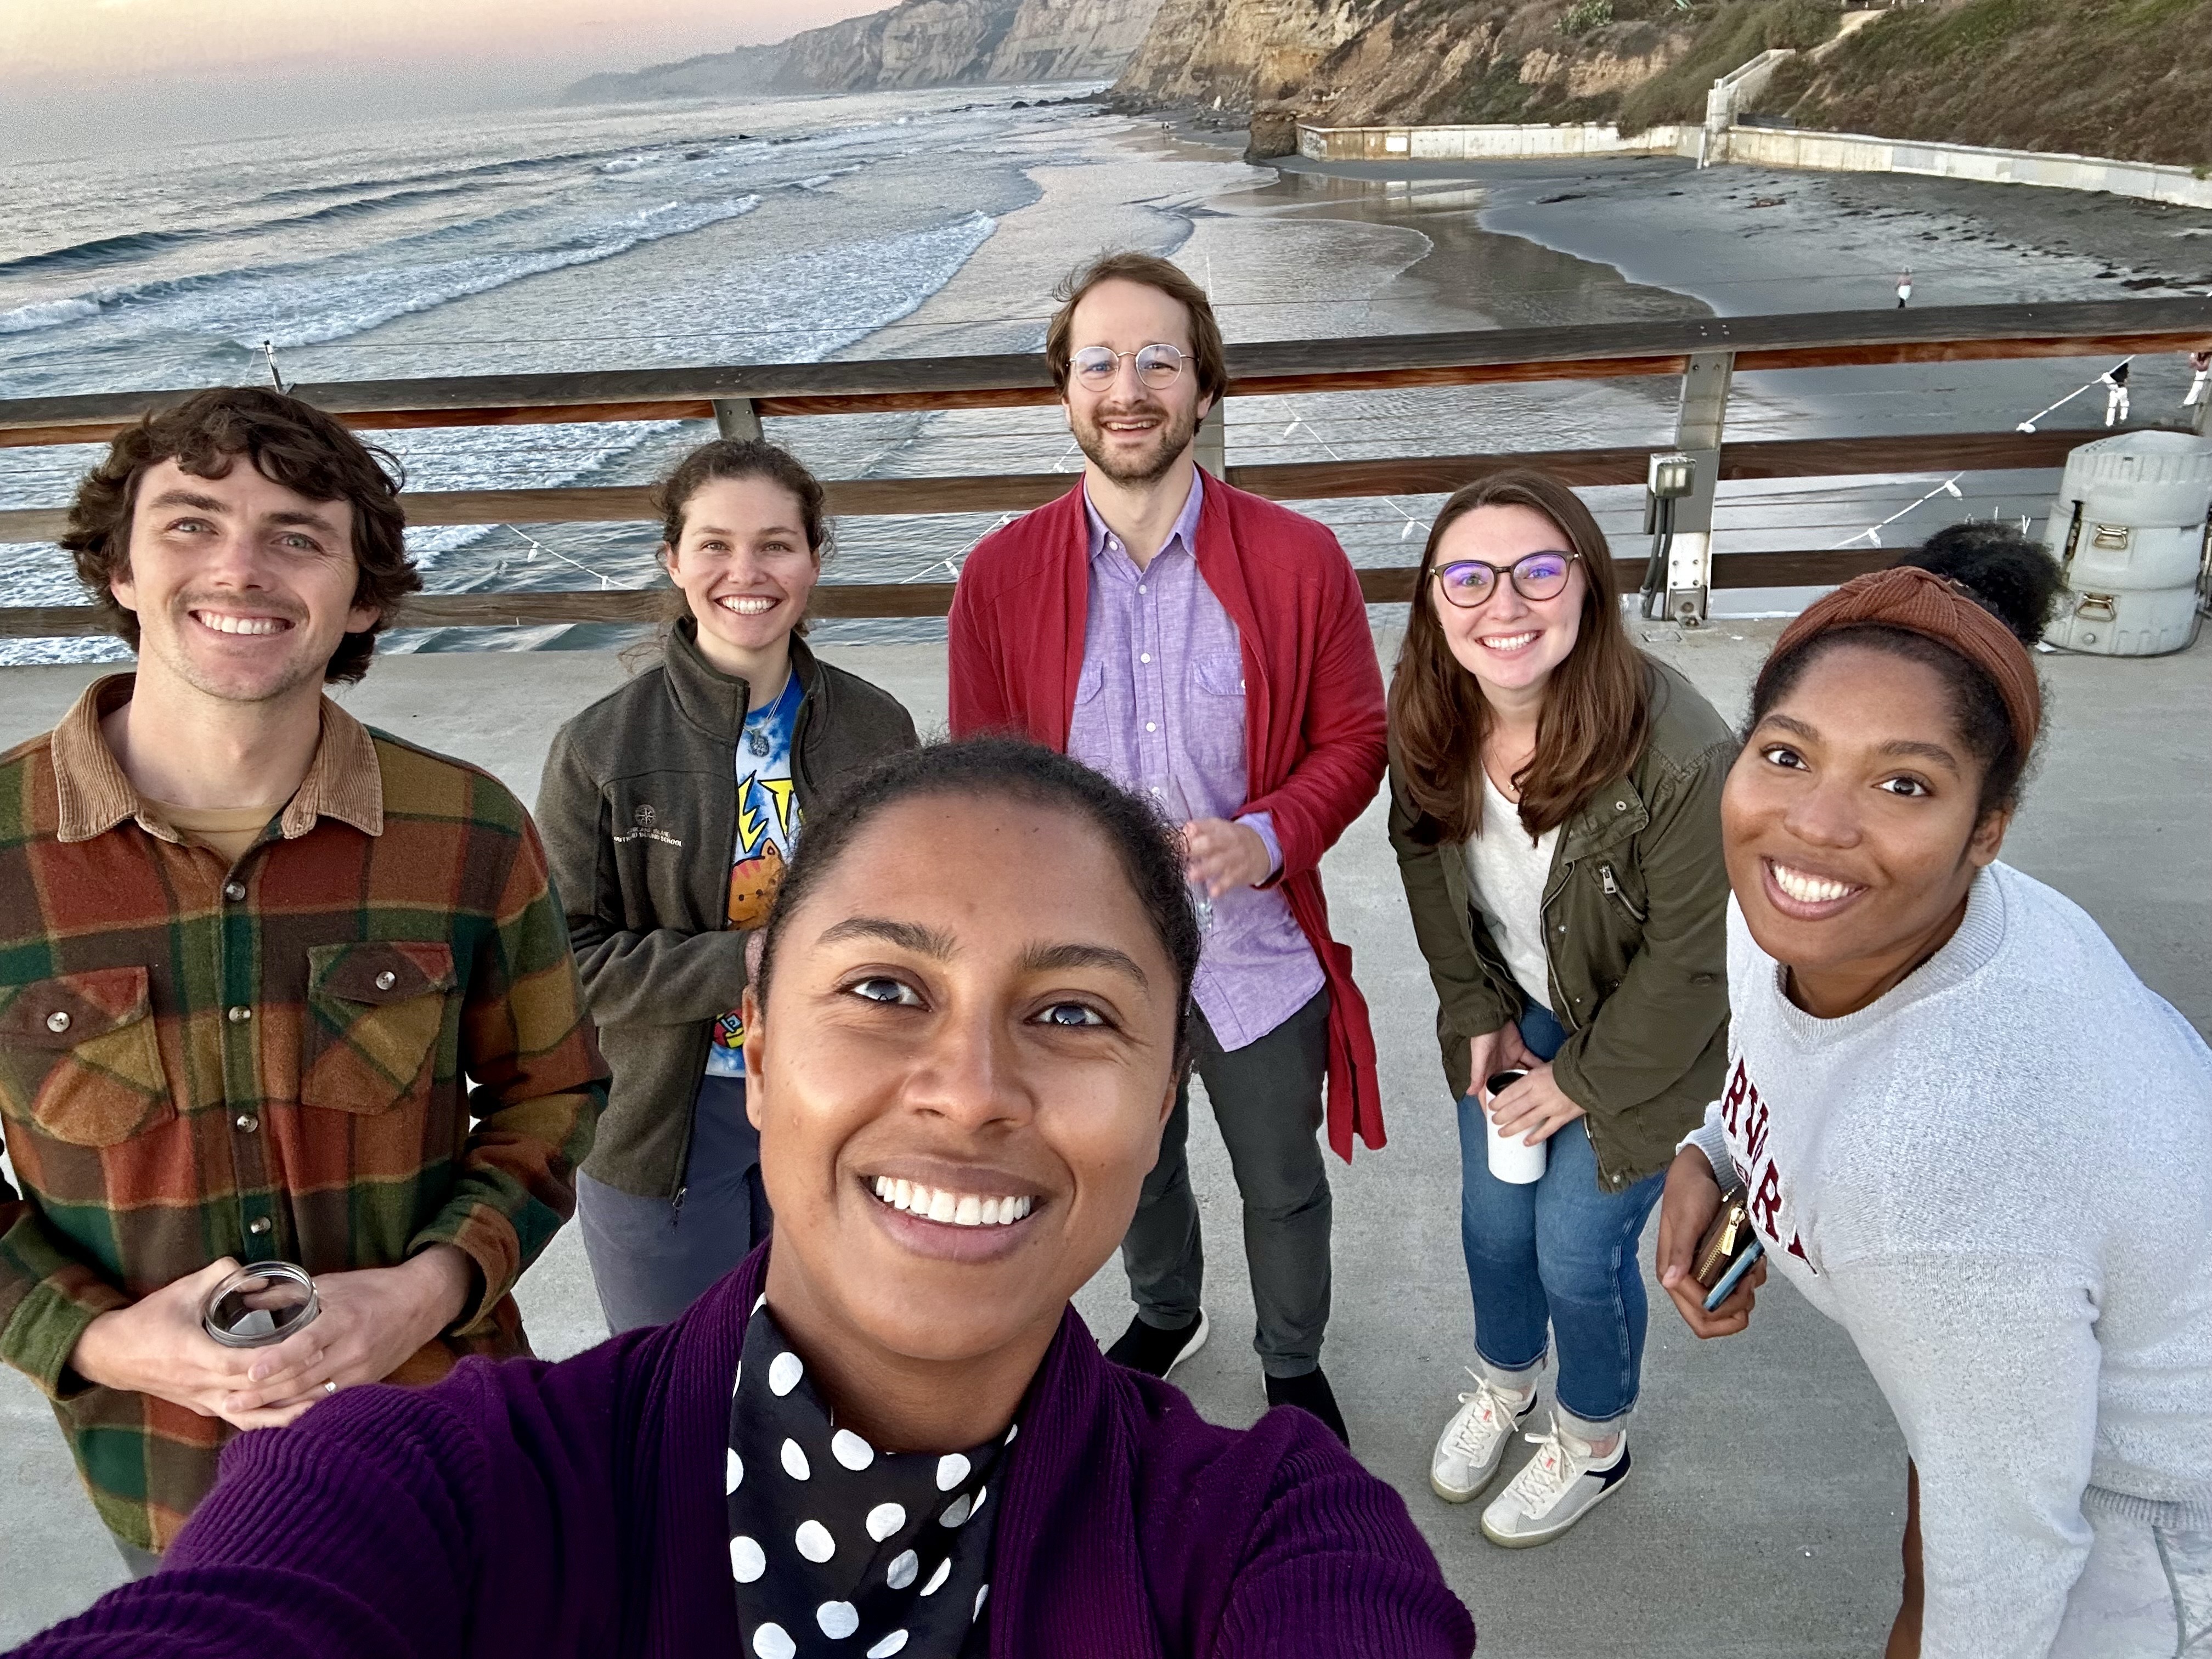
Researchers from the Schartup Lab (Erik Paulson, Iris Kübler-Dudgeon, Johannes West, Hannah M. Adams, Cathryn Sephus, and Amina T. Schartup) on Scripps Pier to celebrate 3 years of consistent sampling efforts. Everyone in the photo has assisted with taking samples for the mercury time series. Photo by Amina T. Schartup
Beyond our own team, this work built on other long-term efforts. We relied on publicly available datasets, supported by the National Oceanic and Atmospheric Administration and the United States Geological Survey, to give context to our data. Our work would not be possible without decades of rainfall, streamflow, wind, and wave data from government-supported monitoring programs.
What started as a weekly trip to the pier became something bigger – a dataset that captured how mercury behaves in coastal waters and hopefully a small piece of a much larger scientific puzzle of ecosystem health. Long-term monitoring projects like this one is how we can understand change. And as support for environmental data collection becomes increasingly fragile, it’s important that we fight to keep these efforts going.
Seeing the full picture
Our goal was to understand how natural climate variability influences mercury concentrations in coastal waters. While much attention has been paid to the role of human emissions on seawater concentrations, mercury levels are also shaped by local and climatic processes, such as precipitation, wave action, mixing, and runoff. Untangling these natural drivers from emissions and deposition trends requires data that capture both the fast and slow processes. This is where frequency and duration mattered. If we had sampled only seasonally, or even monthly, we would have missed the shorter-term spikes in mercury tied to major storm events, seasonal patterns, or even slight differences between each year. Weekly sampling allowed us to identify wave height and precipitation as major drivers of surface water mercury concentrations. We used this information to extend our analysis by modeling past conditions using 20 years of archived streamflow and buoy data. This broader temporal lens allowed us to examine how local climate variability plays a significant role in mercury level fluctuations, at times mimicking or obscuring the effects of emissions reductions. In the end, our study highlights what only long-term, frequent data can reveal: the complexity of environmental systems and the need to understand the natural rhythms of a place before interpreting change. Without this level of detail, we risk misreading the story the data is trying to tell.
Hannah Adams will be defending her PhD in a month. We hope that support for research in the United States continues and grows so that other students can take over and wheel the blue wagon down to the pier, share a moment with the playful sea lions, and one day measure vanishingly low mercury levels in the water demonstrate clear evidence that global efforts to reduce this pollutant are working, and that science, patience, and persistence can leave the environment better than we found it.
Follow the Topic
-
Communications Earth & Environment

An open access journal from Nature Portfolio that publishes high-quality research, reviews and commentary in the Earth, environmental and planetary sciences.
Related Collections
With Collections, you can get published faster and increase your visibility.
Archaeology & Environment
Publishing Model: Hybrid
Deadline: Mar 31, 2026
Drought
Publishing Model: Hybrid
Deadline: Mar 31, 2026




Please sign in or register for FREE
If you are a registered user on Research Communities by Springer Nature, please sign in