Model-projected future tropical Pacific warming supported by paleoclimate proxy records
Published in Earth & Environment
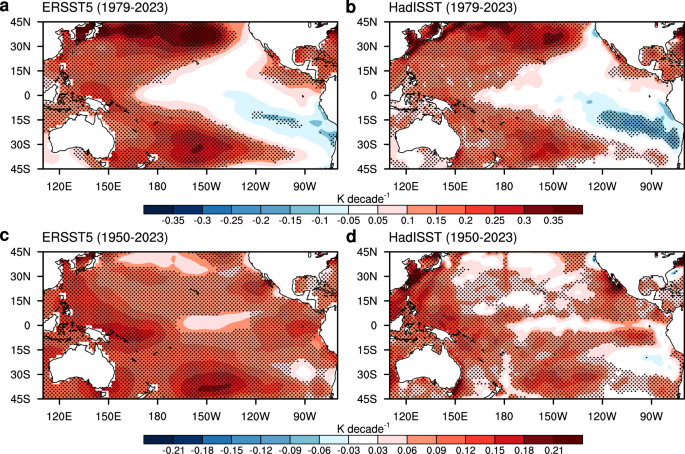
Despite a distinct global-mean warming resulting from increasing concentrations of greenhouse gases, substantial regional differences have been observed, especially over the satellite era. While the Northwest/Southwest Pacific and the Western Pacific warm pool show marked warming trends over the satellite era, the central-to-eastern equatorial Pacific exhibits weak cooling or muted warming trends in spite of greenhouse gas forcing (Fig. 1a). In contrast, a majority of current and earlier generations of climate models failed to reproduce this La Niña-like sea surface temperature (SST) trend pattern. This model-observation discrepancy appears to indicate systematic model deficiencies in simulating the tropical Pacific SST response to greenhouse gas forcing. However, due to potential roles of non-greenhouse gas forcing agents, such as Antarctic ozone depletion and anthropogenic aerosols, and internal climate variability in driving the observed La Niña-like SST trend pattern, it remains elusive to confidently determine the response of tropical Pacific SST to greenhouse gas forcing. In a new study, published in the journal Communications Earth & Environment, an international team of scientists from Republic of Korea and Japan shows that paleoclimate proxy records over the late Cenozoic support the model-projected weakening of the tropical Pacific zonal SST gradient under sustained strong global warming.

The radiative climate feedback and thus the extent of global warming resulting from greenhouse gas forcing can vary depending on the spatial pattern of tropical Pacific SST change. Moreover, the characteristics of large-scale atmospheric circulation (i.e., the Hadley and Pacific Walker circulations) and associated atmospheric teleconnections that affect extra-tropical weather and climate are unlikely to be independent of tropical Pacific SST change pattern. It is therefore crucial to unambiguously determine the response of tropical Pacific SST to increasing concentrations of greenhouse gases. In terms of climatological mean, a distinct zonal SST difference is observed over the tropical Pacific with warm Western Pacific warm pool contrasting to colder central-to-eastern Pacific. Most of climate models predict that this zonal SST gradient is likely to weaken in the future. Due to model biases and deficiencies, however, the reliability of this El Niño-like tropical Pacific SST change pattern has been questioned. In fact, a substantial model-observation discrepancy has been reported over the satellite era: while observations indicate a strengthening of the zonal SST gradient (i.e., La Niña-like change pattern), most climate model simulations exhibit a reduced zonal SST gradient. This marked discrepancy has led to community questioning whether critical processes are missing in the climate models. However, there has also been community interest in potential non-model sources of uncertainty in representing changes over the satellite era, such as the role of internal climate variability in the coupled climate system and the potential impacts of non-greenhouse forcing agents.
In case that the La Niña-like SST trend pattern over the satellite era is a forced response to greenhouse gas forcing, one would expect that more pronounced spatial patterns with enhanced zonal asymmetry have emerged over an extended historical period. However, the SST trend pattern over a post-war period (i.e., 1950–2023; Fig. 1b) is noticeably different from that over the satellite era (i.e., 1979–2023; Fig. 1a). In addition, despite a similar steady rise in greenhouse gas concentrations, an El Niño-like, rather than La Niña-like, SST trend pattern was observed over the period 1950–1994 (Fig. 1c). This dependence of tropical Pacific SST trend on analysis period suggests the roles of non-greenhouse gas forcing agents and/or internal climate variability. As a result, it is uncertain whether the La Niña-like SST trend pattern over the satellite era can be attributed solely to greenhouse gas forcing.

Due to this potential limitation of the effective duration over which high-quality historical SST observations exist, the research team led by Dr. Seong-Joong Kim, Vice President of Korea Polar Research Institute, attempted to determine the response of tropical Pacific SST to greenhouse gas forcing by analyzing paleoclimate proxy records over the past four million years. A variety of paleoclimate proxy records indicate that the tropical Pacific zonal SST gradient weakened during the mid-Pliocene warm period with high atmospheric CO2 concentrations (~400 ppm) relative to pre-industrial conditions (symbols in Fig. 2a and Fig. 2b), which is seemingly at odds with the La Niña-like SST trend pattern over the satellite era shown in Fig. 1a. The reduced zonal SST gradient during the mid-Pliocene warm period conversely implies an enhanced zonal SST gradient during colder climates with lower CO2 levels. Based on the fact that the Last Glacial Maximum (LGM) was characterized by a much colder climate with much lower CO2 levels (~200 ppm), the research team also analyzed paleoclimate proxy records during the LGM period. The LGM SST anomalies relative to pre-industrial period inferred from geochemical proxy records, however, exhibit an indistinct change in the zonal SST gradient, probably due to large uncertainties stemming from incomplete and uneven proxy data sampling in both space and time. To avoid large uncertainties in paleoclimate proxy records during the LGM, they also analyzed paleoclimate data assimilation products, in which large uncertainties arising from incomplete and uneven proxy data sampling were substantially reduced, and found enhanced cooling over the eastern equatorial Pacific than over the western equatorial Pacific (Fig. 2d). Climate model simulations are found to broadly reproduce this contrasting feature between the mid-Pliocene (Fig. 2a, shading) and LGM (Fig. 2c). In addition, paleoclimate proxy records over the late Cenozoic period indicate that an overall increase of the zonal SST gradient over time has been accompanied by global-mean cooling associated with decreasing concentrations of CO2 (Fig. 3a), which idealized climate model simulations are found to qualitatively reproduce (Fig. 3b). These results therefore collectively suggest that the zonal SST gradient is likely to weaken under sustained strong greenhouse gas forcing. The research team, however, acknowledges that further study is needed as substantial uncertainties remain in paleoclimate proxy records due to uneven proxy data sampling, proxy uncertainties and methodological limitations.

Follow the Topic
-
Communications Earth & Environment
An open access journal from Nature Portfolio that publishes high-quality research, reviews and commentary in the Earth, environmental and planetary sciences.

Related Collections
With Collections, you can get published faster and increase your visibility.
Hazards in Mountain Regions
Publishing Model: Open Access
Deadline: Nov 02, 2026
Ecosystems under marine heatwaves
Publishing Model: Hybrid
Deadline: Oct 22, 2026
Please sign in or register for FREE
If you are a registered user on Research Communities by Springer Nature, please sign in