Modelling the key factors influencing SARS-CoV-2 transmission
Published in Healthcare & Nursing
Mathematics in everyday life
Mathematics is ubiquitous in the modern world; from providing weather forecasts and securing online transactions, to generating the fastest route through a busy city, and, more recently, trying to quantify the likely impact of the COVID-19 pandemic.
Our research centre uses mathematical modelling to understand the spread of infectious diseases, and my colleagues and I have spent the last two years working on the COVID-19 response in the UK. In our most recent research, we use a compartmental model to explore key factors that influence projected dynamics of SARS-CoV-2 transmission in England.
Compartmental model of SARS-CoV-2 transmission
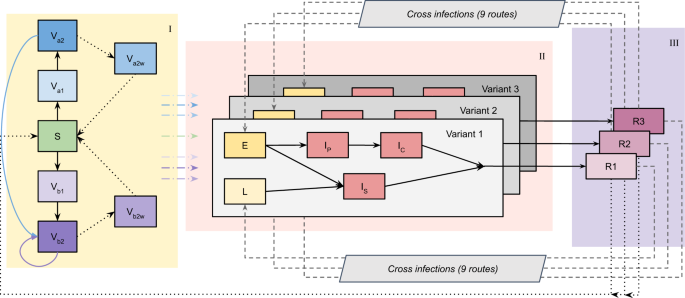
Compartmental models divide a population of interest into distinct categories, with rules determining movement between those categories. In our compartmental model of SARS-CoV-2 transmission, individuals are allocated categories according to their so-called disease status (a simplified example of this is shown in Figure 1).

In addition to categorising individuals by their disease status, our model is structured by geography and age. Here, we divide England into seven NHS England regions and we further divide each region's population into 5-year age groups. Contact survey data and mobility data inform the rate that different age groups mix with one another and the overall rate of mixing over time, respectively.
We use this compartmental model to approximate processes relevant to COVID-19, including:
- The number of SARS-CoV-2 infections over time
- The number of hospital admissions caused by these SARS-CoV-2 infections
- The number of deaths caused by these SARS-CoV-2 infections
The model also keeps track of other quantities relevant to the process of disease spread, such as the number of people who have received COVID-19 vaccinations and the proportion of infections which are attributable to different SARS-CoV-2 variants of concern over time (e.g. Alpha, Delta, and Omicron BA.1 and BA.2).
We fit this model to various epidemiological data streams (e.g., data from the Office for National Statistics estimating the prevalence of COVID-19 infections in each NHS England region) in order to make our modelling as accurate as possible compared to reality.
Factors influencing SARS-CoV-2 transmission
In the paper, we use our compartmental model fitted to more than 2 years of epidemiological data (between March 2020 and May 2022) to explore how different assumptions influenced projected SARS-CoV-2 transmission dynamics from May to December 2022.
The biggest factors influencing projected SARS-CoV-2 transmission were:
- Waning immunity (how quickly immunity acquired from COVID-19 vaccinations and/or previous infections is lost)
- Behaviour (e.g., changes in the number of contacts people make, or in the use of protective behaviours such as regular COVID testing and mask wearing)
- Seasonality (i.e., variations in transmission that occur at regular intervals throughout the year, caused by factors such as the weather or traditional holiday periods)
In addition to looking at influential factors determining future modelled outcomes, we assess retrospectively and prospectively the effectiveness of the COVID-19 booster vaccination campaign in England, which was administered from September 2021 onwards.
For this, we explore the effect of assuming different levels of uptake for the COVID-19 booster vaccination campaign on projected SARS-CoV-2 dynamics between October 2021 and December 2022. A counterfactual scenario which assumed that COVID-19 booster vaccinations were not deployed was projected to result in an additional 23,400 COVID-19 deaths and 108,000 COVID-19 hospital admissions between October 2021 and December 2022, compared to the central scenario (which used levels of booster vaccination uptake measured in April 2022).
Limitations & future considerations
Although our work highlights some of the key factors which influence the model's projections of future SARS-CoV-2 transmission, as with every piece of research, there are important limitations to take into account.
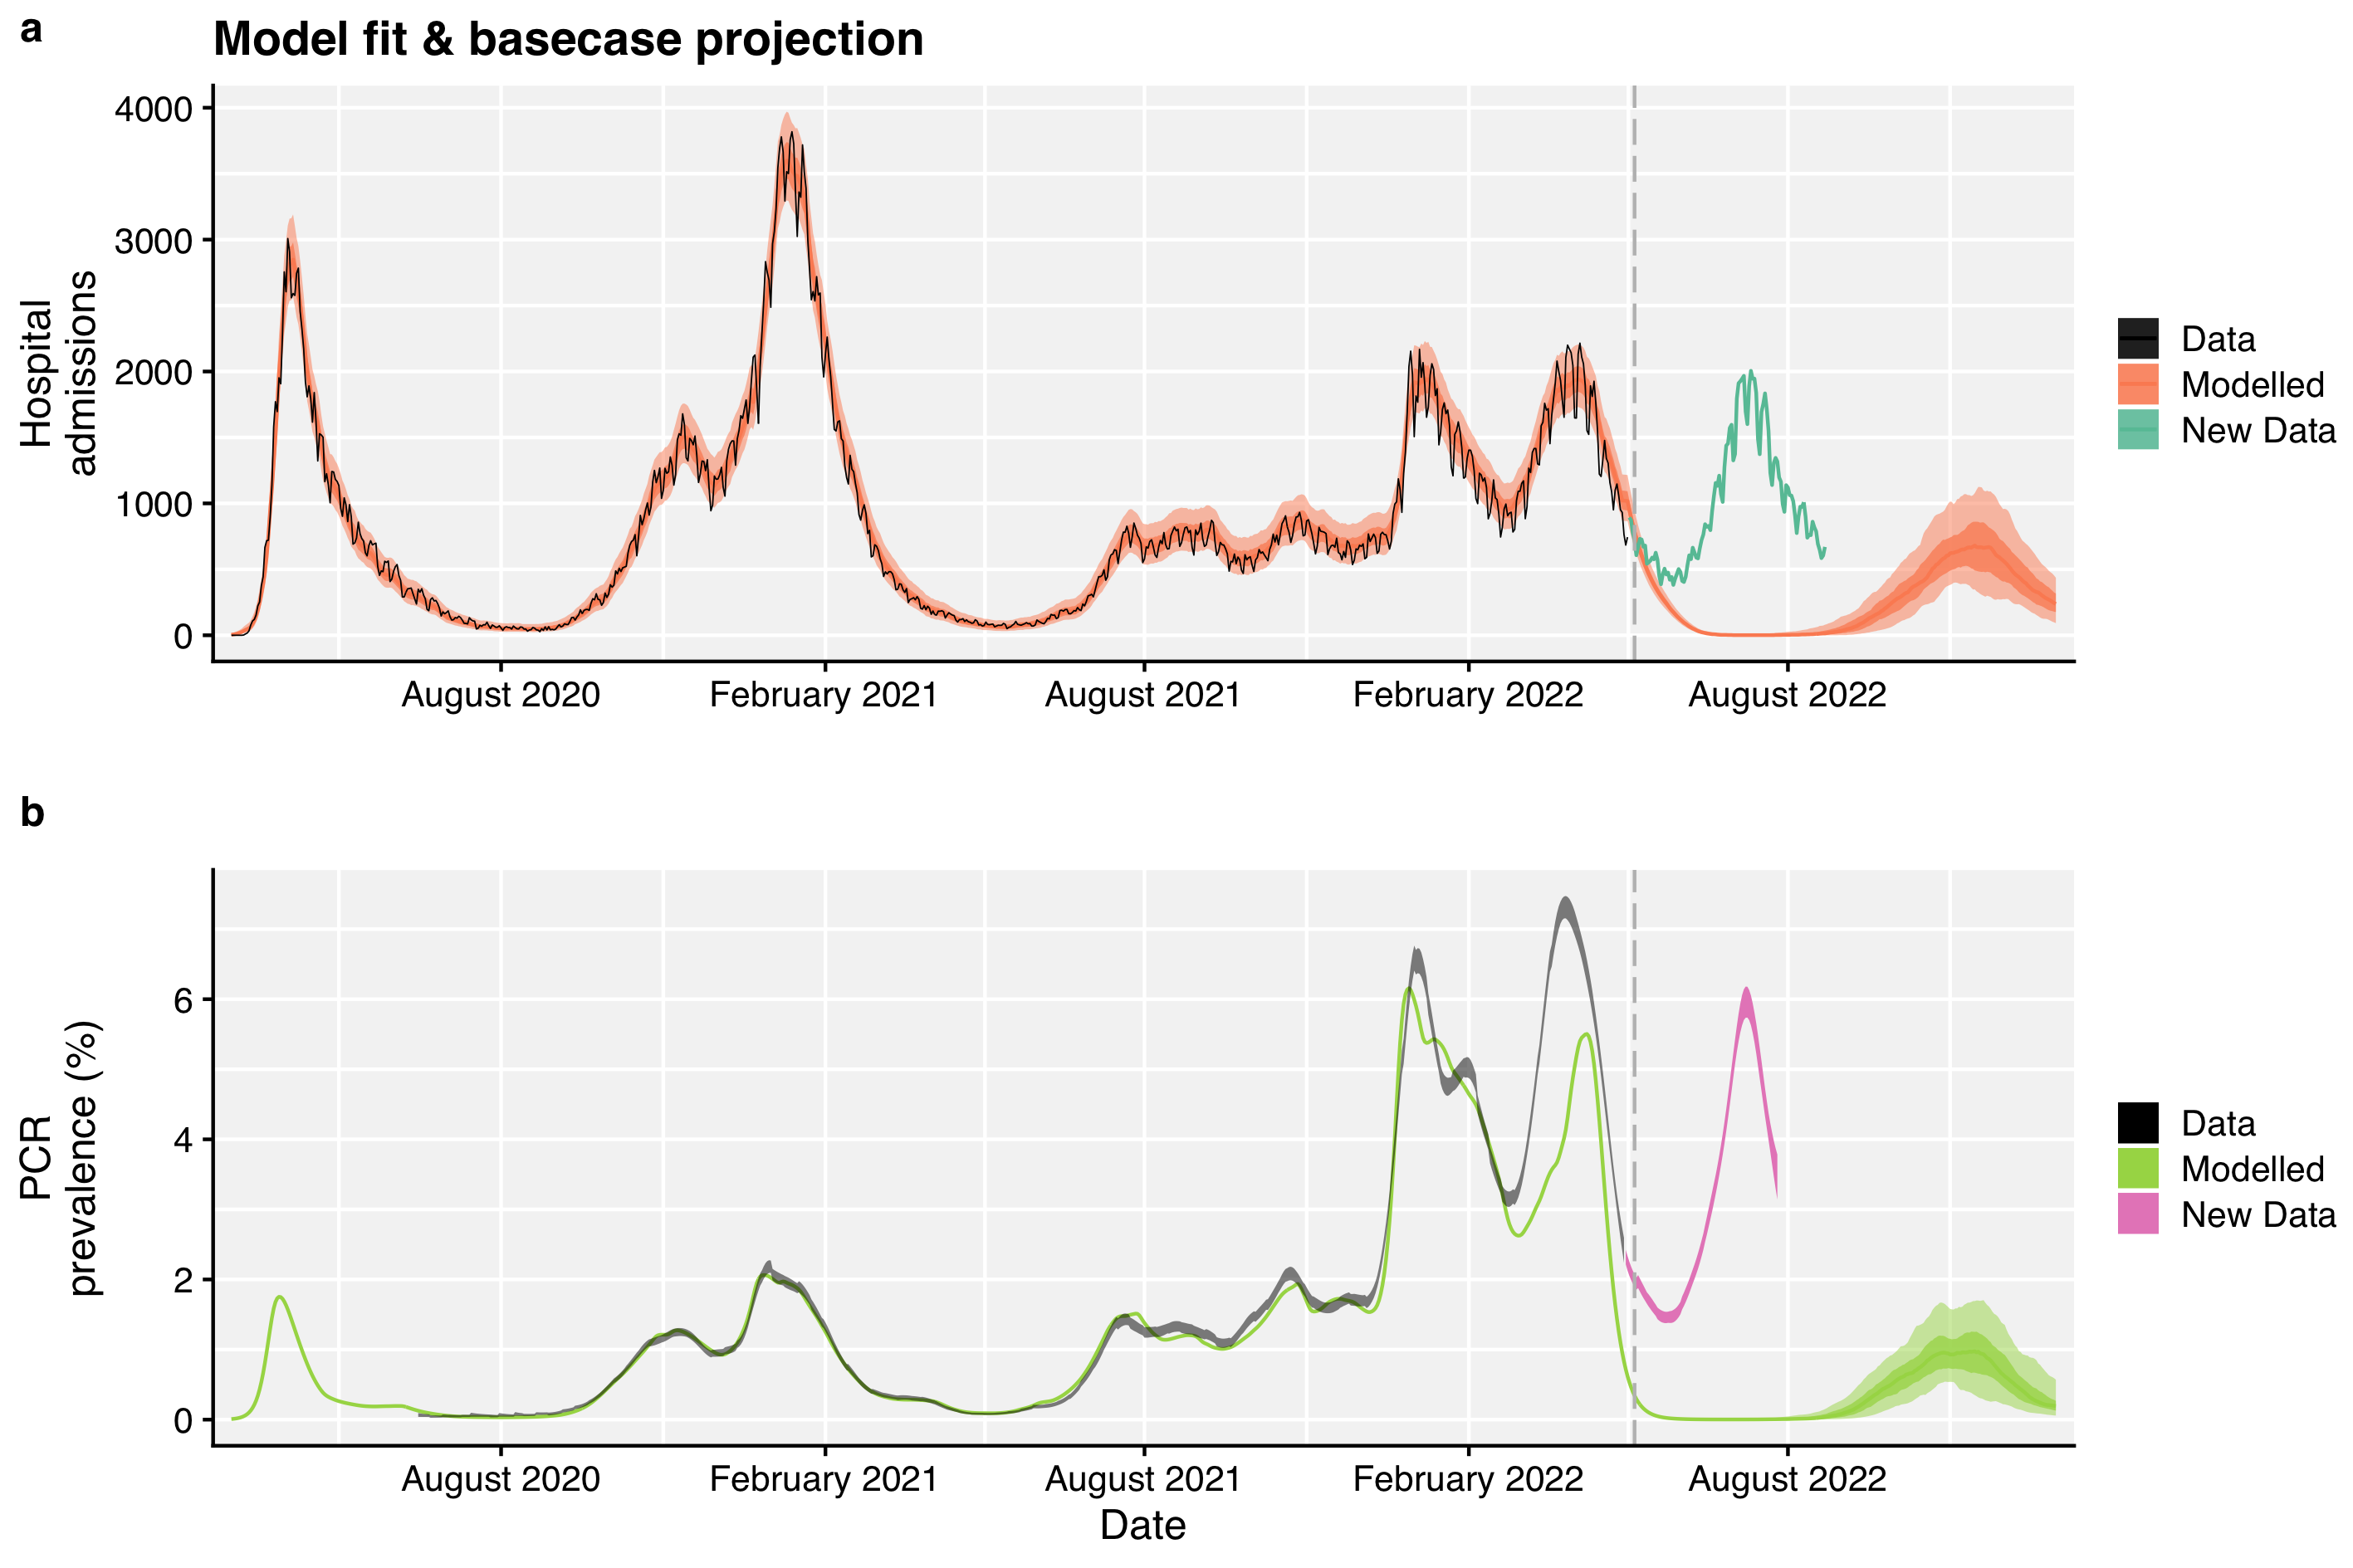
This modelling work was completed in May 2022 and assumes that the Omicron BA.2 sub-lineage remains dominant throughout the forward projections to December 2022. Since May, we have seen the Omicron BA.5 sub-lineage become dominant in England, and have observed an associated uptick in infections. Although our modelling does not aim to provide predictions, but rather to project a range of potential outcomes given various modelling assumptions, our modelling did not anticipate this recent increase in transmission in England due to Omicron BA.5 (Figure 2).
As with any mathematical model, we make a number of simplifications to describe the complex process of SARS-CoV-2 transmission within the population of England. For example, we do not attempt to model any differences in behaviour for individuals in different risk groups (e.g., vulnerable individuals shielding). Further, we assume the same levels of COVID-19 vaccine protection and rates of waning immunity across all age groups. In reality, heterogeneities such as these exist and may be important factors to consider when it comes to understanding and modelling disease spread. I would argue that these limitations provide a useful direction for research in the future.
Follow the Topic
-
Nature Communications

An open access, multidisciplinary journal dedicated to publishing high-quality research in all areas of the biological, health, physical, chemical and Earth sciences.
Related Collections
With Collections, you can get published faster and increase your visibility.
Women's Health
Publishing Model: Hybrid
Deadline: Ongoing
Advances in neurodegenerative diseases
Publishing Model: Hybrid
Deadline: Mar 24, 2026



Please sign in or register for FREE
If you are a registered user on Research Communities by Springer Nature, please sign in