Navigating the challenge: crafting data analysis pipelines for polymer imaging breakthroughs
Published in Chemistry

As a polymer scientist by training, I was thrilled when I first heard about my advisor Peng Chen's impossible-sounding goal to optically sequence single synthetic polymers. How could this ever work? I knew firsthand just how messy and heterogeneous synthetic polymers are - nothing like the biopolymers such as DNA with well-defined templates that enable sequencing. Synthetic polymers in typical bulk-level measurements are like a tangled ball of strands of varying lengths and compositions. Identifying each individual bead-like monomer unit in that chaotic mix seemed like trying to find a needle in a haystack while blindfolded. Yet despite the challenges, I was incredibly excited by Peng's vision. Ever since my undergrad days (I majored in Polymer Materials and Engineering), I had been fascinated by how the microscopic sequences of polymer chains dictate their macroscopic properties and functions. If we could unlock the sequence-function code at the single-chain level for synthetic polymers, the applications could be boundless.
Figuring out a new imaging method to optically read each monomer during polymerization was just part of the puzzle. Equally critical was developing a tailored data analysis pipeline to identify true monomers and pinpoint their locations within the complex image data. My past work on imaging single-molecule reactions on single inorganic catalyst particles had familiarized me with single-molecule localization microscopy - a technique heavily reliant on image data analysis to achieve super-resolution. However, working with single polymers and the new imaging method presented new complexities and challenges.
Drawing from my expertise in both polymer science and single-molecule imaging, I eagerly volunteered to take on the task of creating data analysis pipelines for this challenge. The key enabling technology devised by Peng is CREATS (Figure 1)- coupled reaction approach toward super-resolution imaging. By coupling polymerization with a photo-uncaging reaction that becomes fluorescent, CREATS allows detecting each inserted monomer at nanometer precision even at high, micromolar monomer concentrations. However, the seemingly pristine nature of Figure 1 belies the inherent complexity in the image processing.
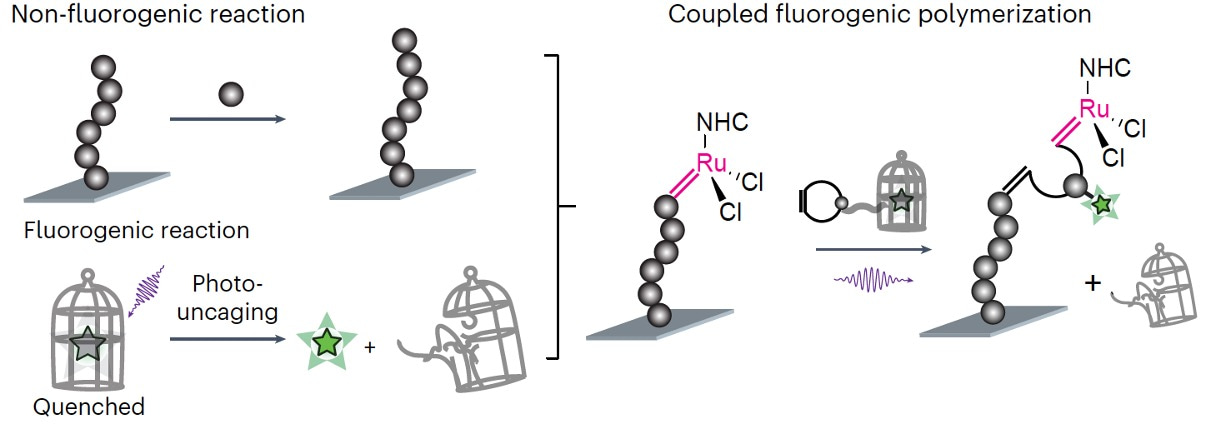 Figure 1. The design of CREATS imaging method, consisting of a surface polymerization reaction coupled with a subsequent fluorogenic photo-uncaging reaction.
While the design of CREATS appear brilliant, the practical reality often diverges from this ideal. After seeing a few initial preliminary data sets, I quickly came to realize that, without a properly customized data analysis pipeline, these seemingly straightforward image analysis steps can be exceedingly difficult to execute. The diagram involves several sources of uncertainty. For instance, ensuring the definitive insertion of a single monomer and distinguishing fluorescent bursts as labelled monomers from potential noise sources like monomer adsorption and impurities necessitates sophisticated data analysis. This involves temporal filtering of fluorescence signals to differentiate polymerized from diffusing monomers and spatial filtering for monomer localization within a single polymer chain.
To tackle these challenges, I developed a customized data analysis pipeline to enable single-polymer insights to emerge from the raw imaging data, through strategies such as optimized statistical filtering, automated image registration, on- versus off-catalyst event differentiation etc. This analytical framework leveraged my in-depth understanding of the imaging protocol and the chemistry and photophysics of the material systems to extract the spatiotemporal information of the real polymer growth events and produce clean single-monomer-insertion trajectories. Tailored algorithms then analyzed these filtered trajectories to uncover kinetic information like memory effects in polymer growth dynamics as well as the sequence of individual copolymer chains. Without this robust, optimized analysis protocol customized for the CREATS imaging technique, the single-chain phenomena would have been obscured by random noise and microscopic heterogeneity.

Figure 2. (a) Top: fluorescence image of a fluorophore-labelled catalyst (circles and asterisk show the locations of the catalyst from each image and from the frame-averaged image, respectively) on a marker particle (purple line). Bottom: a segment of the background-subtracted fluorescence intensity trajectory during polymerization on the catalyst, showing clear fluorescence-on bursts, where each burst reports an added monomer during polymerization. (b) Locations of inserted monomers during polymerization (each green dot represents one monomer), overlaid on the catalyst location (blue asterisk) and the marker particle contour (purple line) from a. Top and right: one-dimensional histograms of the monomer locations. (c) Green circles represent the autocorrelation function of microscopic reaction time from the single-catalyst polymerization trajectory. Black squares represent randomized control.
Specifically, guided by the positions of a marker particle and a single labelled catalyst (Figure 2a top), we performed background subtraction and temporal filtering based on timing of uncage-imaging-bleaching cycle to identify clean single molecule trajectories with high signal-to-noise ratios (Figure 2a, bottom). Localizing each monomer requires optimized spot-finding and fitting algorithms to identify clustering of inserted monomers around each single catalysts (Figure 2b). Careful filtering based on photon counts and fitting errors is needed to achieve nanometer spatial precision. Spatial clustering of monomers around a single catalyst confirms they grew from that catalyst and thus these inserted monomers are indeed from the same polymer. Sophisticated multi-step data analysis algorithms based on intensities, lifetimes, locations, and burst frequencies filters out false detections from either non-specifically adsorbed monomers or camera noise induced false positives. Importantly, understanding the photophysics of fluorophore uncaging and photobleaching enables setting optimal threshold for filtering, and prior knowledge of polymerization kinetics based on bulk-level tests assists in eliminating false signals. Notably, one unique advantage of the CREATE imaging technique is that it can work in high reactant concentrations. At 0.1 μM monomer concentrations, background noise increases substantially, demanding a highly robust statistical analysis to retain the rare growth events while removing random noise. Furthermore, autocorrelation analysis of monomer insertion times reveals kinetic memory effects (Figure 2c), but requires clean trajectories filtered of noise and false detections (for example, Figure 2a bottom).
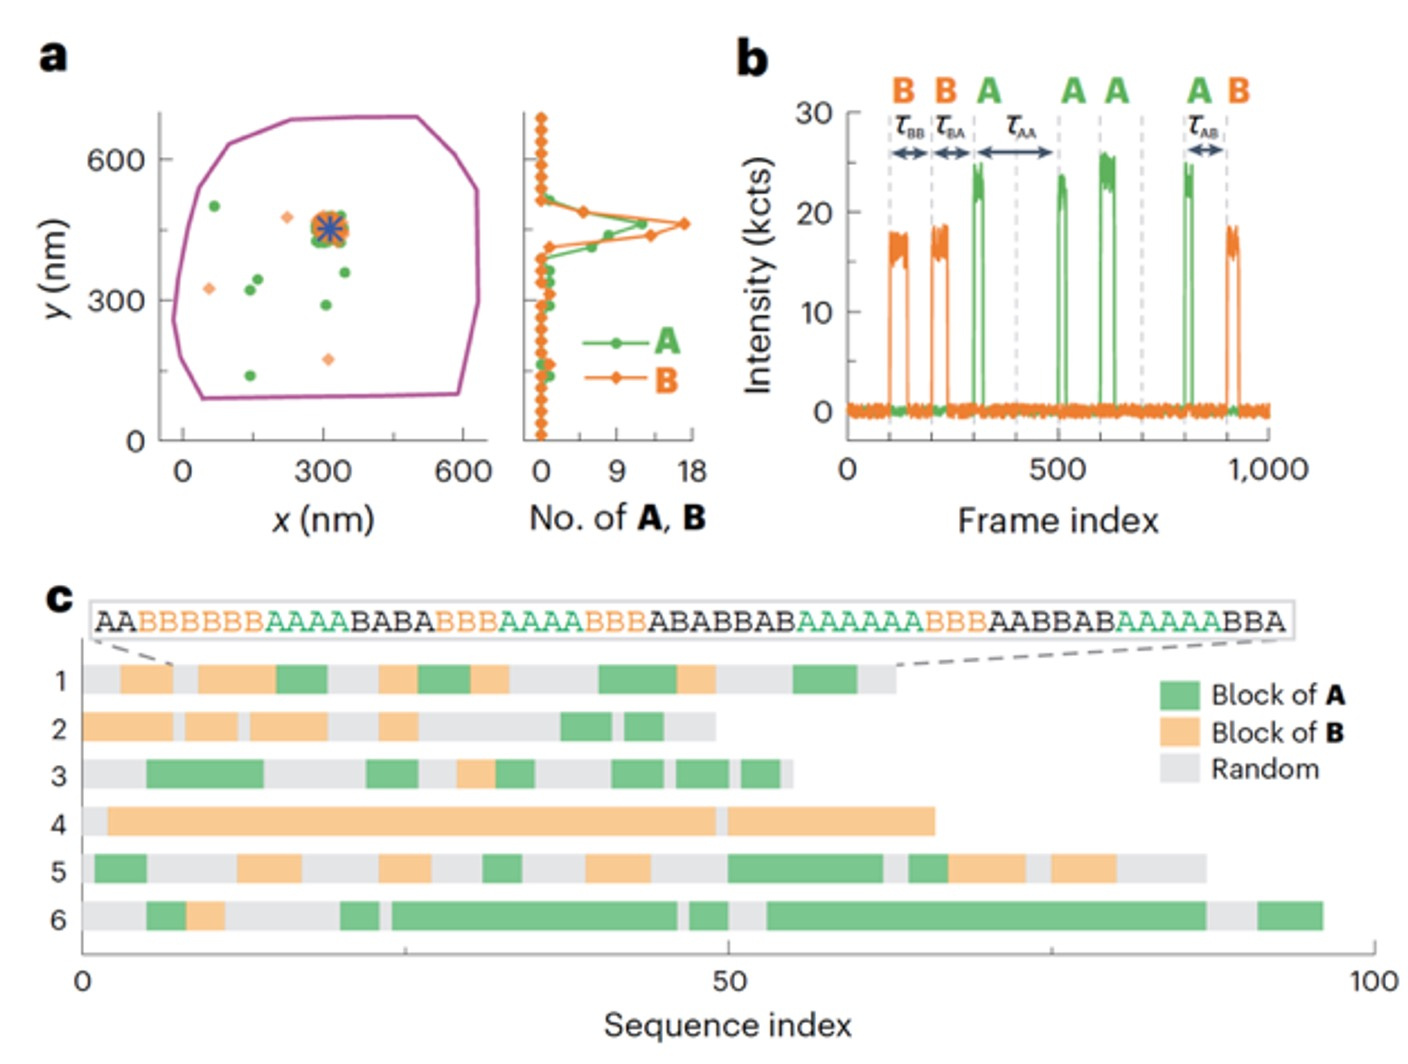
Figure 3. (a) Locations of individual polymerized monomer A (green dots) and B (yellow dots) around a single labelled catalyst (blue asterisk). The purple line is the contour of the marker particle. (b) A segment of the background-subtracted two-colour fluorescence intensity trajectory on the catalyst in a, showing the sequence of the grown copolymer. (c) Sequences of six example copolymers. Green and yellow blocks denote blocks of three or more A and B subunits, respectively, and the other sequence patterns are in grey.
Having laid out a robust analysis procedure for a homopolymer growth experiment, this data analysis procedure can be readily used for studying copolymer growth. Two-color co-localization confirms monomers are inserted into the same growing copolymer during sequencing, rather than different polymers (Figure 3a), based on the clean single molecule trajectories after background subtraction and noise filtering (Figure 3b). Such capabilities is key to the successful application of the CREAT imaging technique to sequence single synthetic copolymers (Figure 3c). Overall, the tailored data analysis pipeline played a pivotal role in extracting single-polymer insights such kinetics, dynamics and sequences from raw imaging data.
For more detailed information, see our article “Optical sequencing of single synthetic polymers” in Nature Chemistry (https://www.nature.com/articles/s41557-023-01363-2). Another blog post by co-author Xiangcheng Sun is at https://chemistrycommunity.nature.com/posts/single-molecule-fluorescence-imaging-and-sequencing-of-single-synthetic-polymers?channel_id=behind-the-paper.
Follow the Topic
-
Nature Chemistry
A monthly journal dedicated to publishing high-quality papers that describe the most significant and cutting-edge research in all areas of chemistry, reflecting the traditional core subjects of analytical, inorganic, organic and physical chemistry.


Please sign in or register for FREE
If you are a registered user on Research Communities by Springer Nature, please sign in