
Archaeologists and palaeoclimatologists both have a role to play in understanding the degree to which the environment and climate were responsible for significant changes in human societies of the past. The intersection of palaeoclimatology and archaeology provides an incredibly rich area for collaboration, with the objective of understanding how our predecessors lived in, thrived in, adapted to (and occasionally may have been surprised by) the environments that they lived in, which we know were diverse and changeable.
In our paper, recently published in Communications Earth & Environment, we outline findings from a climate reconstruction based on a speleothem (stalagmite) that tracks environmental changes that occurred during the final centuries in the occupation of major urban centers of the Indus Civilization. Located in the Indus River region, the Indus Civilization settlements experienced a variety of annual precipitation regimes, ranging from nearly completely summer-rainfall dominated, to at least equal amounts of winter and summer rainfall. This seasonal diversity was accompanied by an array of agricultural strategies across the wider region, while also creating a reliance on the annual distribution of rainfall.
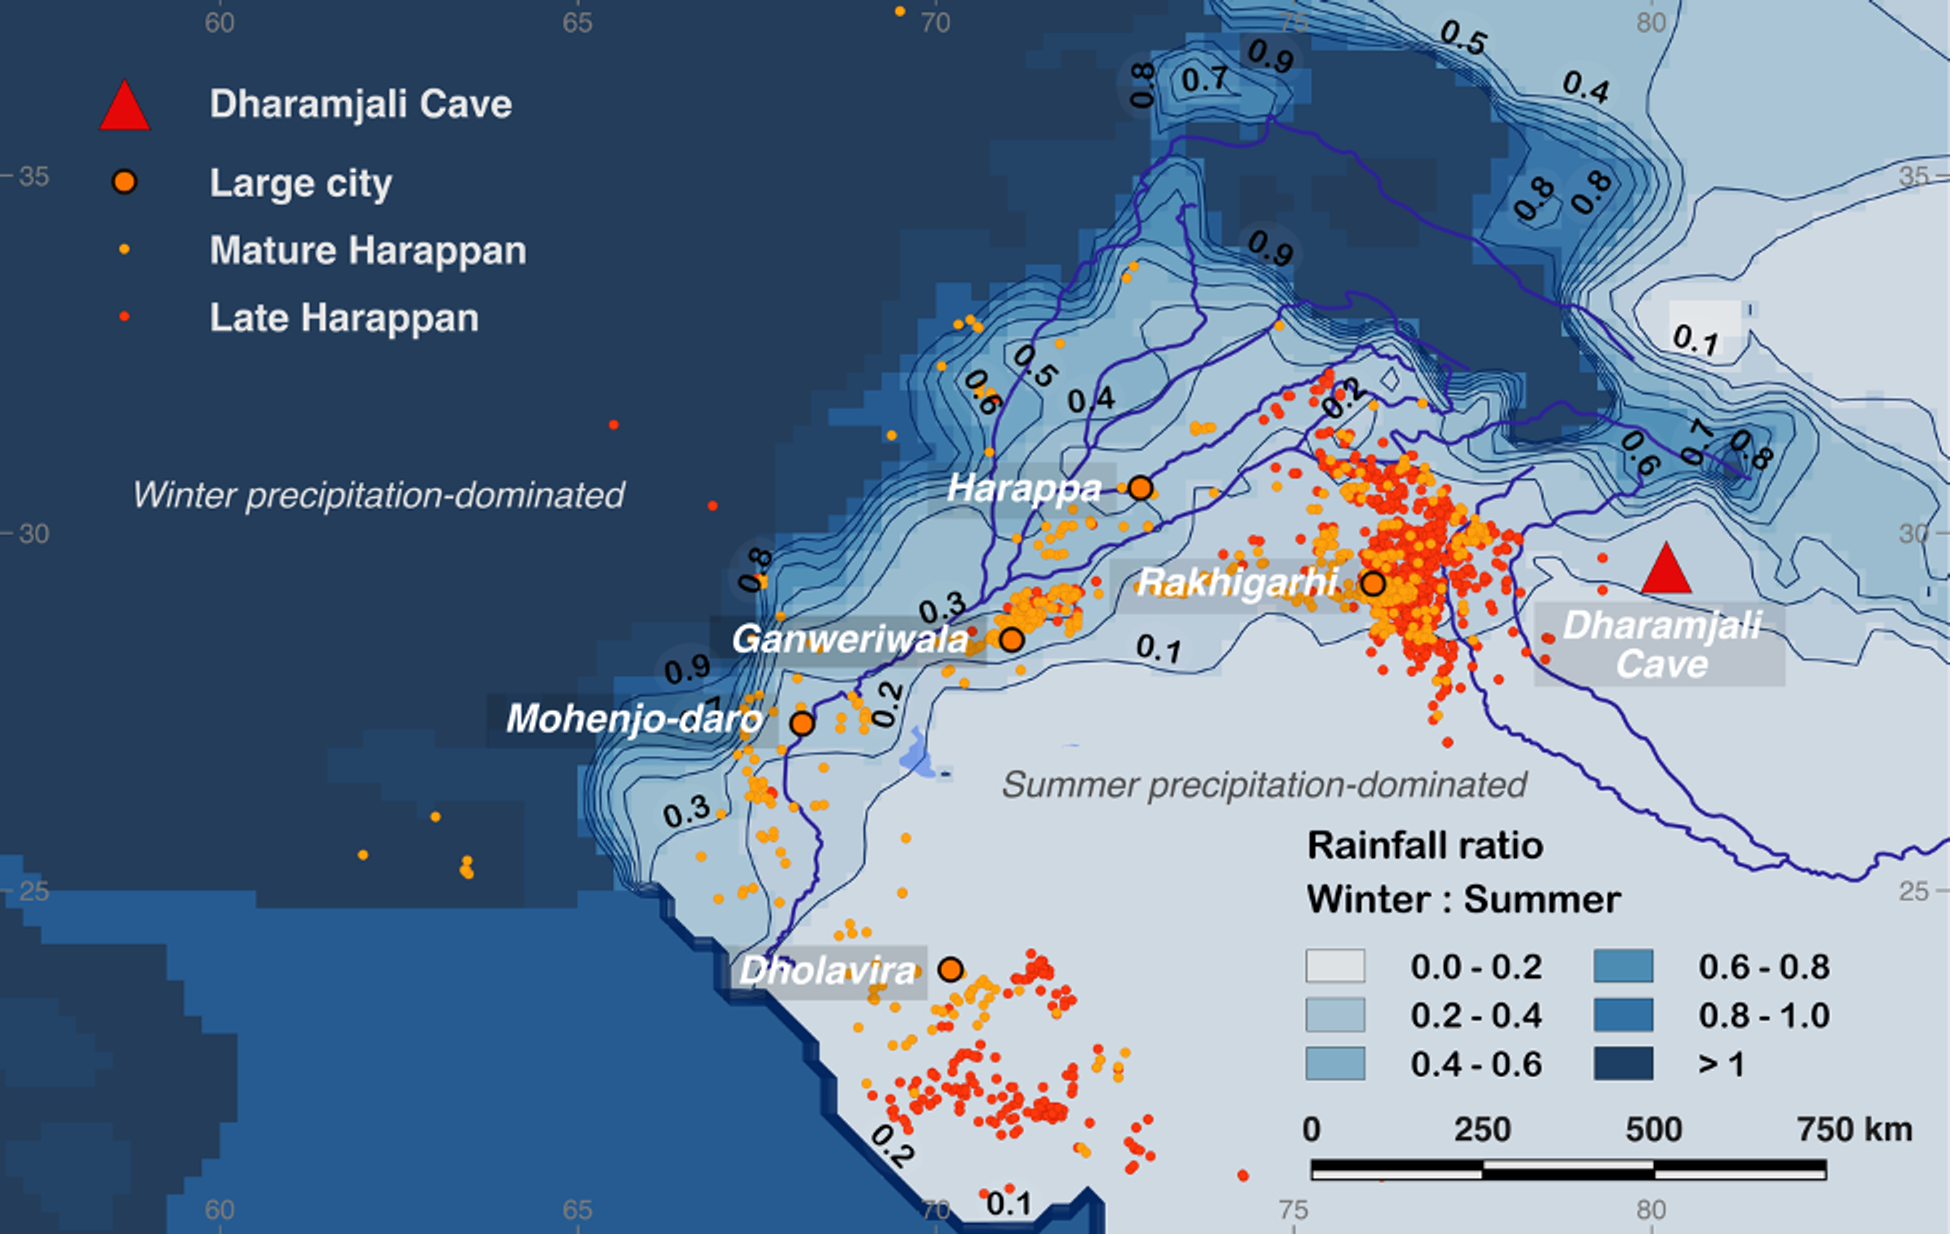
Local proportion of winter to summer precipitation in the Indus River region, showing the distribution of large Indus cities during the Mature Harappan (c. 4.6–3.9 ka BP, orange) and Late Harappan (c. 3.9–3.6 ka BP, red) periods. Contour lines represent the ratio of IWM (Nov–Apr) to ISM (May–Oct) precipitation based on the 0.25° GPCC v2018 dataset from 1951–2000 rain gauge data (Meyer-Christoffer et al., 2018). Figure by Alena Giesche, reproduced from Giesche et al., 2023.
The story behind the Dharamjali Cave speleothem used for this climate reconstruction began more than 4200 years ago, when the stalagmite deep at the narrow and wet end of the cave started accumulating its distinct layers of calcium carbonate. Trapped within each layer were signals of the environment: more 18O isotopes when summer monsoons were weaker and fewer when the rains were stronger, less uranium or strontium during dry periods, more zinc and nickel as drip rates slowed and these metals had time to be incorporated into the growing stalagmite. Over thousands of years, the stalagmite continued to grow, marred occasionally by breaks or shifts in the growth axis (likely during strong earthquakes). At the same time, the uranium-thorium clock was ticking, as the once-soluble uranium was now trapped in the speleothem and decaying according to the laws of its half-life.
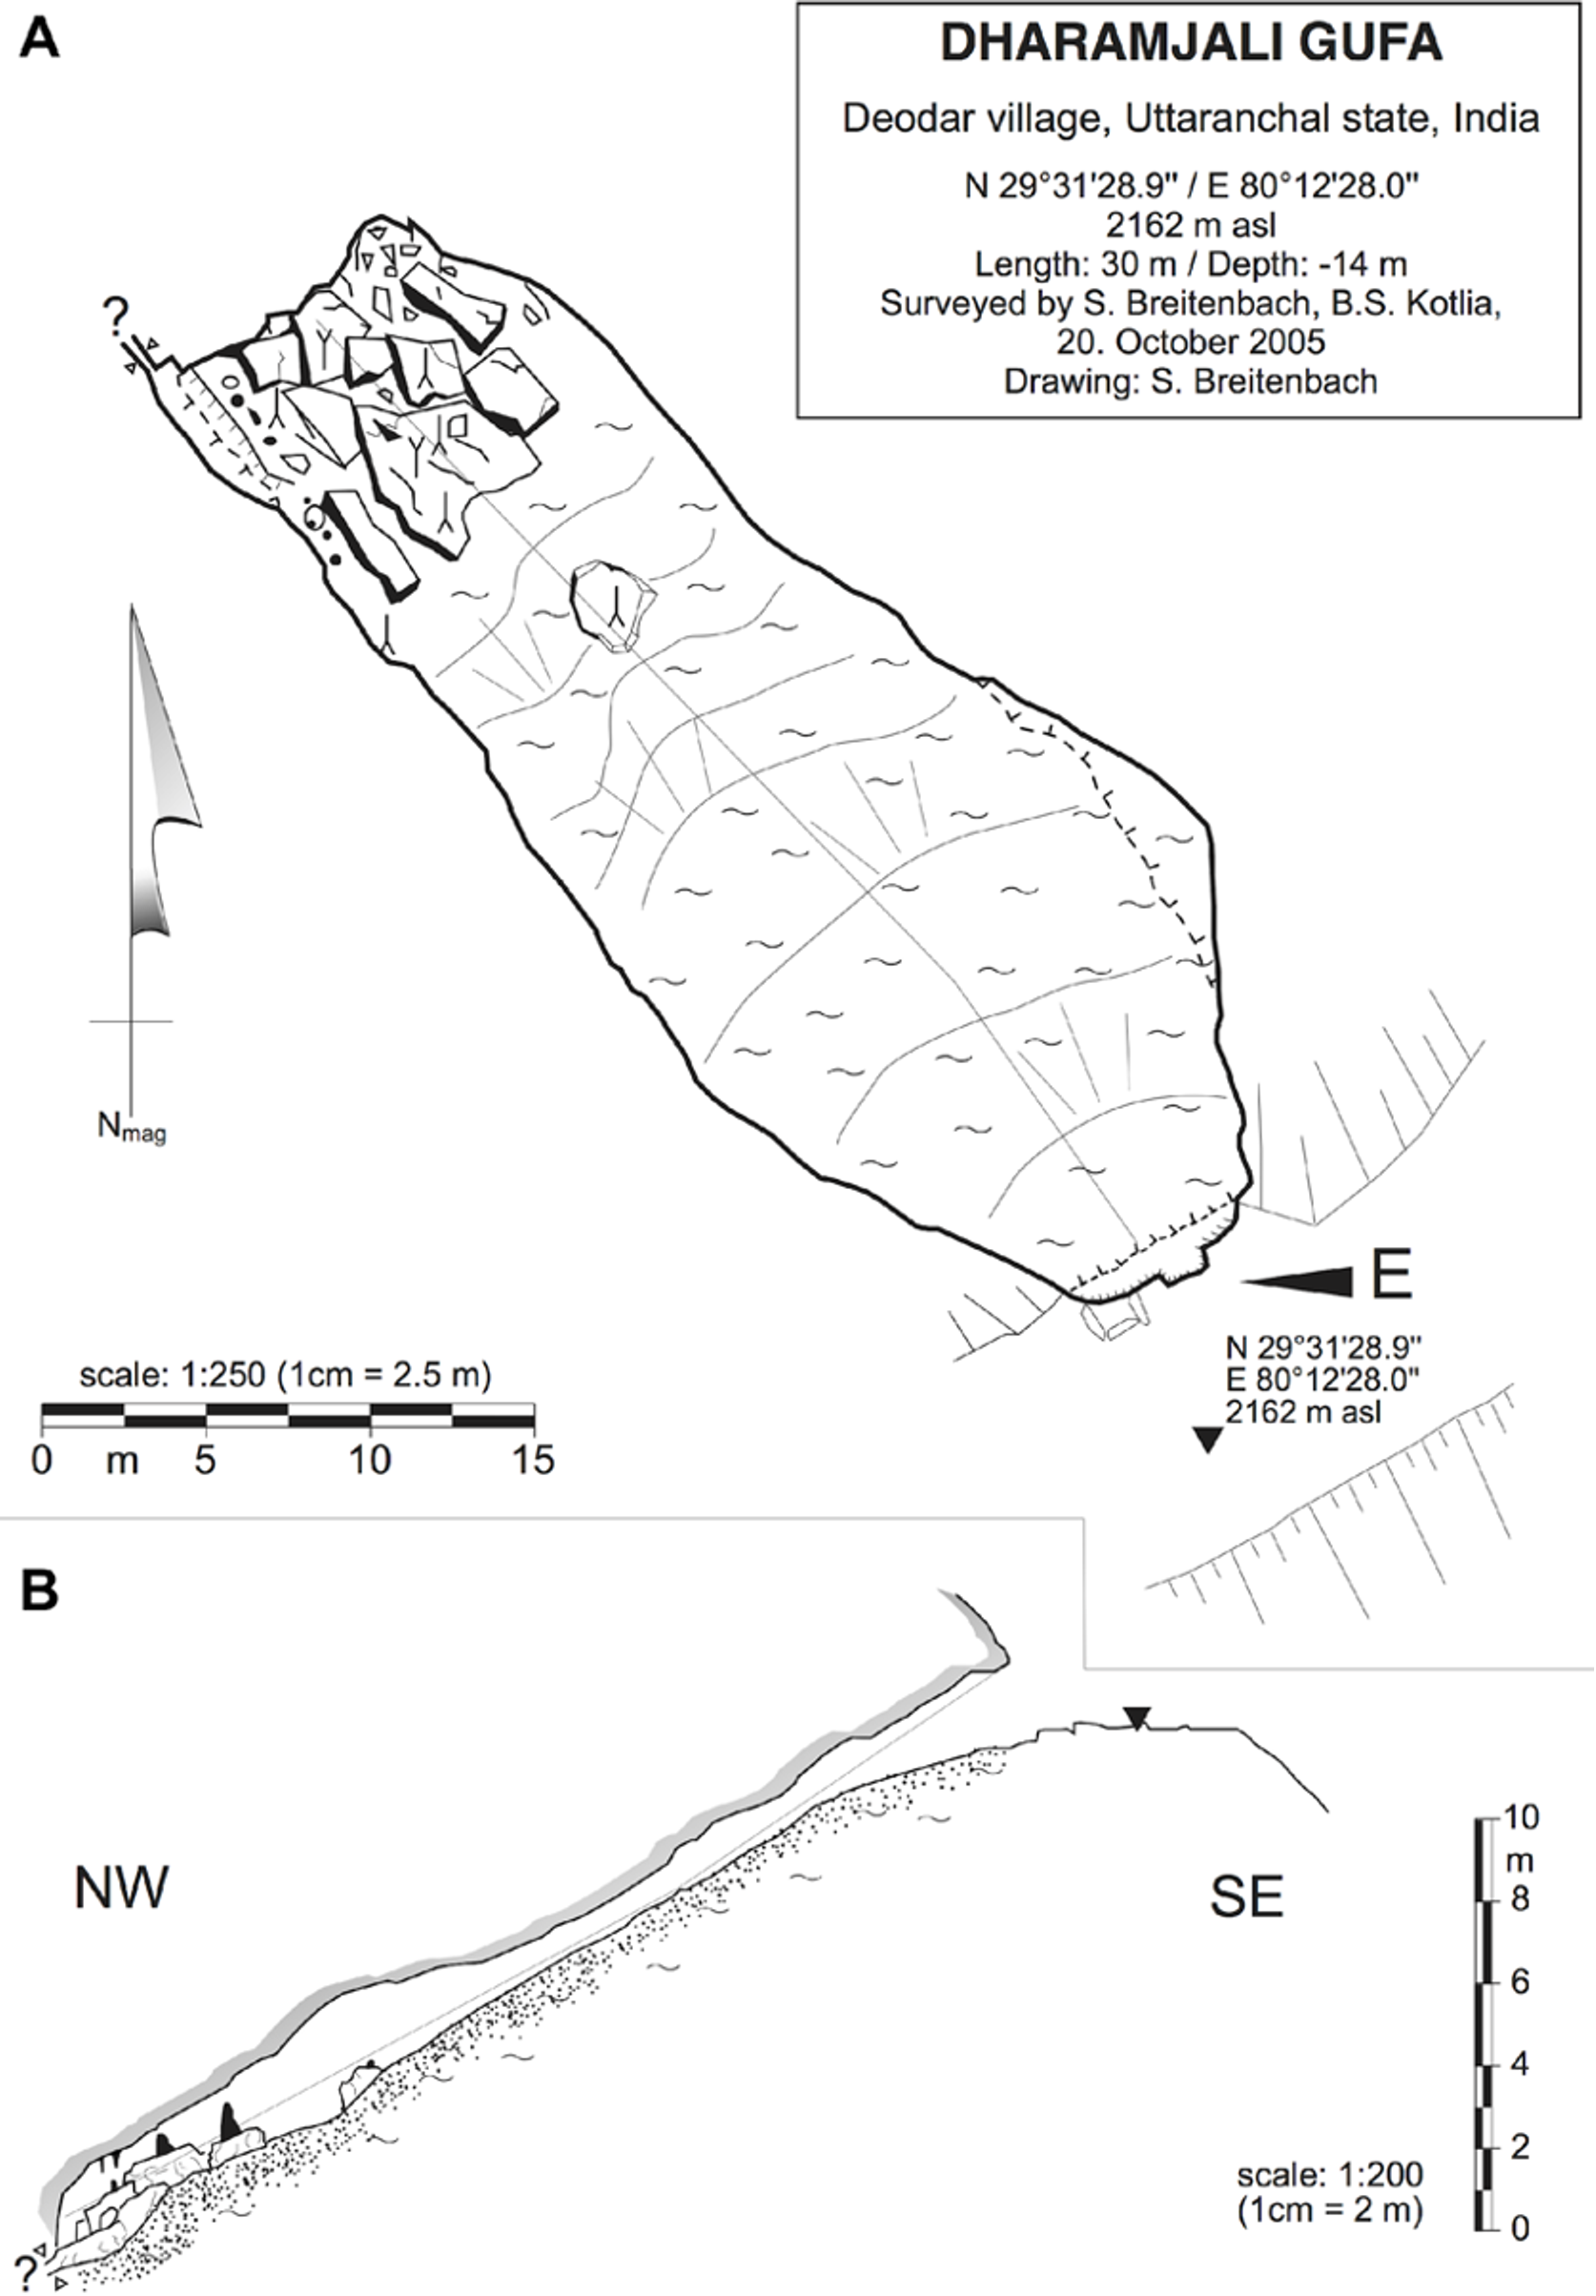
A top (A) and side view (B) of Dharamjali Cave. Figure drawn by Sebastian Breitenbach, reproduced from Giesche et al., 2023 (Supplementary Material).
In 2005, a team of scientists and locals from Deodar village in the lower northern Himalaya identified this speleothem as a candidate to reveal the region’s paleoclimate history. When you first identify a speleothem in a cave, you have no idea how old it may turn out to be. A wet or active drip spot on its surface may tell you that the speleothem has continued to accumulate until present, but speleothems can have radically different growth rates, include growth interruptions, be difficult to date because of detrital thorium contamination, or may simply not reflect their local environment in a consistent or straight-forward way. This stalagmite from Dharamjali Cave, however, turned out to be dateable at high precision (the age model has errors of ± 18 years, meaning that we can be confident that the fluctuations recorded by the stalagmite occurred when the age model suggests they did). It also covered a crucial time period from 4200 years ago with clean aragonite layers that captured environmental conditions of the next few centuries in high resolution. In later millennia, humans appear to have broken off the upper sections of the stalagmite so that the last few thousand years are not properly recorded in the carbonate deposit. The cave has been used as a shelter, and traces of human activity can be found all over it, including chunks of hollowed-out tree trunks used to collect water.
.png)
Deodar Village and surrounding forested landscape in 2005. Photos by Sebastian Breitenbach.
Over several years of investigation of this stalagmite, we realized that the climatic variations could be tracked using several independent methods. First, we measured the more commonly-investigated oxygen and carbon isotope ratios to infer Indian summer monsoon strength and dry season (wintertime) aridity. Initially these were just measured at low resolution, but promising results led to measurements repeated every 50 micrometers, which represent growth of less than one year’s worth of calcium carbonate. Each snapshot in time involved carefully milling a fraction of the stalagmite (about the width of a human hair). Then, we added the more novel and independent proxy, calcium isotopes, to track periods of drought in the epikarst (rock above the cave). Finally, we measured a suite of trace elements using laser ablation techniques in New Zealand, including uranium and strontium (which also react to water supply in the epikarst), and transition metals such as nickel and zinc (very novel proxies still in development, which appear to track the drip rate of water onto the speleothem).

High resolution micro-milling of the Dharamjali stalagmite at the University of Cambridge. Photo by Alena Giesche.
Remarkably, the different methods all independently pointed to a 230-year period of below-average moisture between 4200 and 3970 years ago. In yet more detail, we found three pronounced peaks in drought at 4.19, 4.11, and 4.02 thousand years ago lasting 25-90 years each, separated by 20-30-year brief recoveries. Based on the carbon isotopes, we noted that the droughts affected not only the summer monsoon months, but also the drier winter months.
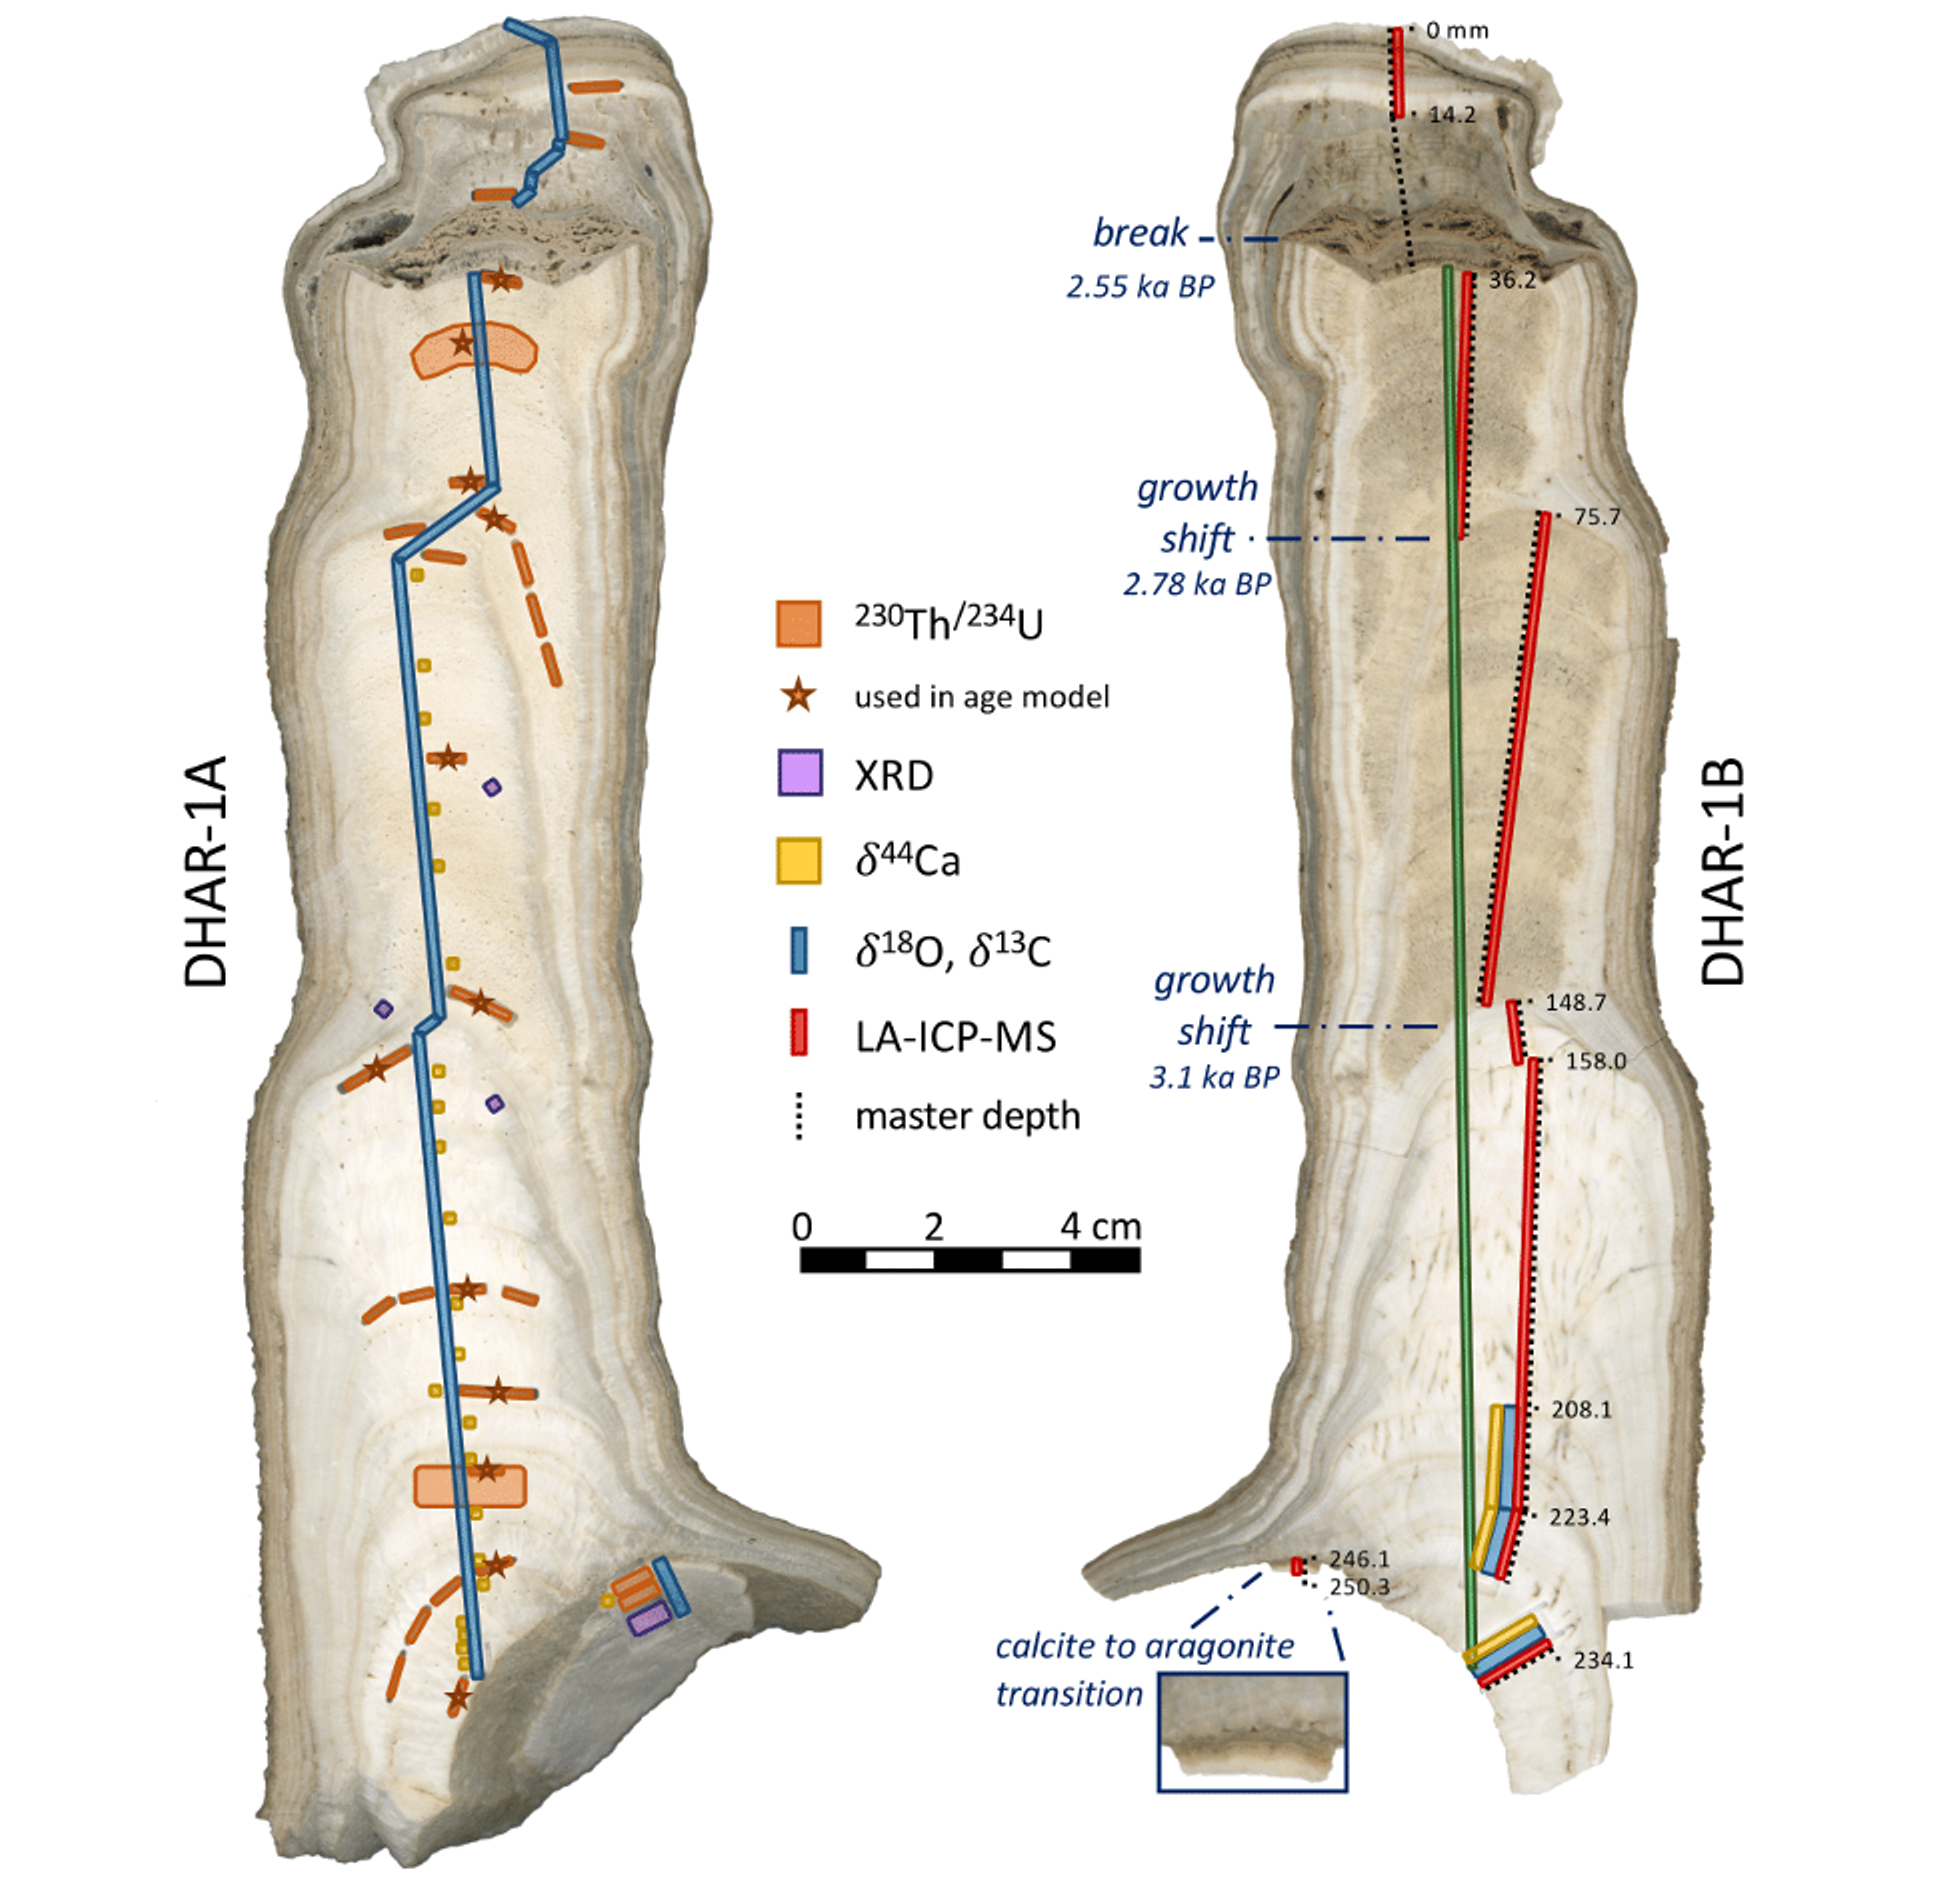
Overview of the various analyses performed on both halves of the Dharamjali DHAR-1 stalagmite. Orange areas represent areas sampled for U-Th dating, purple represents mineralogy analysis using XRD, yellow represents calcium isotope measurements, blue lines show where oxygen and carbon isotopes were milled, red lines show the tracks followed for trace element analysis by laser ablation, and the green line represents the track followed for XRF scanner measurements. Figure by Alena Giesche, reproduced from Giesche et al., 2023 (Supplementary Material).
The impact of such long and repeated periods of drought that extended throughout the entire year would have been significant for the regional population. The populations of the Indus Civilization relied on diverse cropping strategies that allowed them to be resilient to variations in rainfall (for example, growing multiple types of crops that require either winter or summer rainfall). However, a large and lengthy change in either or both of these rainfall patterns would have perturbed this system – to the point where people adapted their subsistence strategies to new rainfall conditions, and potentially moved to locations with a higher probability of rainfall. Indeed, after 4200 years ago, archaeologists find that large urban Indus sites began to show signs of stress, while smaller rural sites became more prominent in the eastern summer-rainfall dominated region.
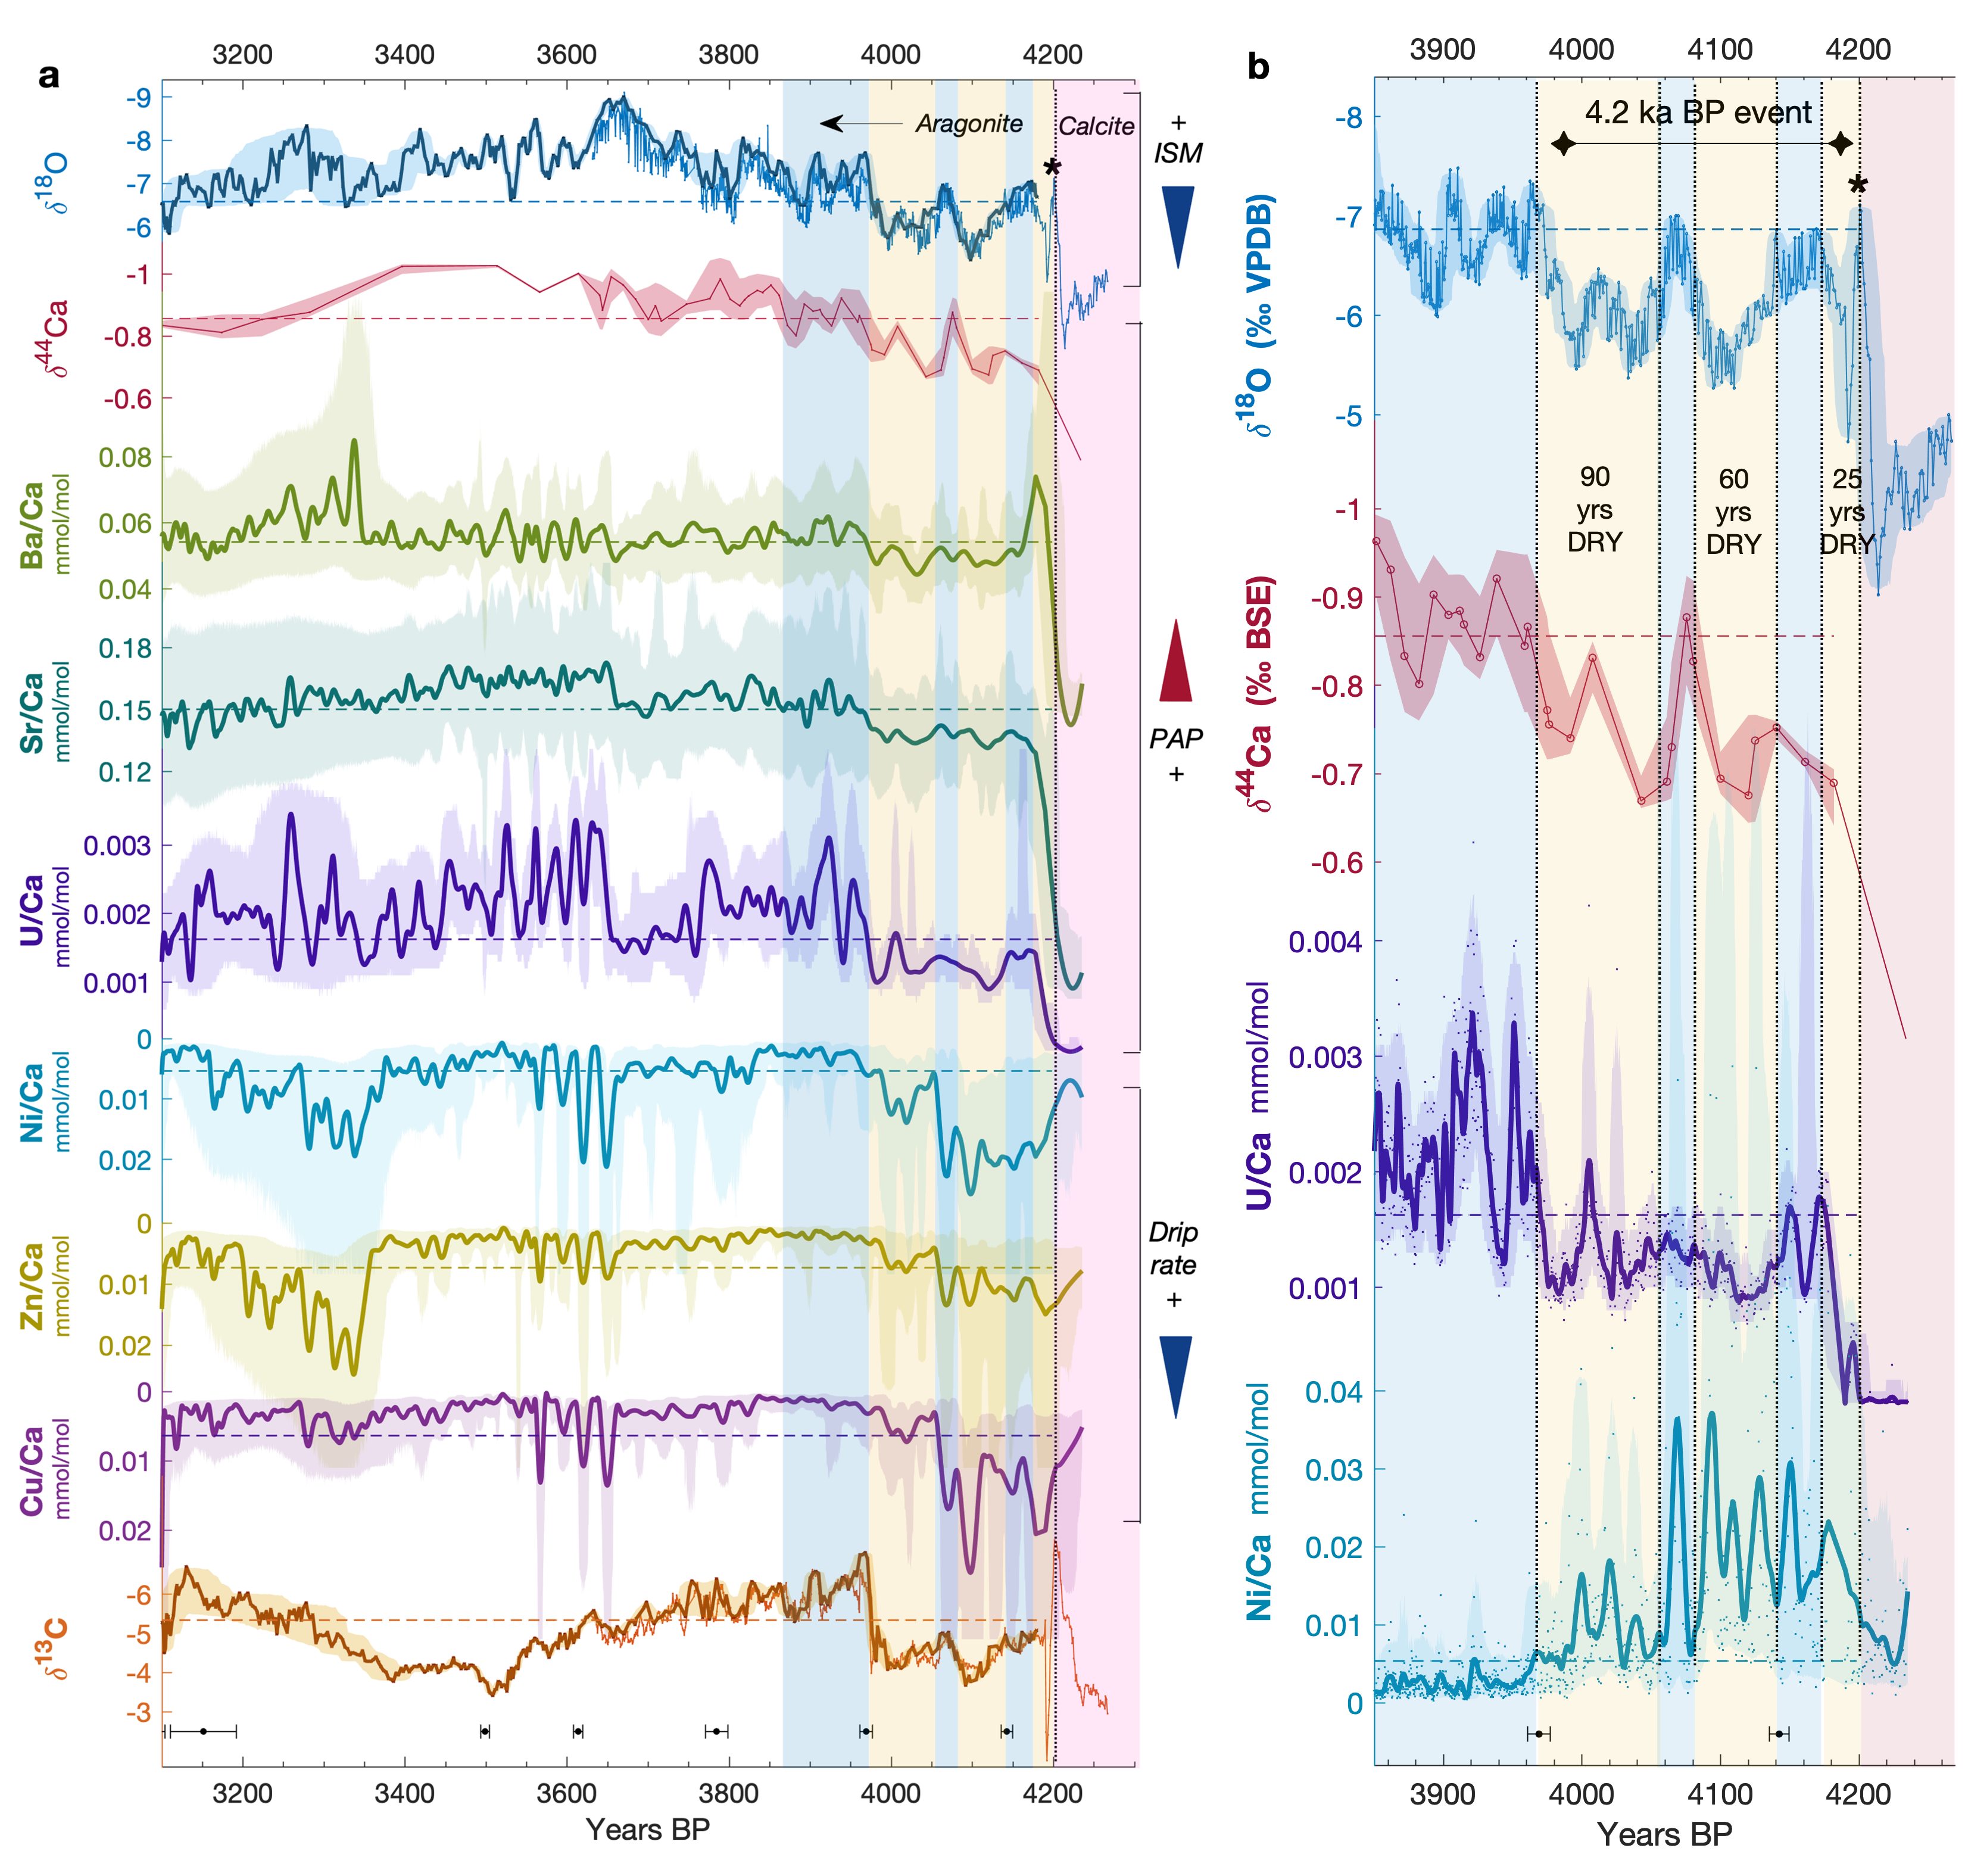
DHAR-1 proxies from 4.2-3.1 ka BP. (a) 4.27-3.1 ka BP DHAR-1 record with high-resolution δ18O, δ44Ca, and δ13C stable isotope time series (note reverse axes) and Ba/Ca, Sr/Ca, U/Ca, Ni/Ca, Zn/Ca, and Cu/Ca trace element data shown as 20-year LOESS smoothing curves. Dominant processes for the proxies are indicated with arrows on the right (Indian Summer Monsoon, prior aragonite precipitation, and drip rate). δ13C is not specified because it is affected by a (variable) combination of prior aragonite precipitation, cave ventilation, and long-term soil carbon changes driven by vegetation above the cave. (b) 4.27–3.85 ka BP in more detail covering the 4.2 ka event, with δ18O and δ44Ca stable isotope time series, and U/Ca and Ni/Ca with 10-year LOESS smoothing curves. The asterisk represents the transition from calcite to aragonite after a hiatus. For each series, shaded envelopes represent the 2.5 and 97.5% proxy confidence intervals, and horizontal dashed lines show the mean value over 4.2–3.1 ka BP. Vertical shaded bars denote relatively dry (yellow) and wet (blue) intervals between 4.27 and 3.85 ka BP. U-series dates with ±2σ error bars are shown at the bottom of the graphs above the lower age axes. Figure by Alena Giesche, reproduced from Giesche et al., 2023.
The Dharamjali speleothem palaeoclimate record is the latest high-resolution and well-dated speleothem record from this region, where only a handful of others exist. It is unique in its ability to cover the time period after 4200 years ago in high resolution, with a suite of analyses that independently reconstruct drought conditions from both the summer monsoon and wintertime. We need more such well-dated records to elucidate the regional dynamics in both environmental change and human behavior, particularly from understudied regions that are very sensitive to winter rainfall changes. This includes Pakistan and Afghanistan, countries with a very rich history. Joining forces across disciplines helps us to put our findings into a common framework and better understand how people reacted to past climatic changes. There might be important lessons to be learned with regards to mitigation strategies in a modern world facing anthropogenic climate change.
Completing this research could not have happened without our large and diverse team, with members from several countries and analytical contributions from around the world. The latter part of this project was funded by the TwoRains ERC project (grant number 648609). Additional funding for co-authors of this publication included the German Science Foundation (DFG projects MA4759/9-1 and MA4759/11-1, the European Union's Horizon 2020 program (QUEST project, grant agreement no 691037), the Global Challenges Research Fund’s TIGR2ESS project (BB/P027970/1), the Rutherford Discovery Fellowship (RDF-UOW1601) and NERC NE/R013519/1. A big thank you goes out to the local residents in Deodar village who facilitated the caving expedition.
References mentioned in this post:
Giesche, A., Hodell, D.A., Petrie, C.A., Haug, G. H., Adkins, J. F., Plessen, B., Marwan, N., Bradbury, H. J., Hartland, A., French, A. D., Breitenbach, S. F. M. Recurring summer and winter droughts from 4.2-3.97 thousand years ago in north India. Commun Earth Environ 4, 103 (2023). https://doi.org/10.1038/s43247-023-00763-z
Meyer-Christoffer, A., Becker, A., Finger, P., Schneider, U., Ziese, M. Data from “GPCC Climatology Version 2018 at 0.25°: Monthly Land-Surface Precipitation Climatology for Every Month and the Total Year from Rain-Gauges built on GTS-based and Historical Data.” GPCC at DWD. Available at https://doi.org/ 10.5676/DWD_GPCC/CLIM_M_V2018_025, Deposited 2018.
Follow the Topic
-
Communications Earth & Environment

An open access journal from Nature Portfolio that publishes high-quality research, reviews and commentary in the Earth, environmental and planetary sciences.
Related Collections
With Collections, you can get published faster and increase your visibility.
Archaeology & Environment
Publishing Model: Hybrid
Deadline: Mar 31, 2026
Drought
Publishing Model: Hybrid
Deadline: Mar 31, 2026


Please sign in or register for FREE
If you are a registered user on Research Communities by Springer Nature, please sign in