Observationally constrained global NOx and CO emissions variability reveals sources which contribute significantly to CO2 emissions
Published in Earth & Environment and Sustainability
Unveiling the Hidden Signal of Pollution: A Satellite-Driven Quest to Map Earth’s Invisible Emissions
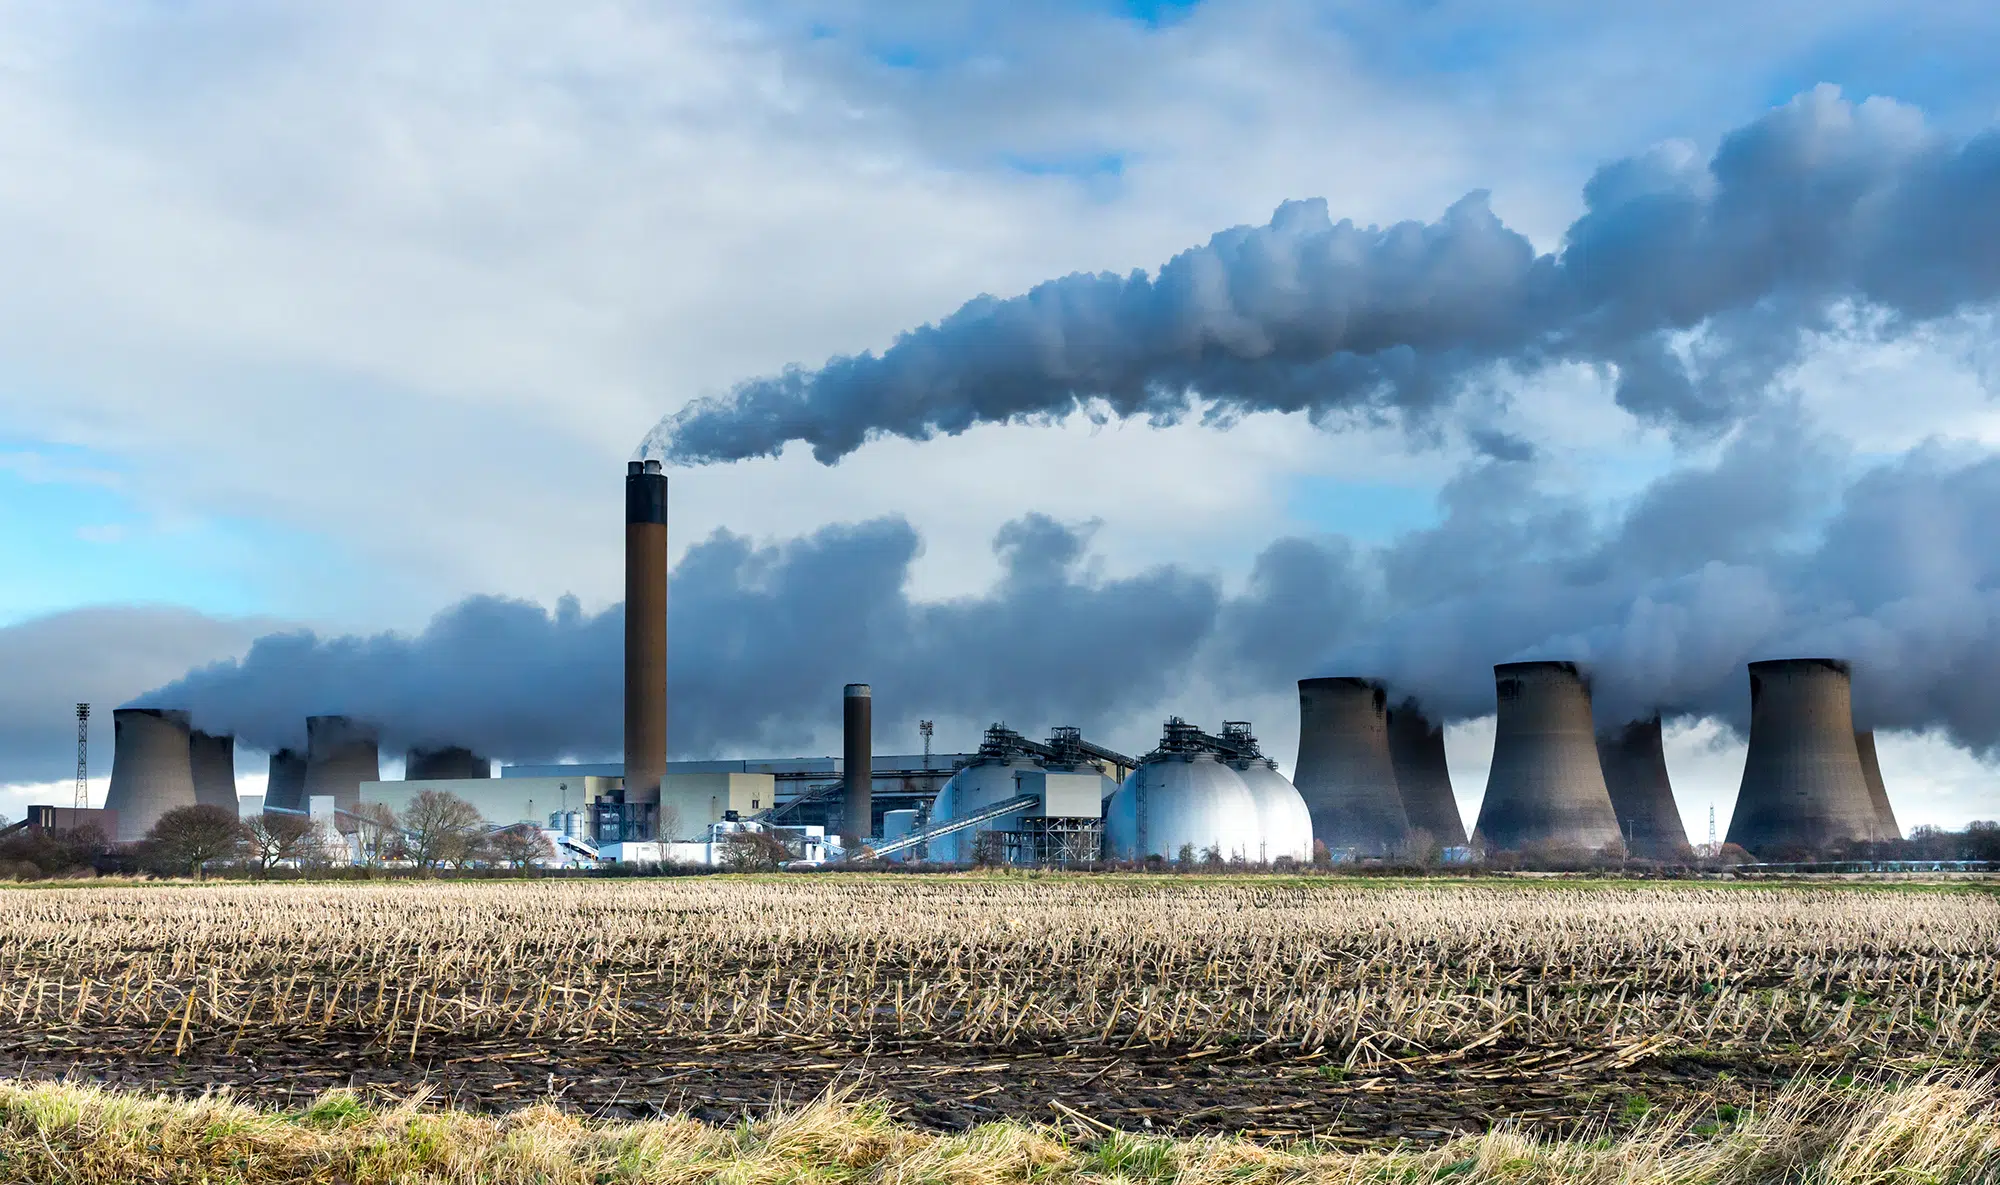
When climate conversations heat up, carbon dioxide (CO2) frequently grabs the headlines. Yet, quietly overlooked, nitrogen oxides (NOx) and carbon monoxide (CO) linger in the atmosphere, intricately involved in processes that amplify and contribute to CO2- and methane-driven climate change. Traditional emission-tracking methods—built from static bottom-up inventories—often falter in capturing reality's rapid and unpredictable shifts, such as wildfires sweeping through the Amazon or sudden industrial expansion in Asia.
Driven by the necessity to grasp pollution's dynamic heartbeat, we turned to the skies. Satellites like OMI and MOPITT offer a unique and powerful vantage point, providing daily snapshots of NO2 and CO worldwide. But raw data alone doesn't suffice. Recognizing the gap, we developed the Mass-Conserving Model-Free Emissions (MCMFE) approach and embedded it in the SVD analytical approach—a flexible framework to interpret these snapshots without rigid assumptions and in a unbiased manner.
Our investigation revealed unexpected emission hotspots: CO emissions from Central African biomass burning alone raised local CO2 levels by 3.5%, and NOx emissions in the Amazon surged up to 15 times higher than previously thought. Across all studied regions, emissions averaged more than double existing estimates, underscoring significant gaps in current pollution inventories. These findings not only reshape our understanding of global emissions but also challenge existing assumptions used in climate impact assessments.
Ultimately, our research isn't merely academic—it’s a call for better-informed climate policies. By harnessing satellites to observe, identify, and quantify Earth’s unseen emissions, we're empowering policymakers with the precision tools needed to enact effective environmental stewardship in real time, helping provide the monitoring and verification required to support a clearer and more sustainable future.
Observing Pollution from Space in Earth's Rapidly Changing Regions
Have you ever wondered how scientists keep an eye on pollution all around the globe? Traditionally, emissions of pollutants like nitrogen dioxide (NO2) and carbon monoxide (CO) are tracked using data collected from factories, cars, and periodic ground measurements. But these methods often miss short-term spikes and unexpected pollution events, like massive wildfires or rapid industrial growth, leaving gaps in our understanding. To address this, we turned to satellites that scan Earth's atmosphere every day. By combining satellite observations with our newly developed approach, called the Mass-Conserving Model-Free Emissions (MCMFE), we created detailed maps showing exactly when and where pollution happens. Our results demonstrate that pollution levels during events such as forest fires in the Amazon and biomass burning in Central Africa are significantly higher than traditional estimates suggest, reshaping our understanding of the global distribution of these pollutants.

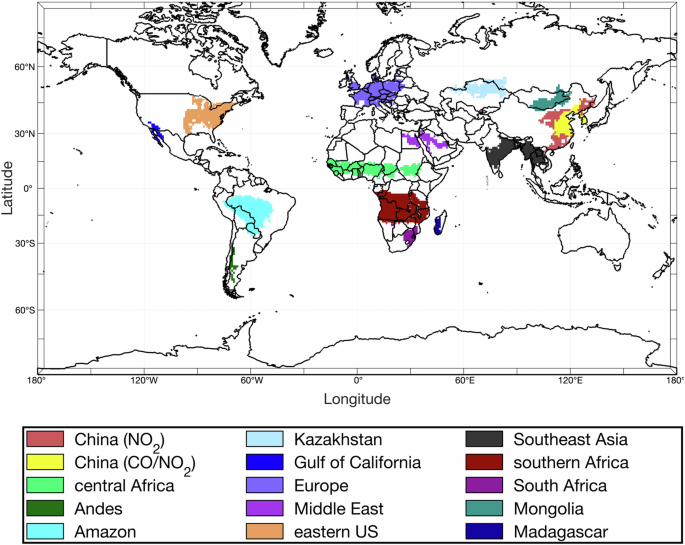
Geographic distribution of all 15 subregions derived from SVD1 which including positive and negative of NO2 and CO geographical decomposition signal.
Discovering Hidden Pollution Sources
As we compared our new satellite-driven pollution maps to existing global emissions databases, a pattern emerged—there were hidden pollution hotspots that appeared, where traditional methods had detected none. Specifically, our research showed that Central Africa and industrial zones in China produce much more CO and NO2 than previously known. For instance, CO emissions in Central Africa turned out to be up to 12.6 times higher, and NO2 emissions in the Amazon were up to 15 times greater than prior estimates. Additionally, we found evidence that industries and urban regions consistently emitted more pollutants than officially reported, challenging previous assumptions about improving efficiency in fuel combustion processes. By uncovering these hidden sources of pollution, our work helps pinpoint precisely where efforts and resources should be focused to tackle air pollution globally, benefiting human health and the climate.
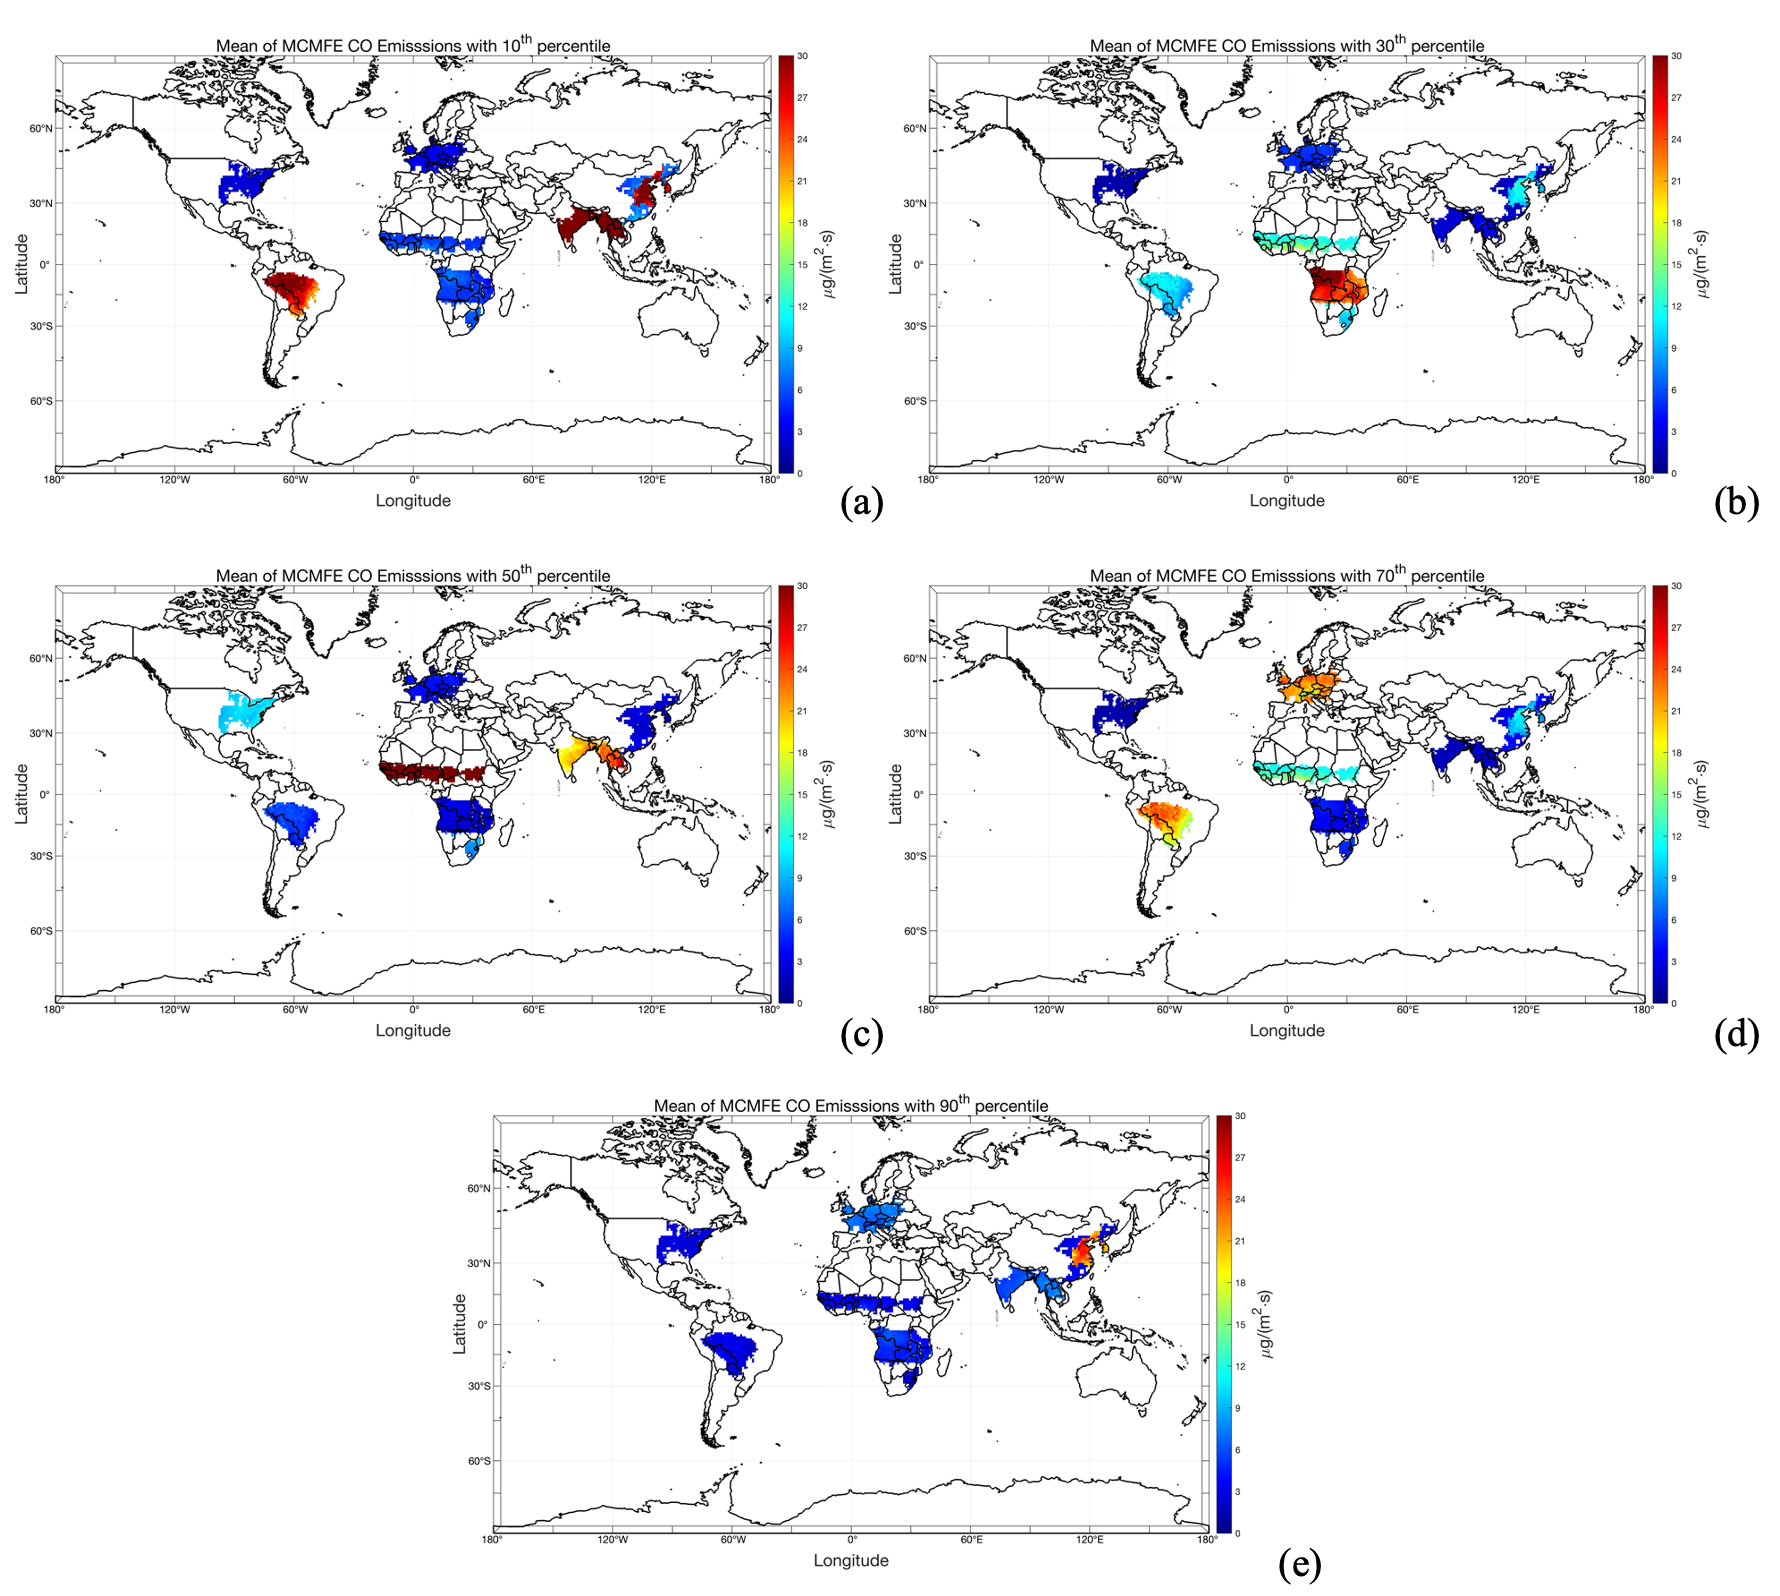
]. (a) the 10th percentile; (b) the 30th percentile; (c) the 50th percentile; (d) the 70th percentile; (e) the 90th percentile.")
Mean of MCMFE NOx emissions with different percentiles coefficients based on the merged a priori emissions and MCMFE in 2010 [ug•(m-2•s-1)]. (a) the 10th percentile; (b) the 30th percentile; (c) the 50th percentile; (d) the 70th percentile; (e) the 90th percentile.
Mean of MCMFE NOx emissions with different percentiles coefficients based on the merged a priori emissions and MCMFE in 2010 [ug•(m-2•s-1)]. (a) the 10th percentile; (b) the 30th percentile; (c) the 50th percentile; (d) the 70th percentile; (e) the 90th percentile.
Connecting CO Emissions to Global CO2 Levels
When we think about climate change, carbon dioxide (CO2) usually comes to mind, but few realize that carbon monoxide (CO), another significant pollutant, is also important! Once it is emitted into the atmosphere, it will eventually convert into additional CO2. Our analysis quantified this overlooked chemical process and revealed striking findings. In places like the Amazon and Central Africa, CO emissions from fires and biomass burning transform chemically into CO2, adding significantly to regional CO2 totals—by as much as 6.1% and 3.5% annually, respectively. This indirect emission of CO2 has never before been adequately accounted for in global emissions inventories. Highlighting this invisible pathway emphasizes the critical need to manage not just direct CO2 emissions but also pollutants like CO that indirectly boost global warming. Understanding and managing these indirect contributions is vital for achieving accurate global emissions tracking and effective climate action.
Key Takeaways:
1. Satellites Provide a Better Picture of Global Pollution
Traditional emission inventories miss many details, especially short-term events and rapidly changing emissions. Our satellite-based MCMFE method captures global NO2 and CO emissions at unprecedented daily-to-weekly resolution, revealing hidden sources and emission peaks previously unaccounted for.
2. Emissions Are Significantly Underestimated in Current Inventories
We found major discrepancies between our satellite-based findings and traditional inventories. For example, CO emissions in Central Africa and NO2 emissions in the Amazon were up to 12.6 and 15 times higher than previously reported, respectively, showing that conventional methods drastically underestimate real-world pollution.
3. Indirect Contributions to CO2 Emissions Are Important
CO emitted from biomass burning and other sources chemically converts into CO2 in the atmosphere, contributing significantly to regional CO2 budgets. This indirect emission pathway—previously overlooked—highlights the urgent need for integrated pollution management strategies.
4. Pollution Events are Highly Variable in Space and Time
Pollution doesn't follow uniform patterns. Instead, it fluctuates greatly depending on factors such as weather, industrial activities, biomass burning, and other similar factors which drive variation of human and natural systems. Our approach accurately observes and quantifies these fluctuations, emphasizing the importance of real-time, dynamic pollution tracking.
Future Research Avenues:
1. Extending Satellite-Based Emission Tracking to More Pollutants
Building upon our success tracking NO2 and CO, future research could apply the MCMFE method to other atmospheric pollutants like methane (CH4), black carbon, or volatile organic compounds (VOCs). Expanding this satellite-based inventory would enable comprehensive understanding of global atmospheric chemistry and climate change drivers.
2. Improving Emission Estimates in Data-Poor Regions
Many areas—especially in the Global South—still lack adequate pollution monitoring. Enhancing the accuracy of satellite-based estimates in these under-monitored regions would significantly improve global pollution assessments, leading to better-targeted interventions and international climate policies.
3. Integrating Satellite Data into Real-Time Policy Decisions
Another promising research direction involves developing systems that directly feed satellite-derived emissions data into real-time policy tools. This integration could dramatically improve how quickly and effectively governments respond to sudden pollution spikes or extreme events like wildfires and industrial accidents.
Follow the Topic
-
npj Climate and Atmospheric Science
This journal is dedicated to publishing research on topics such as climate dynamics and variability, weather and climate prediction, climate change, weather extremes, air pollution, atmospheric chemistry, the hydrological cycle and atmosphere-ocean and -land interactions.

Related Collections
With Collections, you can get published faster and increase your visibility.
Atmosphere-Biosphere Interactions
Publishing Model: Open Access
Deadline: Oct 31, 2026
AI-Driven Innovation in Atmospheric Chemistry and Composition–Climate Interactions
Publishing Model: Open Access
Deadline: Oct 31, 2026


Please sign in or register for FREE
If you are a registered user on Research Communities by Springer Nature, please sign in