Reclassifying tumour cell cycle activity in terms of its tissue of origin
Published in Cancer

The ideal dataset for this study would have been one with RNA-expression data from hundreds of normal and tumour samples that are paired on an individual patient level. Whilst The Cancer Genome Atlas (TCGA) offers hundreds of cancer samples, the number of those with matching normal tissue is limited. For this reason we chose to combine the pan-cancer TCGA dataset with normal tissue from the Genotype-Tissue Expression (GTEx) dataset. Luckily for us, these two datasets had been reprocessed, normalised and batch-corrected together as a part of the Toil recompute project.
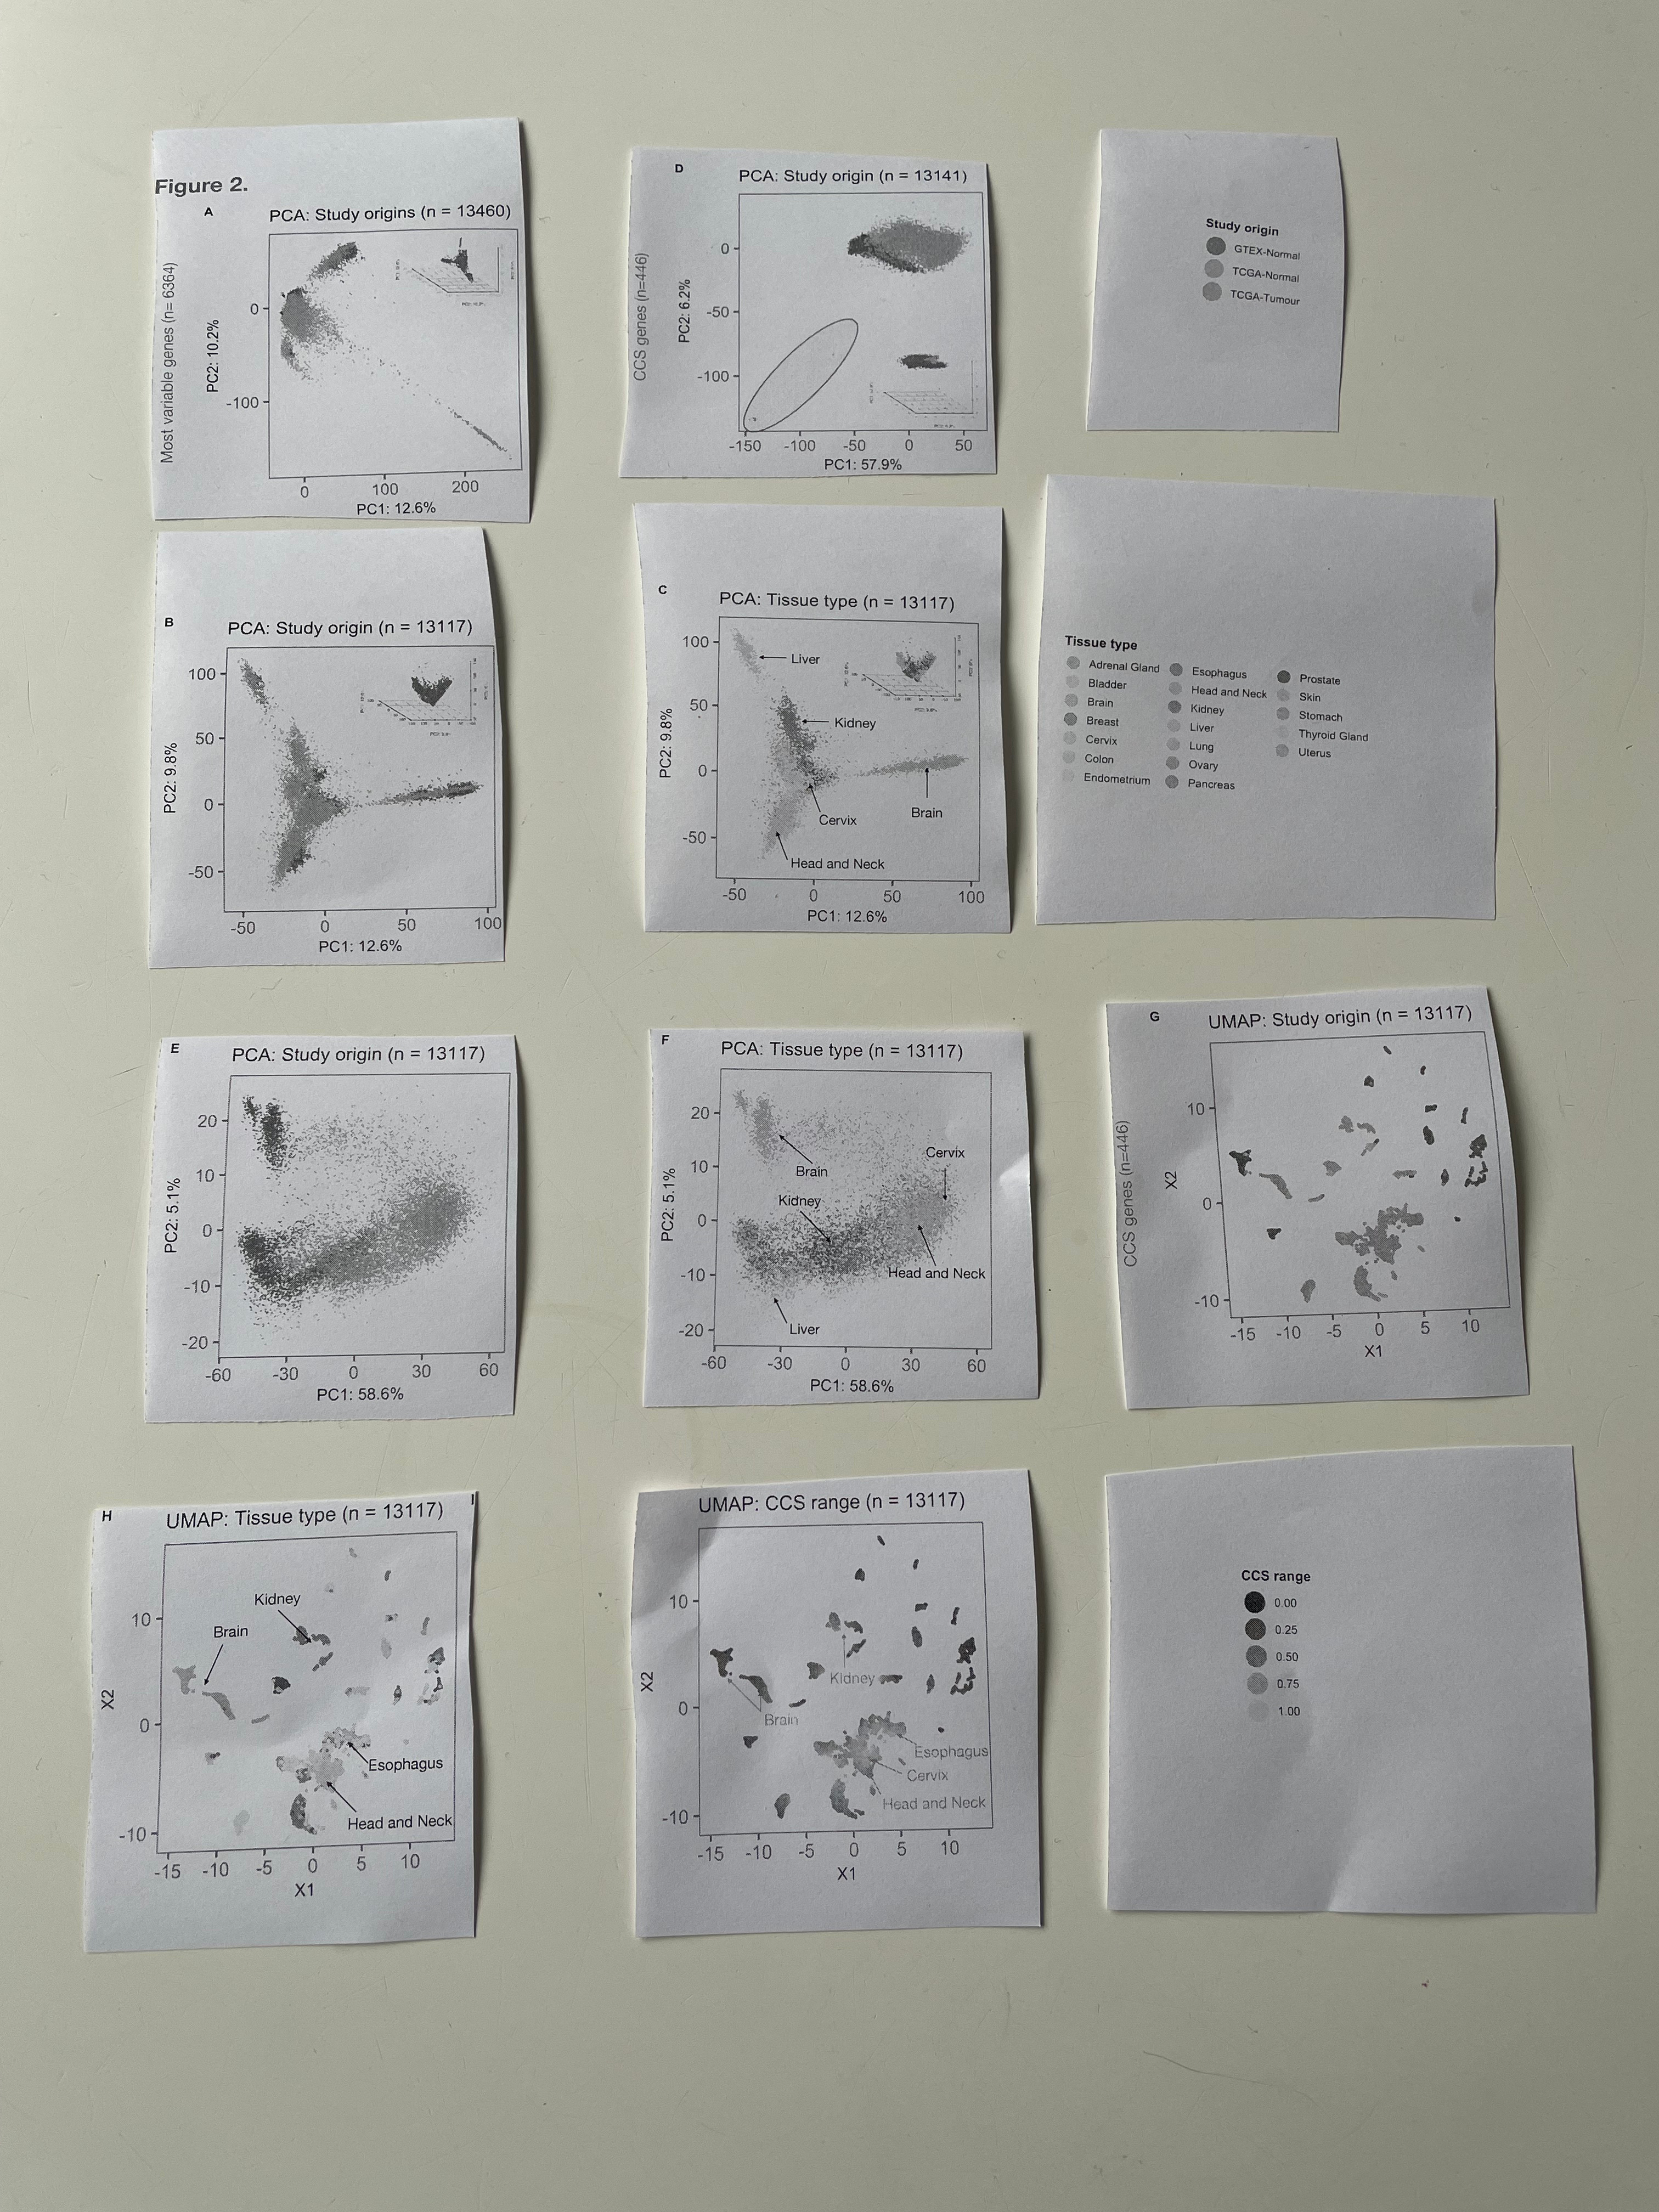
We downloaded this corrected data from UCSC XENA website and performed exhaustive exploratory plots in order to understand if batch effects remained in the dataset owing to them coming from two independent studies. Arian Lundberg and Joan Jong Yi in particular spent approximately 5-6 months on this process which also included the cleaning and annotation of the data. At this stage we noted that when plotting on the basis of the most variable genes across all samples, a long tail of samples stretching into the lower right quadrant was apparent using Principal Component Analysis (shown in Supplementary Figure 1A coloured in red, and Supplementary Figure 1B in the manuscript). Closer inspection of these samples showed all were GTEx normal testicular tissue, indicating a potential study of origin batch effect and as such all normal and cancer testicular samples were removed from further analyses (N = 319).
This long process of exploratory data analysis yielded many different plots and we had a tough time deciding out how to organise them into a coherent figure. Here’s a picture of our early attempts using individually printed plots as jigsaw pieces, this made it easier to re-organise and move around the figures until we were satisfied with a figure that made sense. Other additional positive benefits to this exploratory data analysis process were that it gave us the confidence in the data we required to proceed with the planned project and also helped to defend our work during the review process. Bioinformaticians and biostatisticians often speak to the importance of plotting your data before beginning any analysis and this mantra once again rang true for us in this study.

We were now finally able to plot both datasets together on a single boxplot and place normal and tumour tissue from the same organ/site together. Whilst this figure ended up being quite wide, we knew it was important to show all tissues together to make for easier comparison (Shown below and as Figure 3A in the paper). It's also nice to highlight here that Arian Lundberg made many versions of this with various colour schemes before we finally agreed on this one!

The arrows in the above image highlight the entire reason for performing this study, here's how we describe it in the paper: "Bladder cancer (“BLCA”, red arrow) has higher cell cycle activity than glioblastoma multiforme (“GBM”, blue arrow), but normal levels of bladder cell cycle activity are much higher than that of brain tissue (compare “Bladder” to “Brain”, black arrows). This means that at the absolute level BLCA shows higher cell cycle activity levels than GBM, but at a relative level (relative to its baseline level in normal tissue) GBM’s cell cycle activity is much higher than BLCA."
Next, and in order to understand which tissue type shows the largest change in cell cycle activity/proliferation we subtracted the median value of the normal samples from its specific tumour type. It was striking to see that three gynaecological cancers (Cervical squamous cell carcinoma and endocervical adenocarcinoma, CESC; Ovarian serous cystadenocarcinoma and OV; and Uterine Carcinosarcoma) showed the highest change in cell cycle activity once correcting for background/normal tissue cell cycle levels (Figure 3B in the paper). Another unexpected finding here was that tumour types we had previously found to display the highest levels of cell cycle activity when considering pan-cancer samples only e.g. Head and Neck cancers [1], showed the lowest levels of background corrected cell cycle activity (BC-CCS). This is because the level of cell cycle activity in normal head and neck tissue is also very high (see Supplementary Fig. 3A) This suggests to us that there may be an upper level or "ceiling" on the level of cell cycle activity/ proliferation that cells can reach.
In the remainder of the study we aimed to discern why gynaecological cancer types have the highest BC-CCS levels and were able to partially attribute this to hormonal signalling and gene expression changes (Figures 4 and 5).
People drive projects and in line with this I need to give the majority of the credit for this work to Arian Lundberg who worked tirelessly on the project. Credit also to Joan Jong for initiating the study while in Stockholm for a short-term Bachelor's project, she came to us from Singapore just before Covid-19 hit. Finally, we would like to say a special thank you to the hundreds of scientists who have been involved in the GTEx and TCGA consortia, our work builds on your achievements to date.
References
-
Lundberg A, Lindström LS, Parker JS, Löverli E, Perou CM, Bergh J, Tobin NP. A pan-cancer analysis of the frequency of DNA alterations across cell cycle activity levels. Oncogene. 2020 Aug;39(32):5430–40.
Follow the Topic
-
npj Precision Oncology

An international, peer-reviewed journal committed to publishing cutting-edge scientific research in all aspects of precision oncology from basic science to translational applications to clinical medicine.
Related Collections
With Collections, you can get published faster and increase your visibility.
Tumor-type-agnostic biomarkers and treatments in oncology
Publishing Model: Open Access
Deadline: Mar 05, 2026
Emerging adjuvant and neo-adjuvant treatment approaches in solid tumors
Publishing Model: Open Access
Deadline: Mar 30, 2026


Please sign in or register for FREE
If you are a registered user on Research Communities by Springer Nature, please sign in