Space-based inversion reveals underestimated carbon monoxide emissions over Shanxi
Published in Earth & Environment and Sustainability
The Silent Threat: How Carbon Monoxide is Polluting Air and Changing Climate
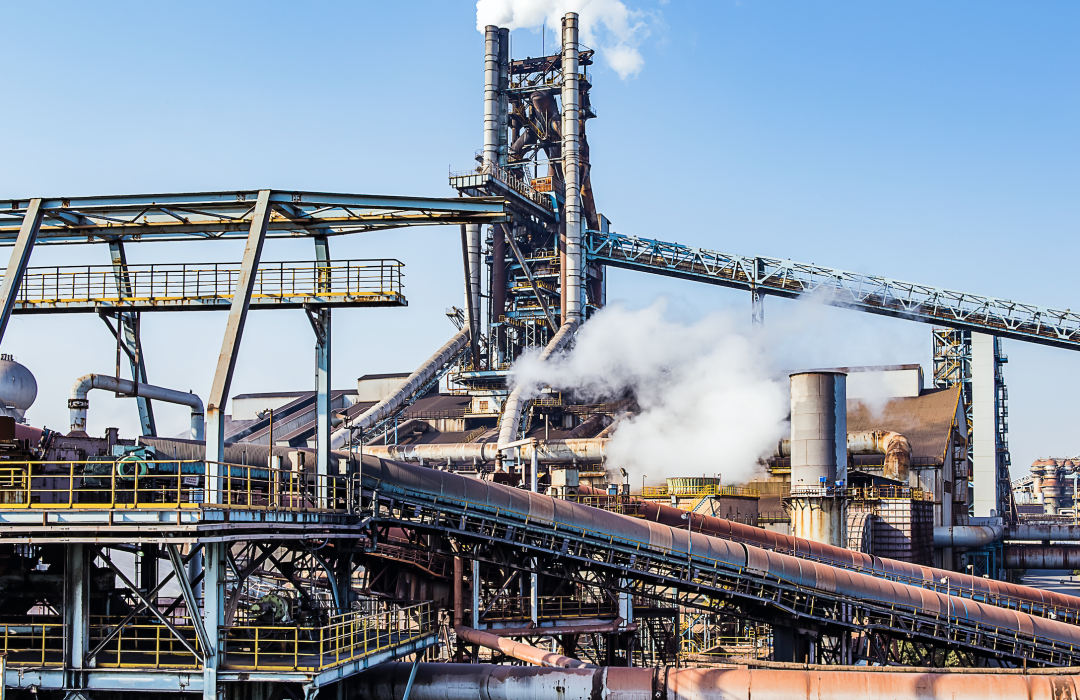
While most of the world focuses on well-known pollutants like nitrogen oxides and particulate matter, carbon monoxide (CO) has quietly slipped under the radar. Yet this colorless, odorless gas—often dismissed due to its relatively weak direct radiative forcing—plays a far more influential role in the atmosphere than previously acknowledged. Produced through incomplete combustion of fossil fuels, biomass, and industrial processes, CO doesn’t just degrade air quality—it also alters the chemistry of our skies and indirectly drives climate change.
CO’s environmental footprint extends far beyond its own presence in the atmosphere. It reduces the availability of hydroxyl radicals (OH), the “cleaning agents” of the atmosphere, which in turn extends the lifetime of more potent greenhouse gases like methane. It also contributes to ozone formation and eventually oxidizes into carbon dioxide. Many countries, including China, lack mandatory continuous monitoring of CO emissions, and standard inventories often oversimplify or overlook its diverse sources. The result is a pollutant that’s widely emitted, rarely tracked, and dangerously misunderstood—a silent threat to both air quality and climate policy.
Satellites Expose a Massive Carbon Monoxide Gap in Shanxi
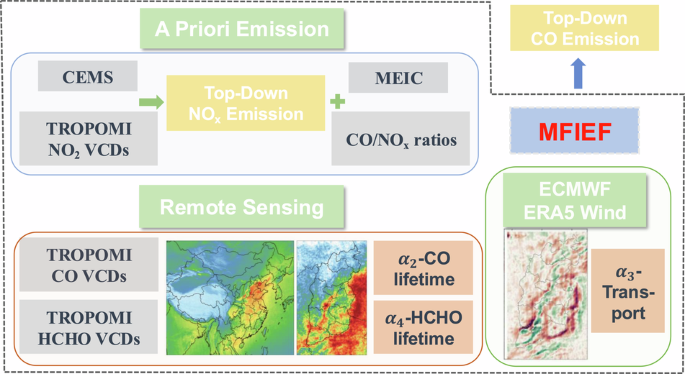
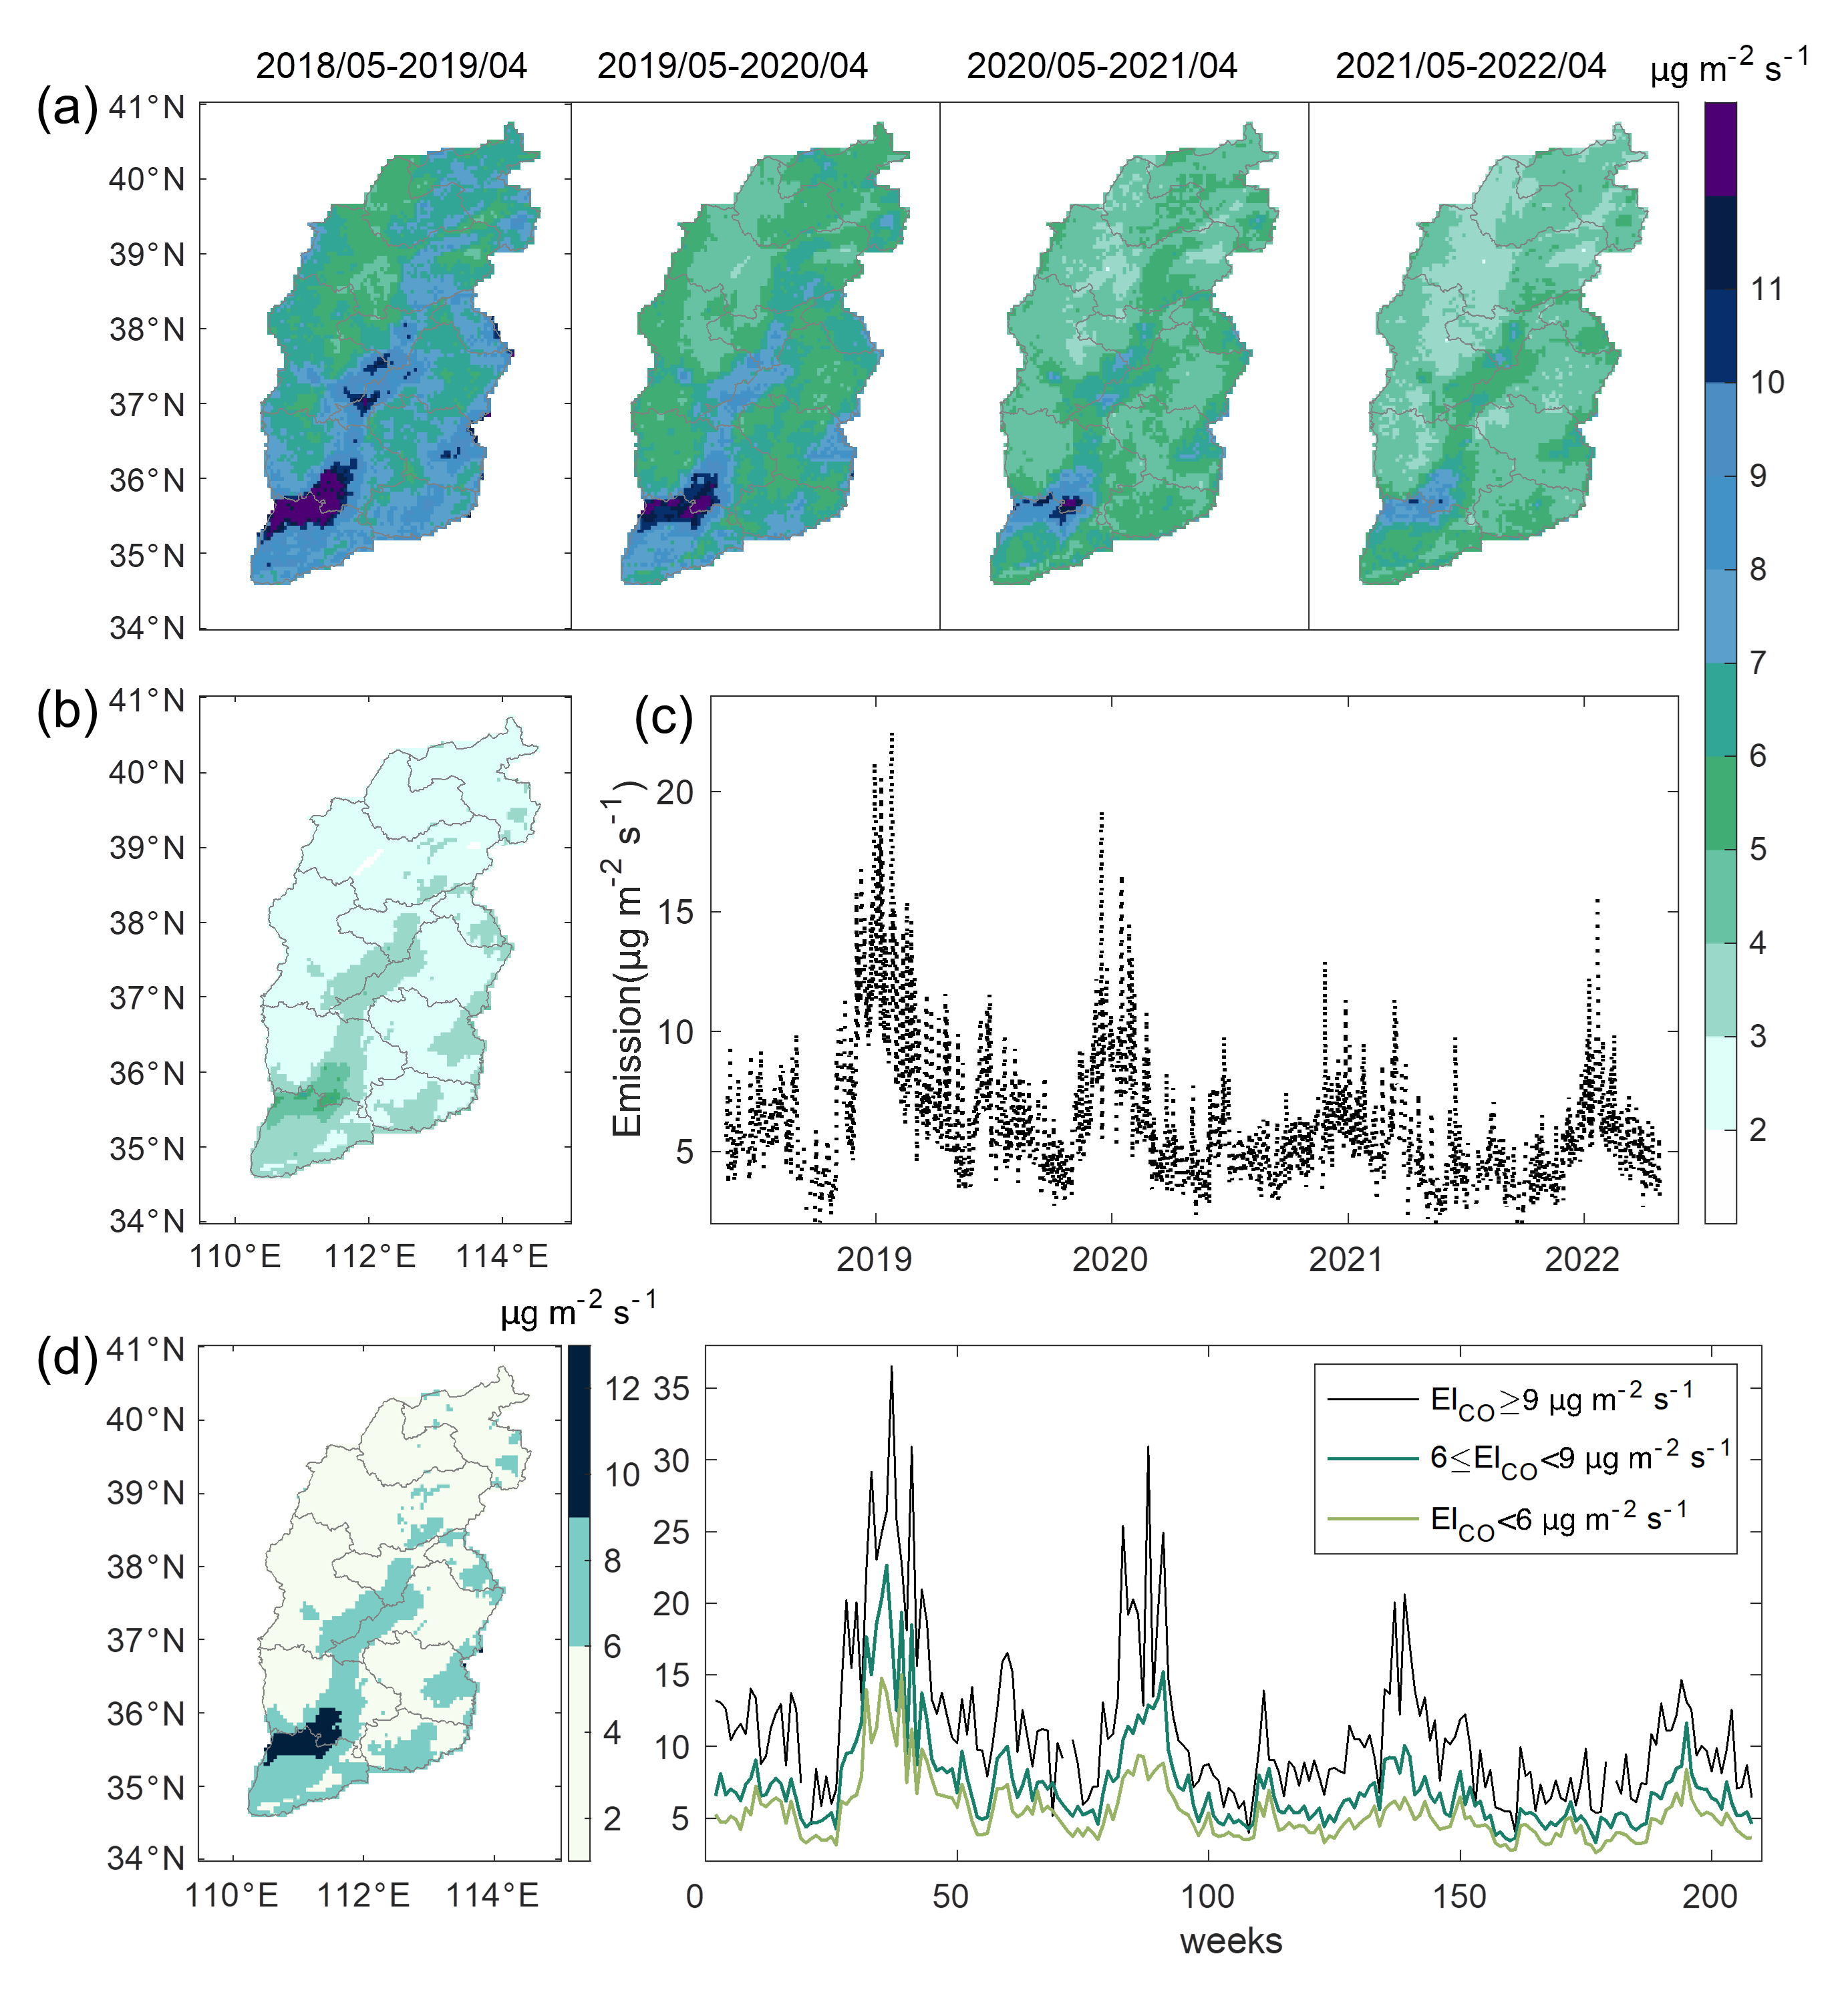
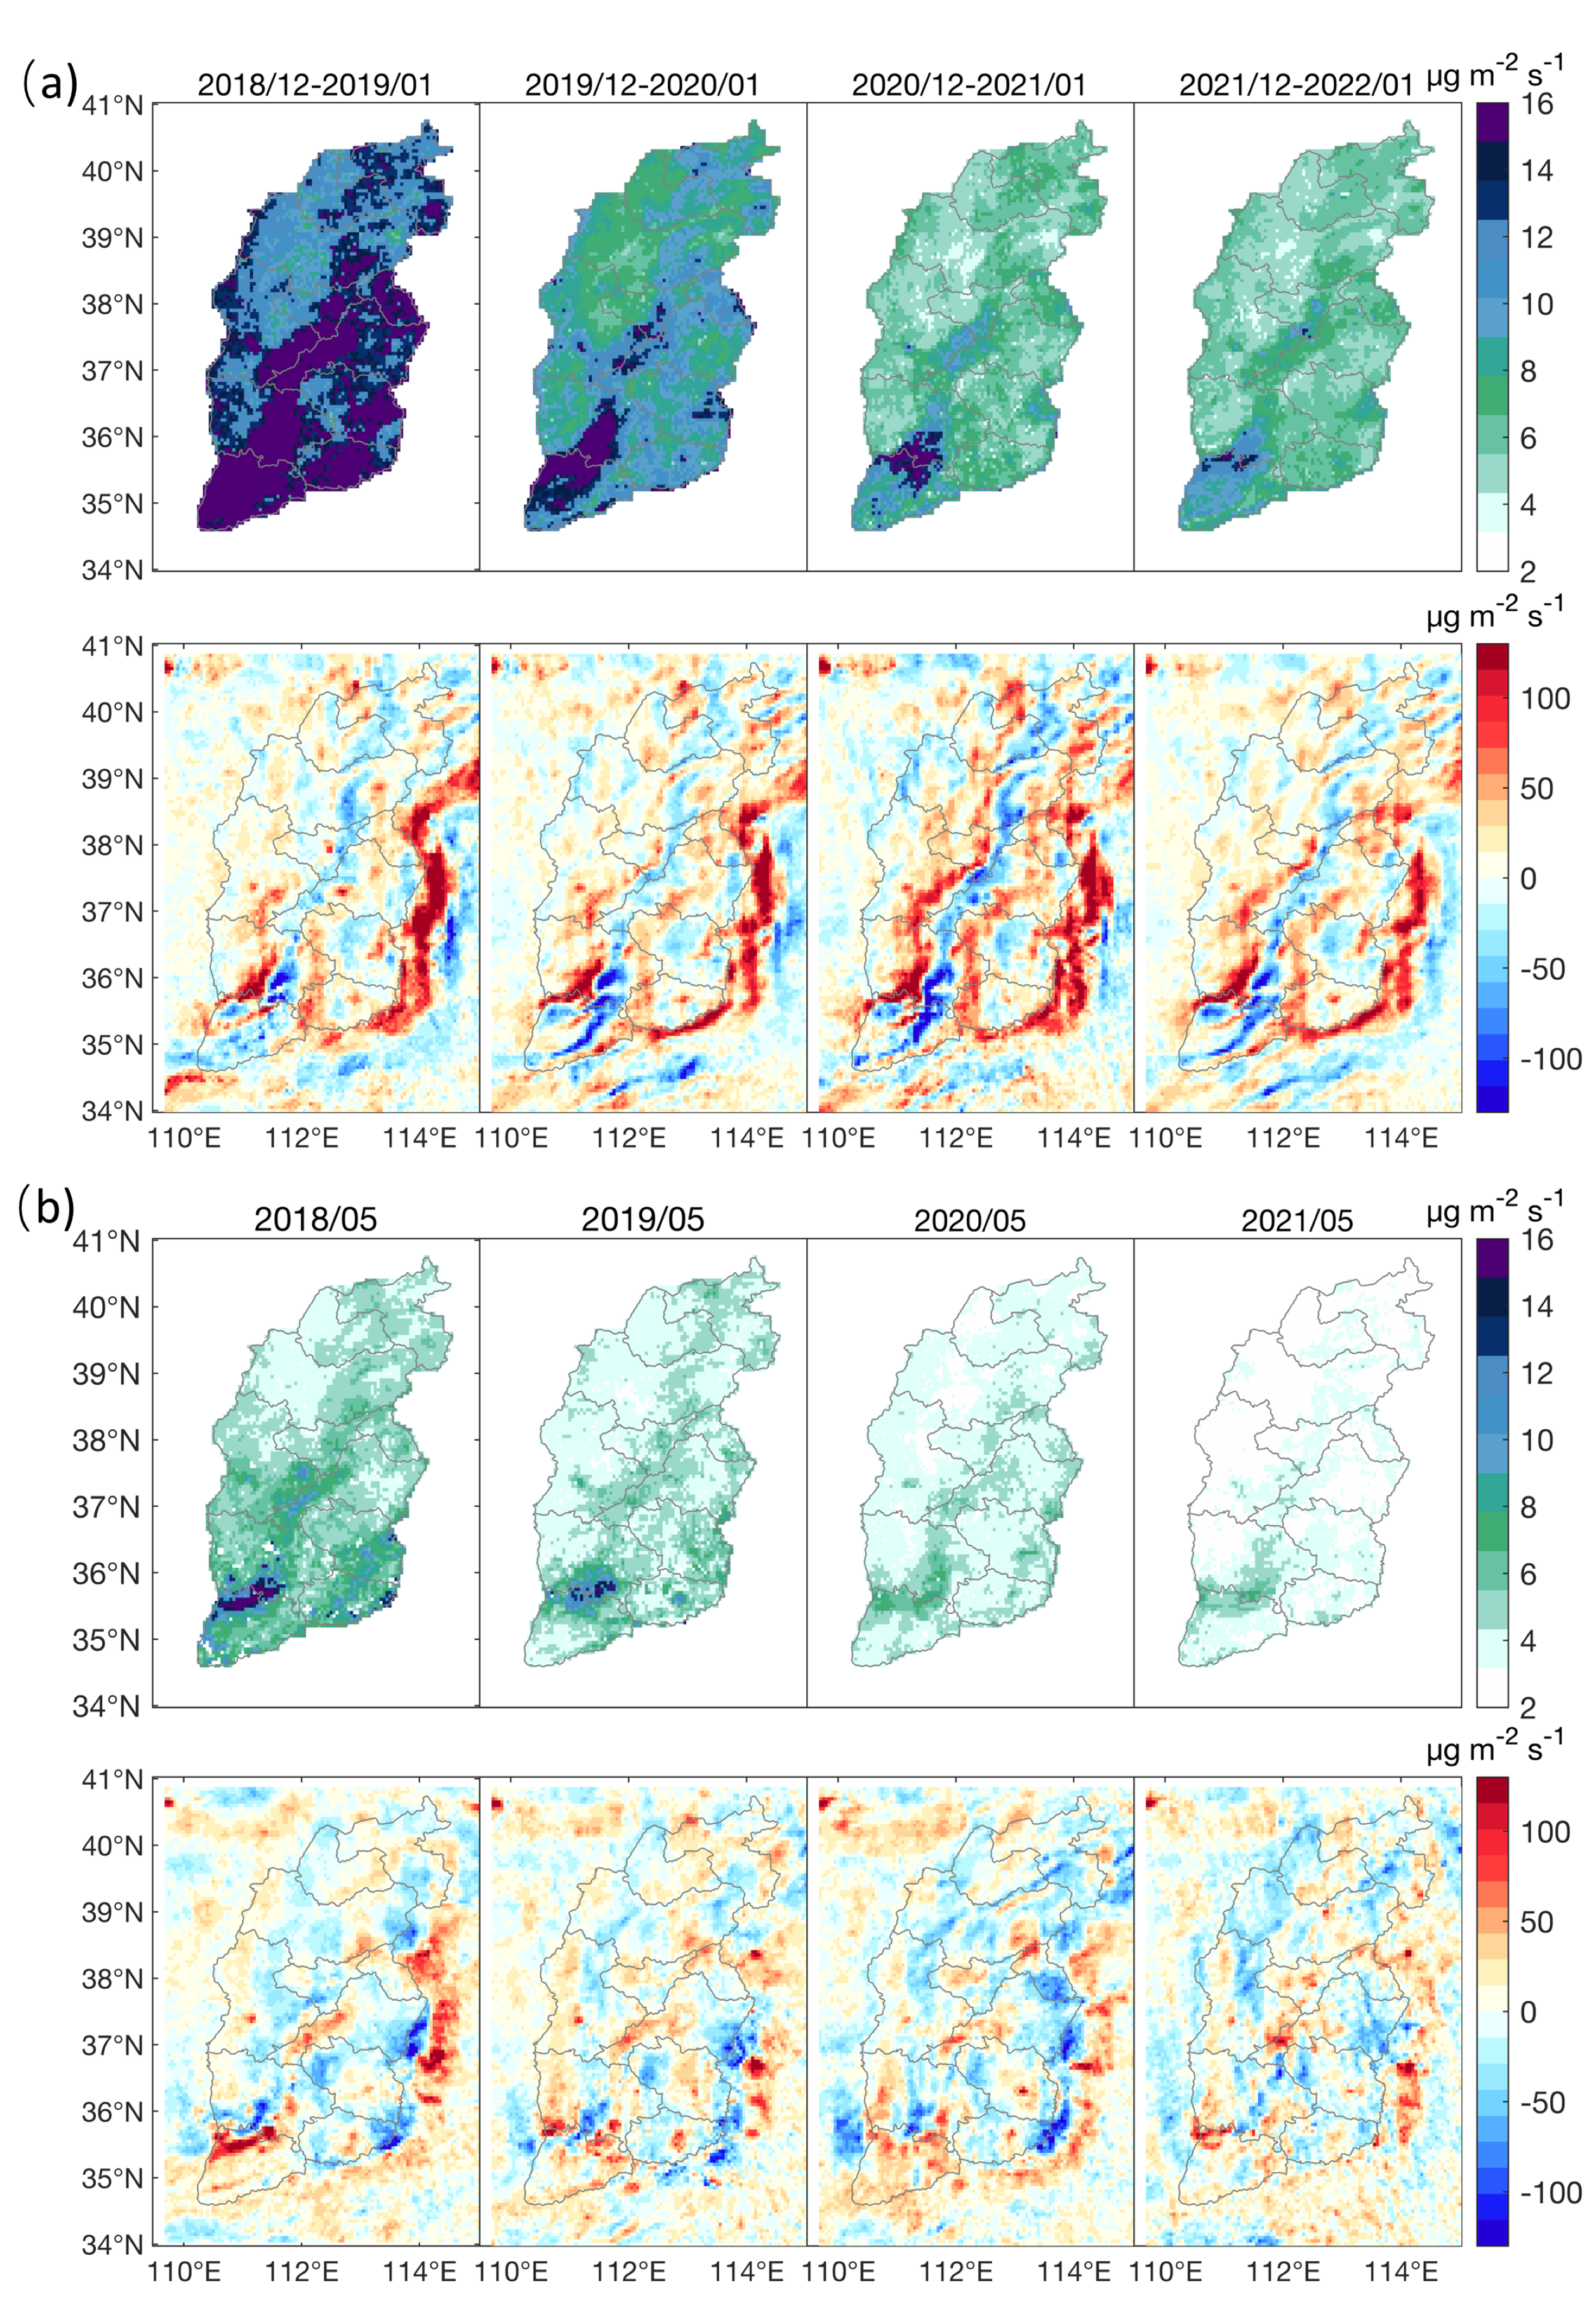
Traditional "bottom-up" emission inventories have long depended on self-reported industrial activity, fixed emission factors, and generalized assumptions—tools that often miss the messy reality on the ground, particularly in local areas. In Shanxi, China, one of the world’s most coal-dependent provinces, these conventional methods appear to have underestimated emissions from rapidly evolving sectors like steel manufacturing, rural biomass burning, and small scale industrial operations. To address this, researchers applied a space-based, model free inversion estimation framework (MFIEF) using TROPOMI satellite data to directly estimate daily CO emissions over four years. The results revealed both higher absolute emissions and major spatial and temporal shifts that had previously gone undetected. The satellite data has revealed a startling truth: CO emissions are occurring at rates up to seven times higher than those reported in official inventories at some hotspots. This discovery not only challenges our understanding of local air pollution but also shakes the foundation of regional greenhouse gas accounting, suggesting a potential underestimation of CO₂ emissions by as much as 7% in Shanxi alone.
This new view from space doesn’t just capture how much CO is emitted—it reveals when and where it escapes into the atmosphere. CO emissions in Shanxi showed strong seasonality, with major spikes in December and January, likely tied to industrial ramp-ups before the Chinese New Year and widespread winter heating. Interestingly, while top-emitting hotspots (like parts Southwestern Shanxi ) saw notable year-to-year decreases (evidence of policy success), the lowest-emitting zones stayed stubbornly constant. This suggests that while control measures are effective in known high-emission zones, "invisible" sources in rural or developing areas may be growing unchecked. Traditional bottom-up datasets work at much coarser scales, often smoothing out local variations and missing dynamic shifts in industrial activity. As a result, this research paints a far more granular and startling picture of where pollution truly originates and how it evolves.
What CO/NOx Ratios Reveal About Hidden Factories
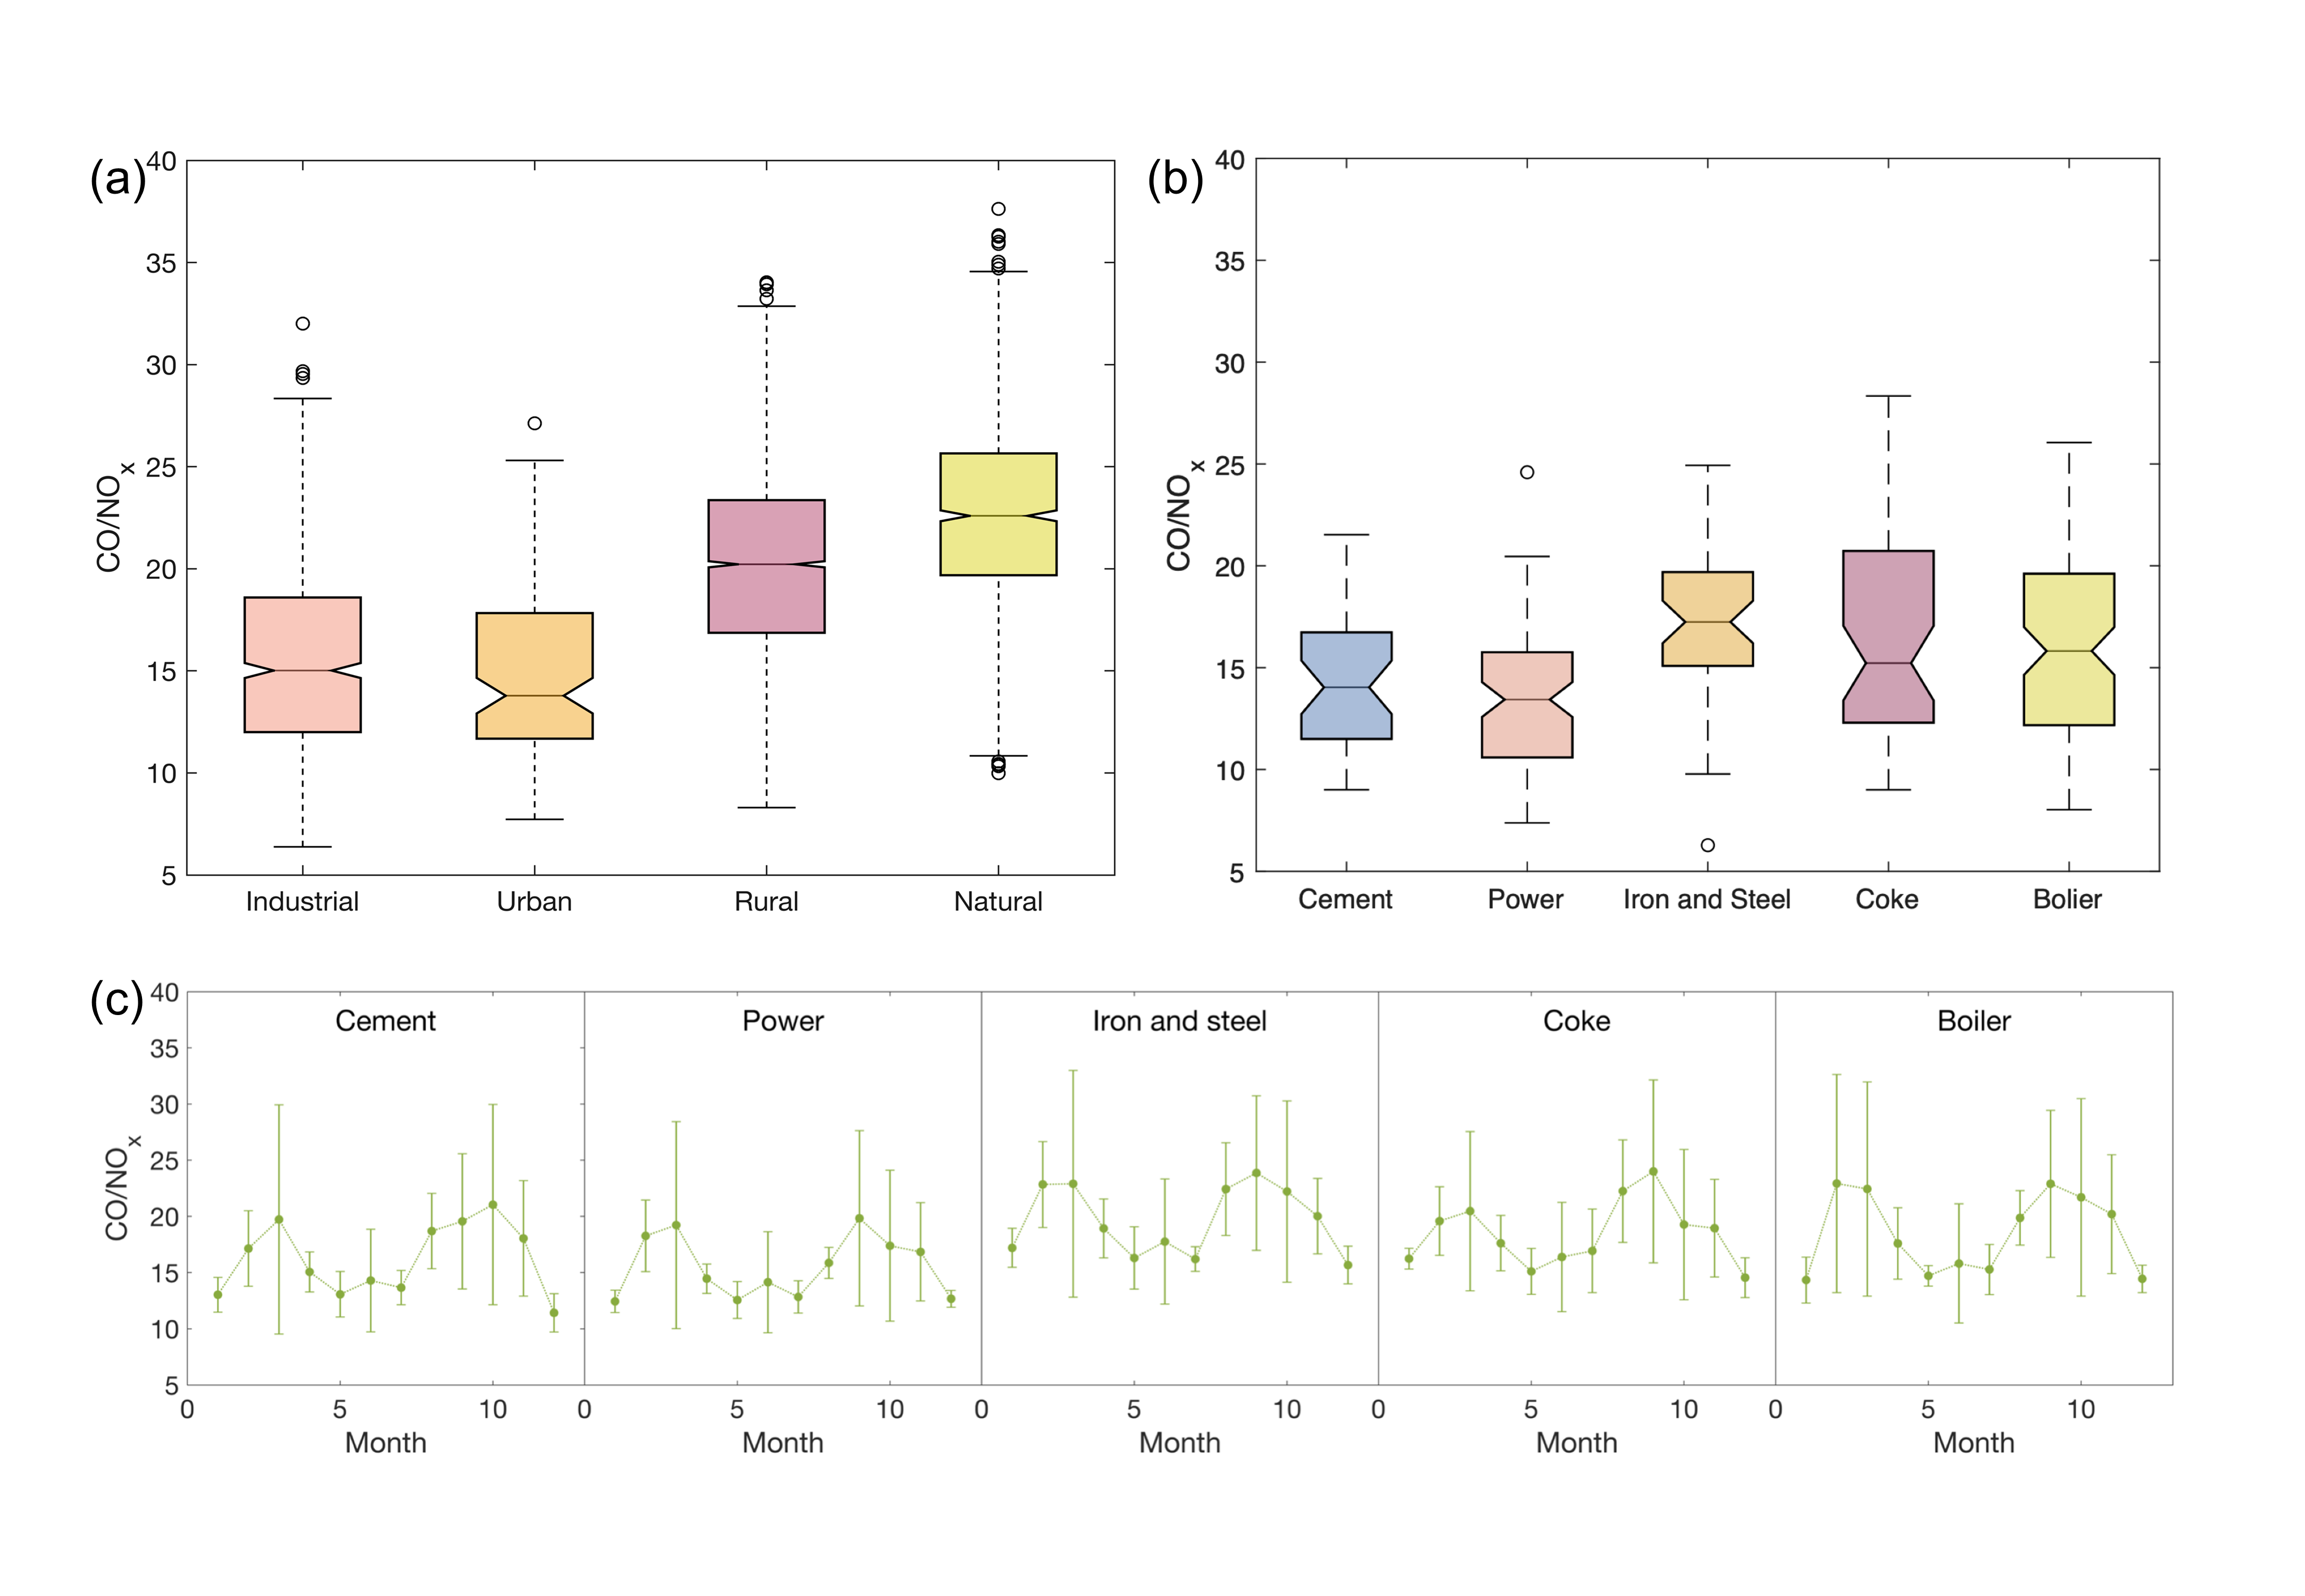
Carbon monoxide doesn’t travel alone. It often emerges alongside nitrogen oxides (NOx), especially during fossil fuel combustion. By comparing satellite-derived CO emissions to NOx, the study uncovers a crucial diagnostic: the CO/NOx ratio, a kind of chemical fingerprint for different industries. Power plants and cement kilns, which operate at high combustion temperatures, tend to emit more NOx relative to CO. In contrast, the production of coke and the manufacturing of iron and steel, particularly processes involving sintering and blast furnaces, emit higher levels of CO. Boilers emit even more CO due to incomplete combustion and oxygen-poor environments.
These patterns allowed the researchers to identify pollution sources by type—even in places lacking official emissions monitoring (CEMS). By matching CO/NOx ratios to known industrial categories, they uncovered likely locations of unregistered or underreported facilities. For instance, many grids aligned with known power plants were correctly identified solely from their emission profiles. This kind of forensic atmospheric science has massive implications: it offers a scalable tool to track "missing" emissions in developing regions, and to improve national reporting and chemical models.
Transport Corridors: Pollution Doesn’t Respect Borders
CO’s relatively long atmospheric lifetime—often several days—means it’s a perfect tracer of pollution transport. Here, we found that CO doesn’t just stay in place. Instead, it forms seasonal “plumes” traveling over hundreds of kilometers, with a consistent north–south corridor linking Shaanxi’s industrial cities (like Xi’an and Weinan) to Shanxi’s central basin. This corridor overlapping with the region’s existing belt of industrial activity and dense population. During winter months, this corridor lit up with both high emissions and net pollutant influxes, suggesting substantial cross-provincial pollution transport.
Such findings emphasize a vital point: air pollution control must transcend political borders. Even if Shanxi aggressively reduces emissions, it may still suffer from upwind sources unless regional cooperation is strengthened. Conversely, some recent policy shifts—such as stricter controls in megacities like Xi’an—have led to rising emissions in nearby smaller cities like Weinan. The air, as this study shows, records everything.
Future Thinking of Emission Science
Perhaps the most exciting implication of this study lies beyond Shanxi. The MFIEF approach demonstrated here is robust, low-cost, and adaptable to other regions—especially industrial hubs in the Global South where data scarcity is a major hurdle. Unlike traditional inventories, which need vast institutional infrastructure, this satellite-driven method needs only good remote sensing data and meteorological inputs. It can be scaled, iterated, and even used for real-time emissions monitoring and emergency response.
Moreover, improved emission estimation isn’t just about science—it’s about equity. When inventories underestimate pollution in developing regions, it delays international support, climate funding, and public health interventions. By capturing emissions accurately, we give voice to the air—and to the people breathing it.
Follow the Topic
-
Communications Earth & Environment
An open access journal from Nature Portfolio that publishes high-quality research, reviews and commentary in the Earth, environmental and planetary sciences.

Related Collections
With Collections, you can get published faster and increase your visibility.
Hazards in Mountain Regions
Publishing Model: Open Access
Deadline: Nov 02, 2026
Ecosystems under marine heatwaves
Publishing Model: Hybrid
Deadline: Oct 22, 2026


Please sign in or register for FREE
If you are a registered user on Research Communities by Springer Nature, please sign in