Species richness of plant communities: the rich gets richer and the poor gets poorer?
Published in Ecology & Evolution

In 2012 J. Bastow Wilson published a seminal paper in the Journal of Vegetation Science. It was about the world records of plant species richness. What is the maximum number of species ever found in a vegetation plot of a given size? As simple as it sounds, the paper returned unexpected results. When considering large plot sizes (e.g., 1 hectare) tropical forests were by far the richest communities, but for smaller sizes temperate grasslands and wooded meadows were way richer than tropical ecosystems. Species richness does not increase linearly with the plot size, and communities that are the richest in species for small plots, might not be the richest at larger sizes.
But how is species richness distributed across regions and ecosystems? Thanks to a team of 50 coauthors and thousands of data contributors, we tried to fill this knowledge gap in our latest paper, just published in Nature Communications.
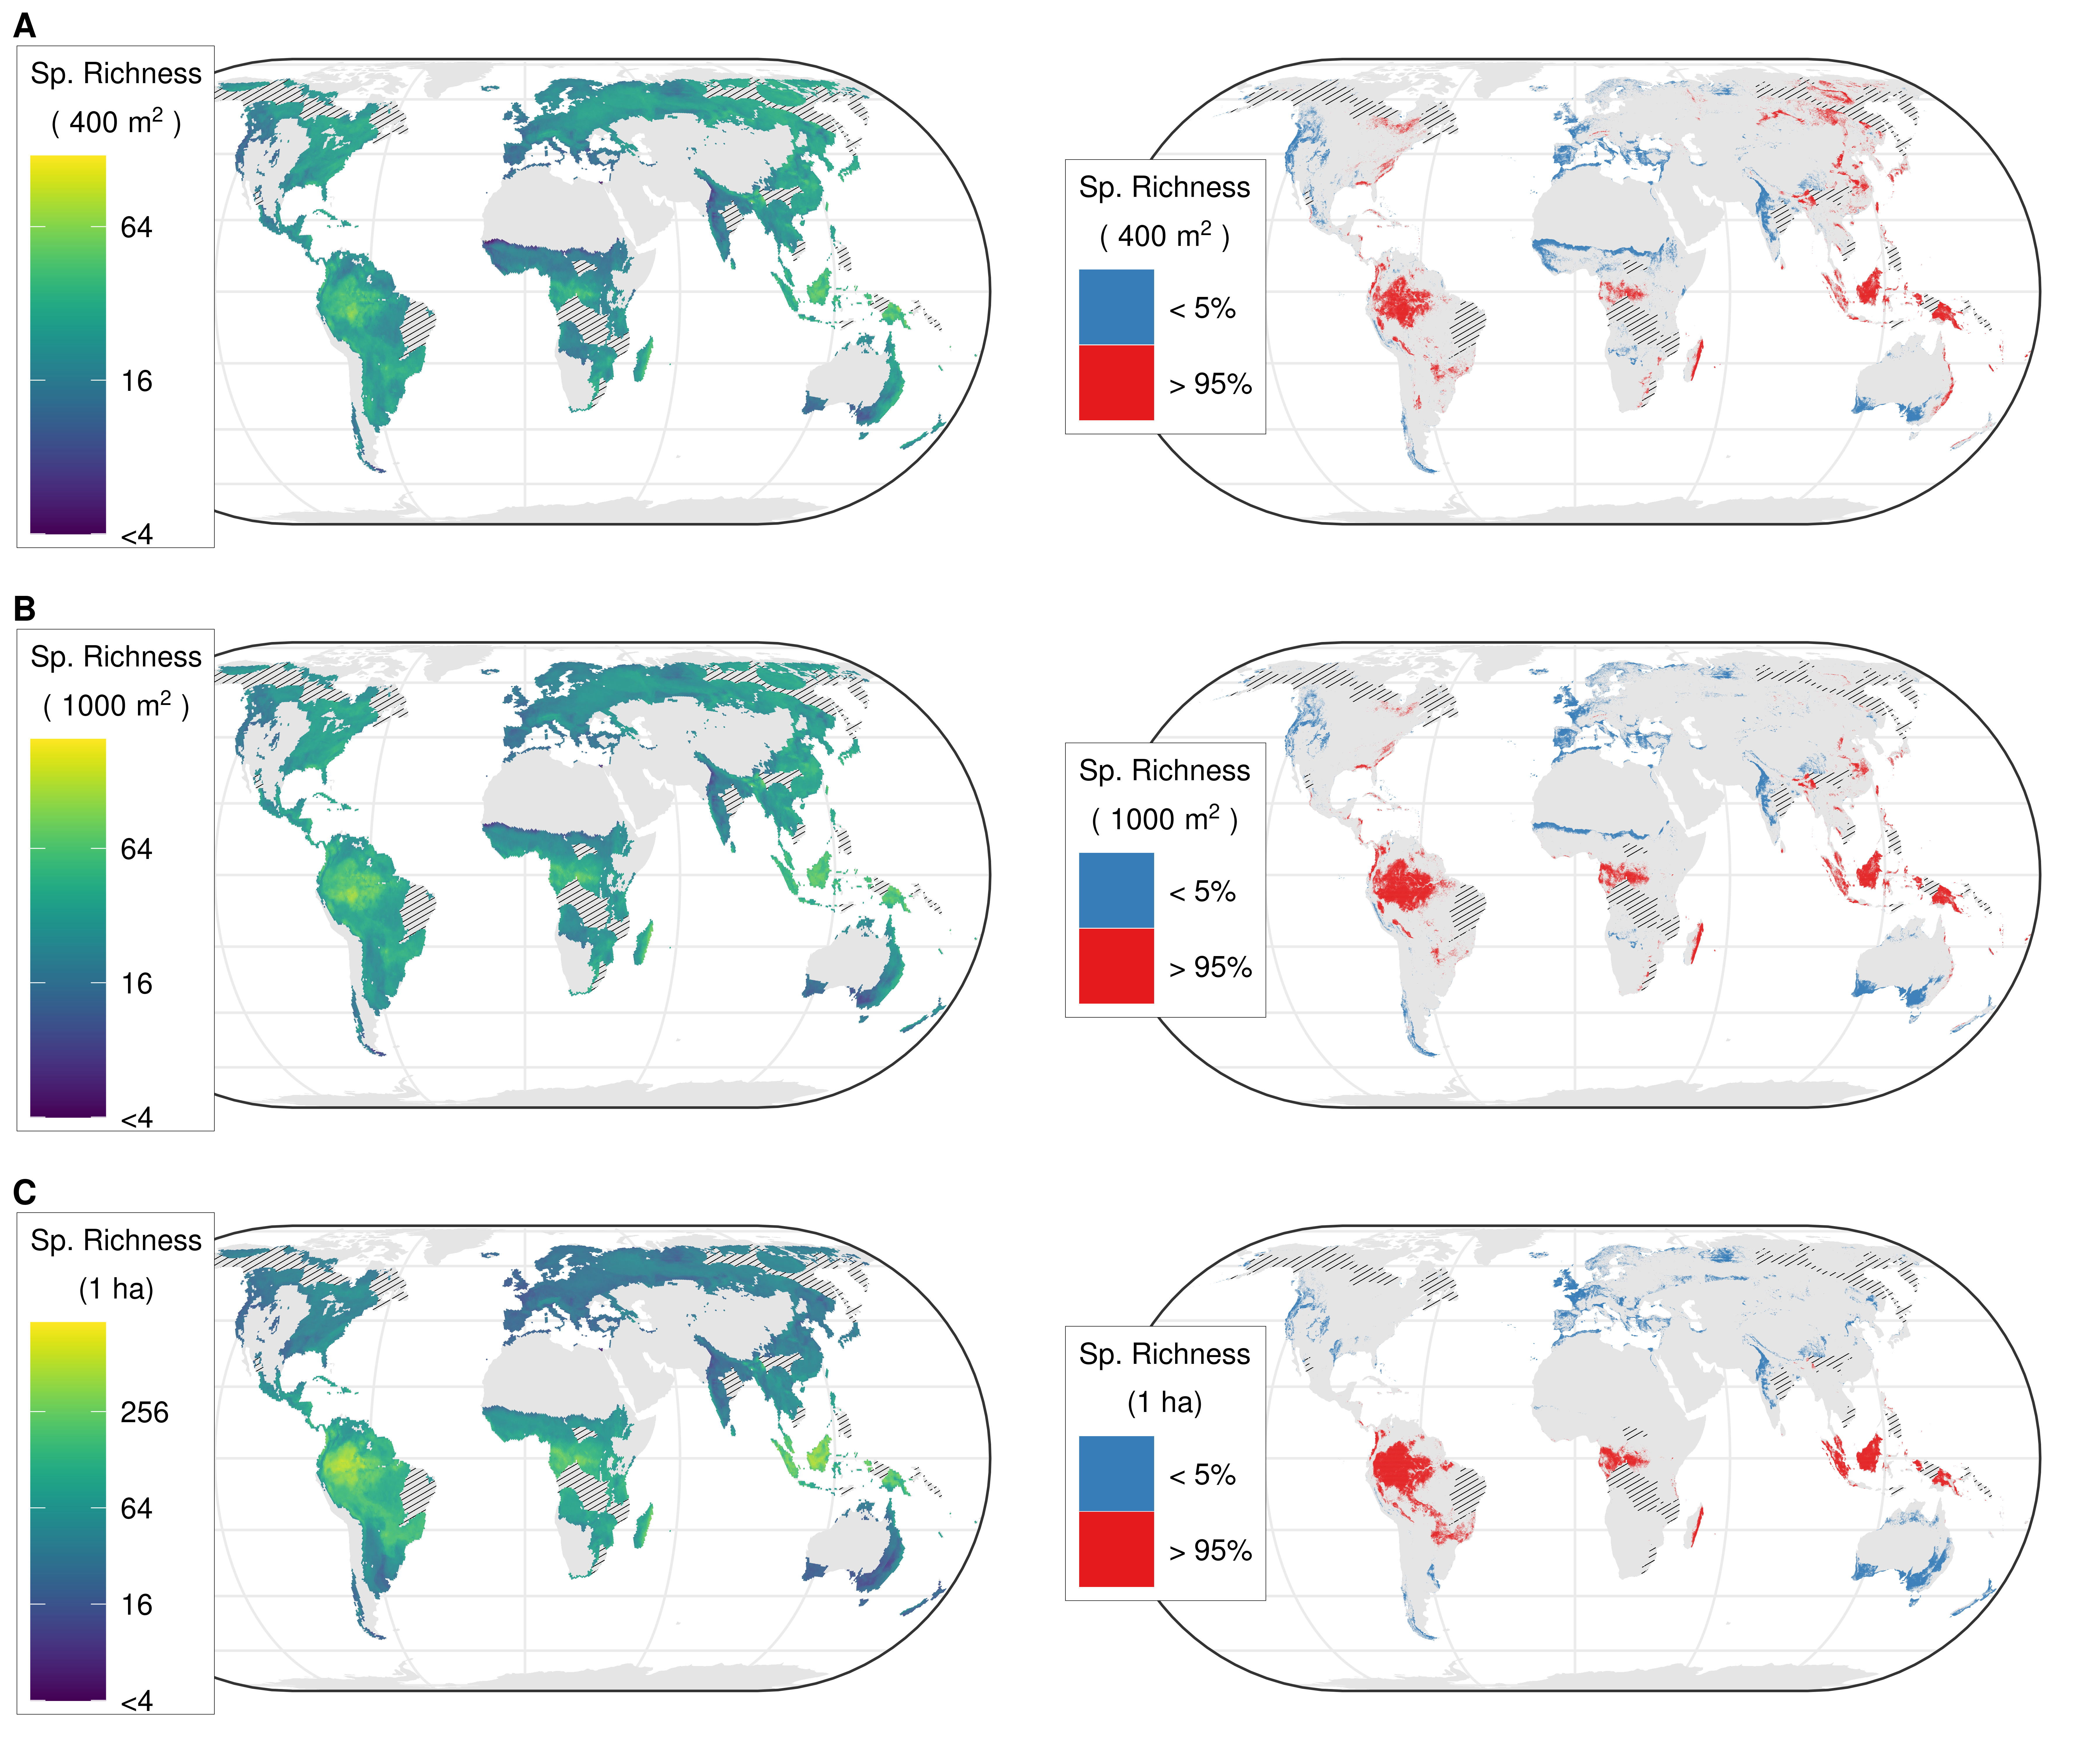
In a nutshell, we used hundred of thousands of relevés, contained in sPlot – The global vegetation-plot database – to calibrate a statistical model and create a set of maps showing how many species are expected to be found on each specific point of the globe, if one were to sample a vegetation plot of 10, 100, 1000, or 10,000 m2.

We showed that in some regions (for example, Andean-Amazonian foothills) species richness is consistently high, no matter the plot size. But we also found some regional ‘scaling anomalies’. Eurasian temperate forests, for instance, have disproportionally higher richness when considering small vegetation plots, witnessing the importance and diversity of the herbaceous ground flora in these systems. African tropical forests, on the other hand, have disproportionally higher richness for large plots: Many species coexist in these forests, but they are not so tightly packed as in temperate forests.
Crafting the model and drafting the paper was a cooperative adventure in itself. Fifty people from 27 countries were directly involved. We faced huge computing and conceptual difficulties. Dealing with millions of plant records was no joke, and only through the use of the High Performance Cluster, a super computer with thousands of CPUs hosted by iDiv and UFZ, we could run the machine-learning algorithms underlying our model. But it was not just a computing problem. sPlot contains a huge amount of data, but these are inherently biased: some regions are well-covered while others have scant data. Some vegetation types are well-sampled in some regions, but not in others. Some vegetation plot only contain tree data, while others also shrubs and herbs. Tackling this bias was a methodological challenge, which we dealt with careful resampling and model parameterization. No wonder the paper took us four years!

Having this set of maps gives us a new understanding of vascular plant biodiversity patterns, and will be a complement to classic maps of biodiversity hotspots. All of the data we used, workflows we developed and outputs we generated are available open-acces. The hope is that our work will be picked up by other colleagues and used to improve predictions of global change effects on biodiversity.
This paper would not have been possible without the work of thousands of vegetation scientists who collected the data in the first place and decided to store them in sPlot – the global vegetation-plot database, for others to use. A big thank to them and to the Deutsche Forschungsgemeinschaft (DFG, German Research Foundation) for funding sPlot and this research.
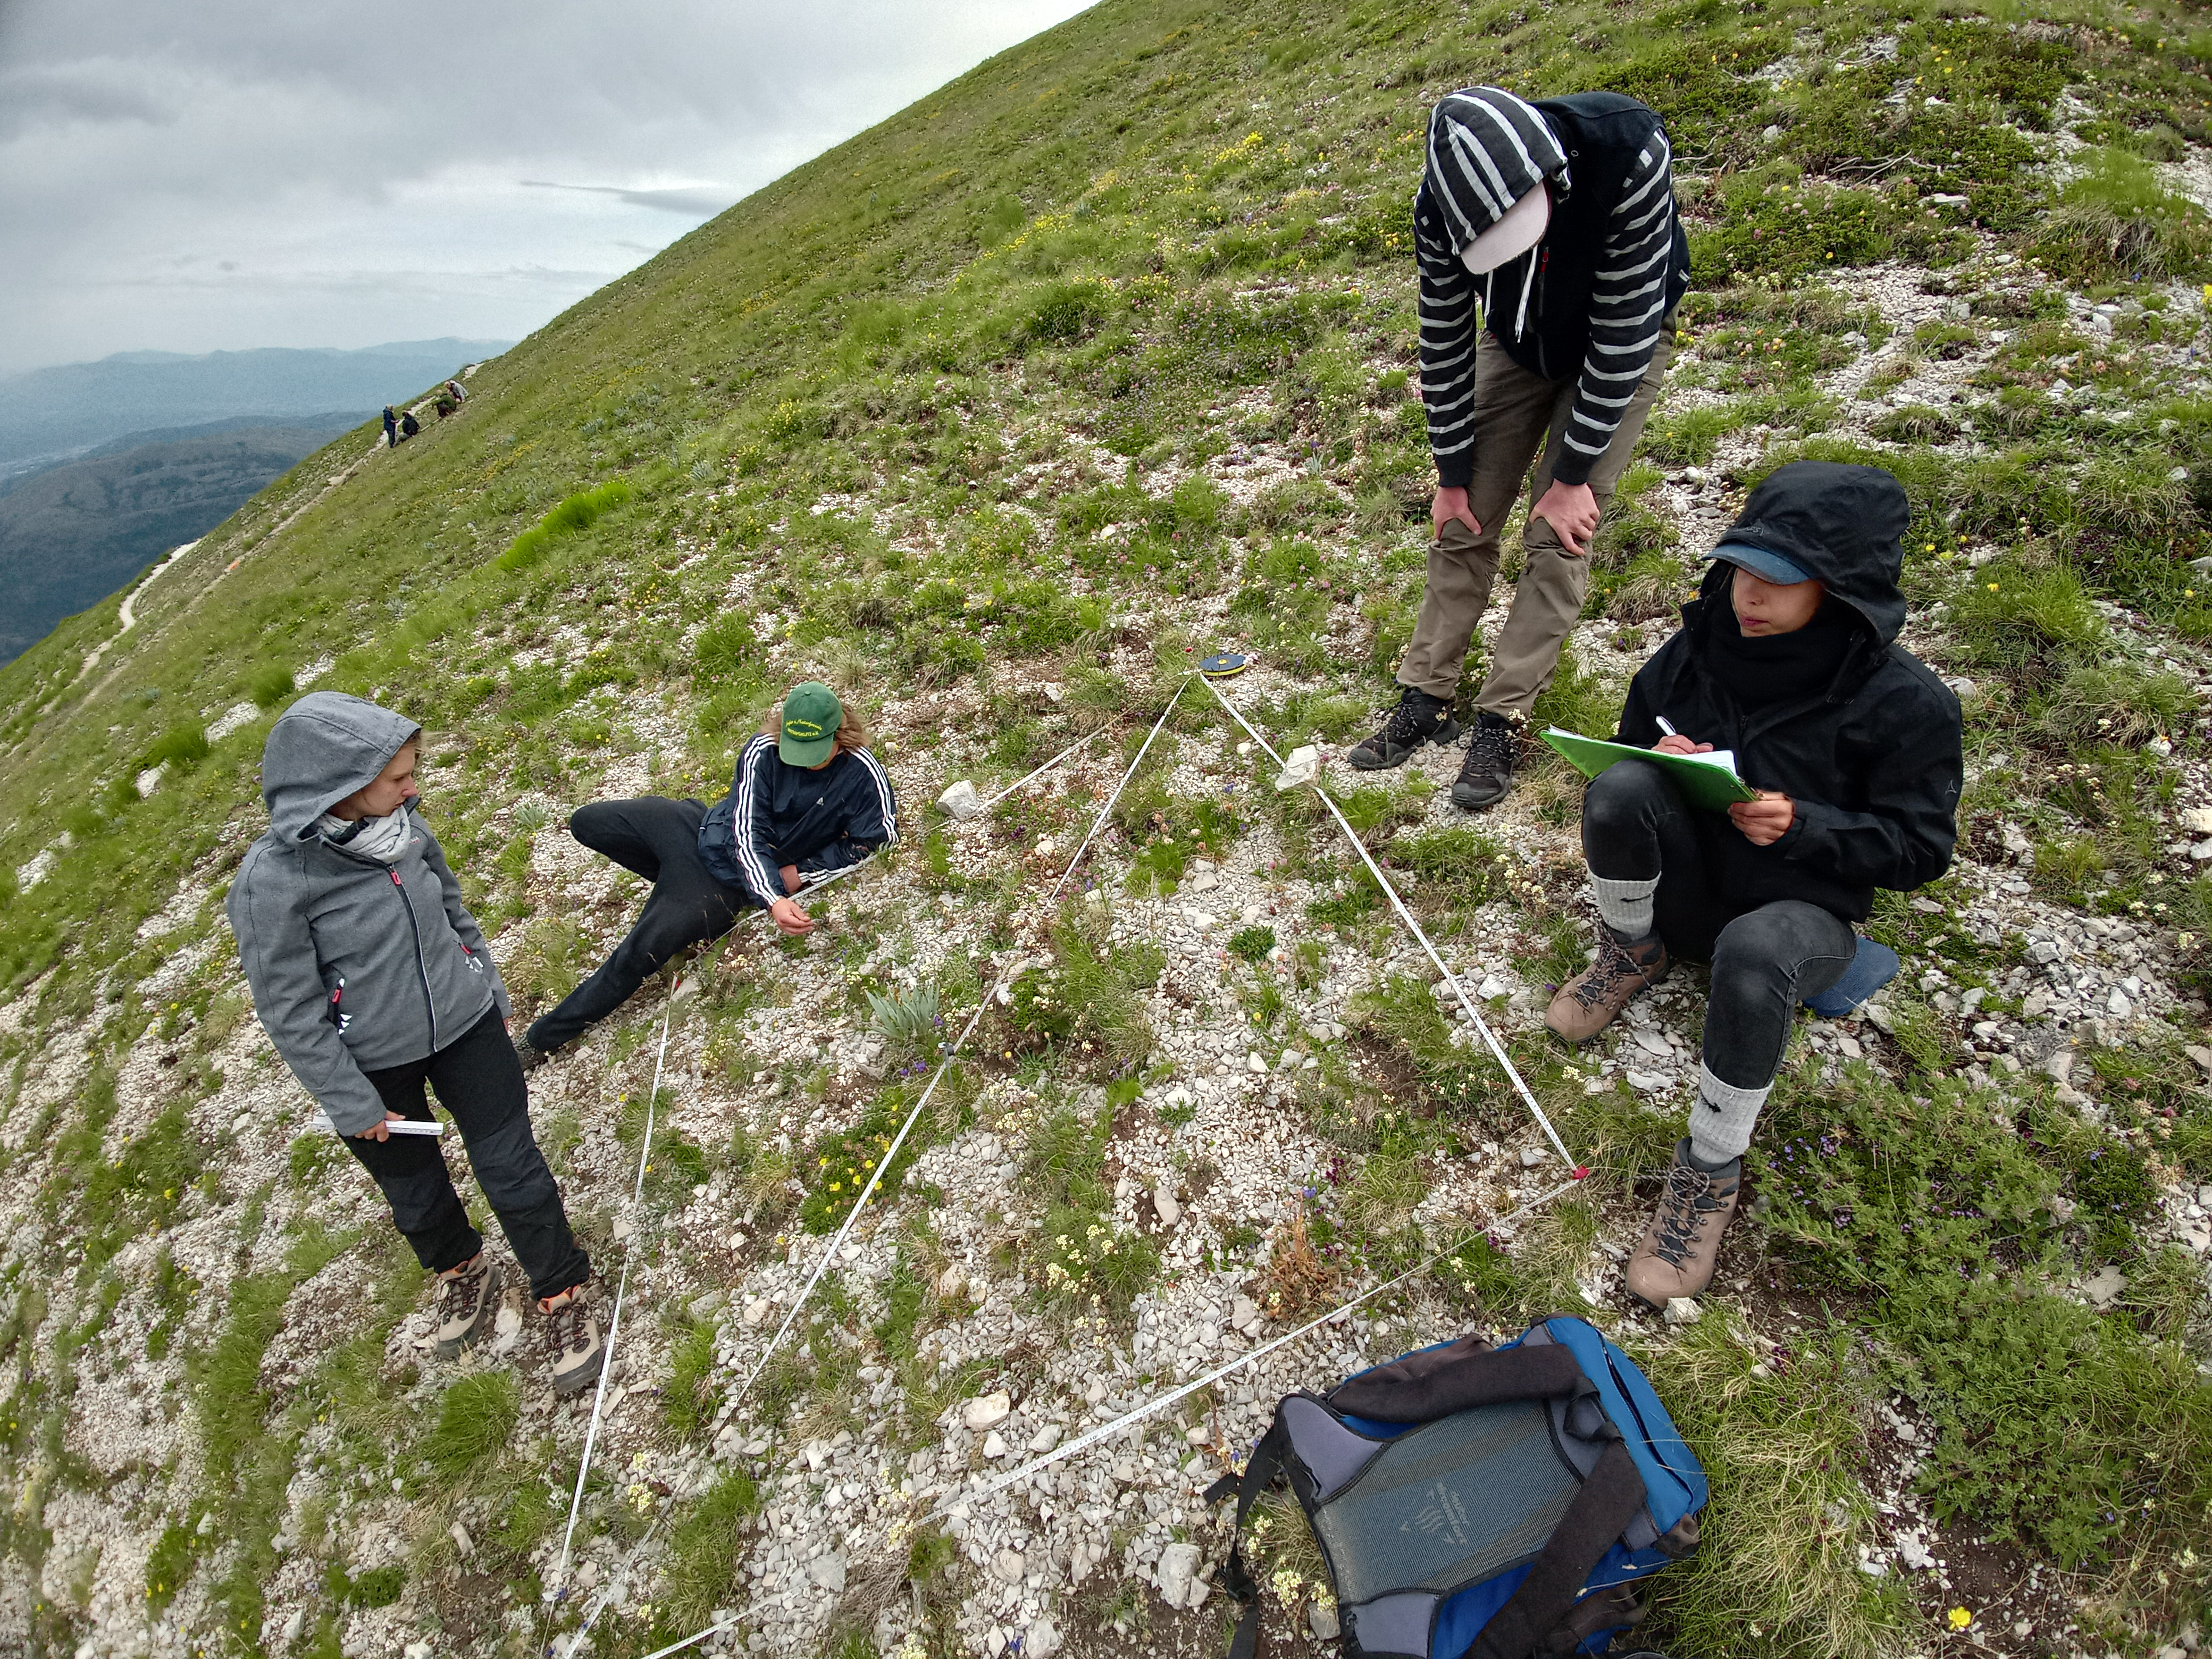
* Poster image by Jürgen Dengler
** This blog post originally appeared in https://forestsandco.wordpress.com/
Study: Sabatini, F.M., Jiménez-Alfaro, B., Jandt, U., Chytrý, M., Field, R., Kessler, M., Lenoir, J., Schrodt, F., Wiser, S.K., Arfin Khan, M.A.S., Attorre, F., Cayuela, L., De Sanctis, M., Dengler, J., Haider, S., Hatim, M.Z., Indreica, A., Jansen, F., Pauchard, A., Peet, R.K., Petřík, P., Pillar, V.D., Sandel, B., Schmidt, M., Tang, Z., van Bodegom, P., Vassilev, K., Violle, C., Alvarez-Davila, E., Davidar, P., Dolezal, J., Hérault, B., Galán-de-Mera, A., Jiménez, J., Kambach, S., Kepfer-Rojas, S., Kreft, H., Lezama, F., Linares-Palomino, R., Monteagudo Mendoza, A., N’Dja, J.K., Phillips, O.L., Rivas-Torres, G., Sklenář, P., Speziale, K., Strohbach, B.J., Vásquez Martínez, R., Wang, H.-F., Wesche, K. & Bruelheide, H. (2022) Global patterns of vascular plant alpha diversity. Nature Communications, 13, 4683. doi: https://www.nature.com/articles/s41467-022-32063-z
Follow the Topic
-
Nature Communications

An open access, multidisciplinary journal dedicated to publishing high-quality research in all areas of the biological, health, physical, chemical and Earth sciences.
Related Collections
With Collections, you can get published faster and increase your visibility.
Women's Health
Publishing Model: Hybrid
Deadline: Ongoing
Advances in neurodegenerative diseases
Publishing Model: Hybrid
Deadline: Mar 24, 2026


Please sign in or register for FREE
If you are a registered user on Research Communities by Springer Nature, please sign in