The storytelling trees on Mount St. Helens
Published in Earth & Environment
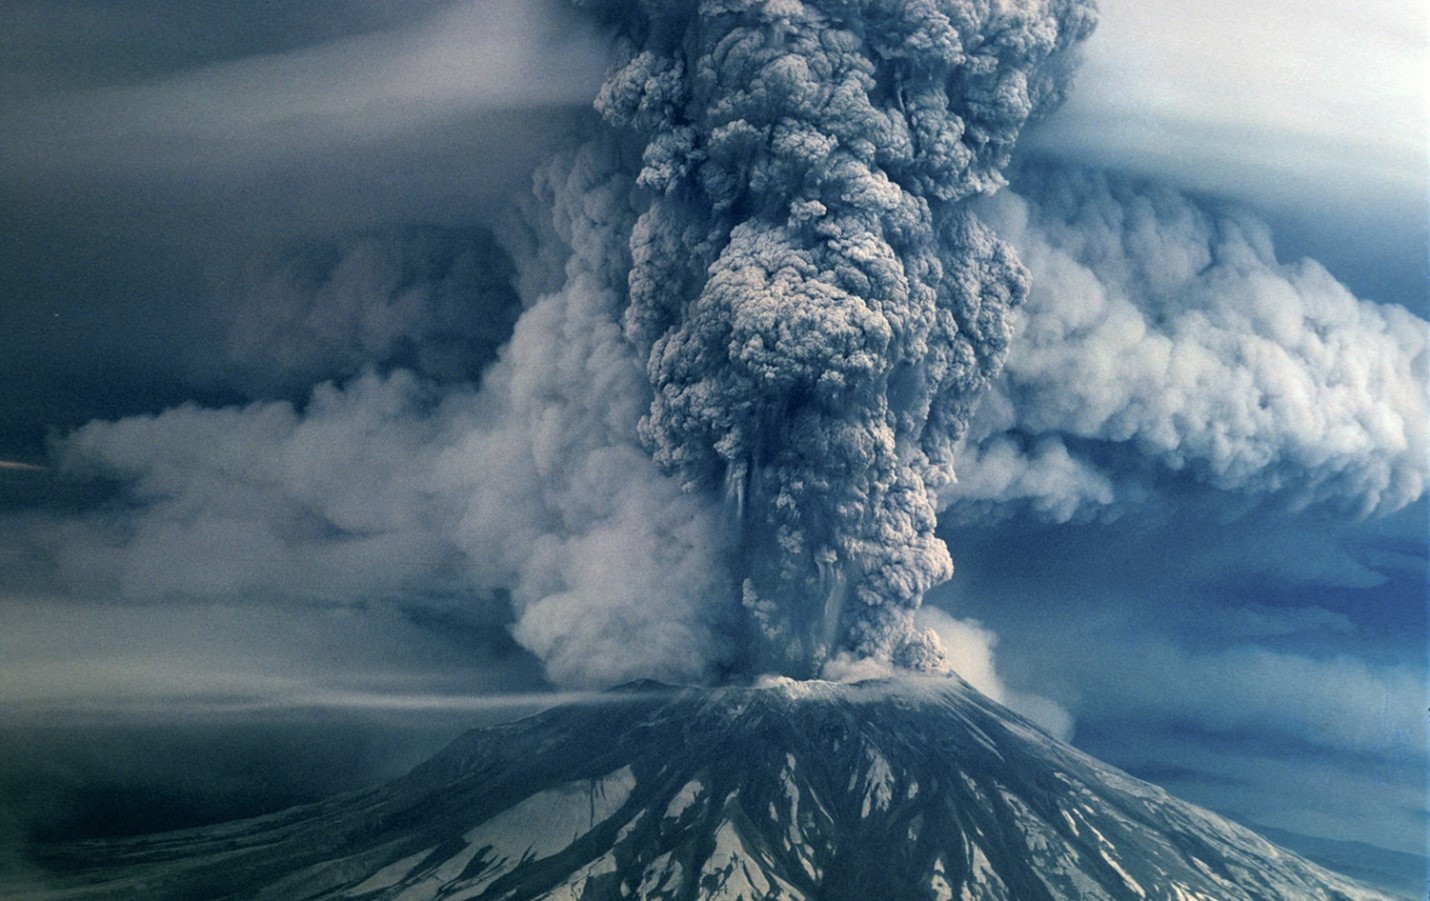

Pyroclastic flows are hot (>300°C) mixtures of gas, ash, and pieces of rock that are erupted from a volcano and flow along and above the ground at high speeds (up to 200 m/s). These flows can destroy anything in their path and, therefore, are a significant volcanic hazard to people, infrastructure, and the surrounding ecosystem. The 1980 Mount St. Helens eruption released a pyroclastic flow that decimated over 600 square kilometers of forest north of the volcano and killed at least 57 people.

The landslide of the northern flank of Mount St. Helens that immediately preceded the lateral blast and eruption of the pyroclastic flow (Atlantic Post).
The extent of destruction caused by the pyroclastic flow was captured by aerial photographs within a couple of months after the 1980 eruption. This paper focused on reconstructing the dynamics of the pyroclastic flow from tree damage within this zone of destruction. This post highlights a certain type of tree damage from our paper: clusters of burned trees left standing where nearly all trees were blown down. Why are these trees important and what story do they tell?

A cluster of standing trees with branches still intact on the lee side of a hill outlined in yellow, surrounded by downed trees and broken tree trunks (photo by Lyn Topinka).
Using aerial photography taken one month after the eruption, two main types of standing tree clusters can be recognized: clusters where trees were stripped of branches (stripped) and clusters where trees retained branches (foliage). Almost all clusters left standing were on the lee side of hills relative to the direction of pyroclastic flow travel. These trees were shielded from the main brunt of the flow. Aerial photographs were shot from above around mid-morning, so the shadows of these standing trees are also visible. Shadow length can be used to derive tree height after taking into account the ground slope and slope direction (aspect), parameters that can be derived from a digital elevation model (DEM).

A stripped (a) and a foliage cluster (b) of standing trees outlined in yellow. Red arrows show the direction of the pyroclastic flow, as derived from the orientation of fallen trees. Standing tree shadows (dark linears) in both images are aligned NW-SE.
What can the standing and felled trees tell us about a pyroclastic flow besides that it was hot? A common variable used to describe destructive flows is dynamic pressure, the lateral forced exerted by the flow, which is directly related to its velocity and density. For simplicity’s sake, dynamic pressure is synonymous with kinetic energy. Since it is almost impossible to measure the velocity and density of a pyroclastic flow while it is moving, damaged trees are useful proxies. The dynamic pressure needed to topple a tree depends on the tree radius, height, and species. These 3 factors were identified and calculated using the aerial imagery, a DEM, and the empirical relationship between tree radius and height for Douglas Fir, the dominant species. If a tree was toppled, then we know that the pyroclastic flow dynamic pressure exceeded the magnitude needed to topple it. If a tree was left standing, then the toppling magnitude was not exceeded by the pyroclastic flow.
A conceptual model of the pyroclastic flow behavior was created based on the standing tree clusters. The model suggests that the pyroclastic flow was led by a fast, destructive head followed by a slower, denser body. The image below represents the head as a red arrow and body as blue arrow. The behavior of the flow head and body vary with runout distance. Near the volcano, the dynamic pressure of both the head and body was strong enough to topple all trees, leaving no standing tree clusters. At a medial distance, the dynamic pressure of the flow dropped as density and velocity lessened. This allowed for the head and body to behave differently. The head became temporarily buoyant, detaching from the ground when travelling up and over a hill, leaving behind a cluster of standing trees on the hill’s lee side. The slower body then ran through these standing trees and stripped them of branches but did not have enough strength to knock them over. As flow velocity and density decreased further at greater distances, waning dynamic pressure allowed the flow head to become buoyant for longer when it encountered hills. Also at these distances, the flow body no longer had enough dynamic pressure to strip the trees left standing on hill lee sides, leaving foliage clusters. This change in dynamic pressure with distance is illustrated below as a decreasing color gradient for the arrows and by felled or standing trees with or without foliage on hill lee sides.

Conceptual model of dynamic pressure variations within the head (red arrow) and body (blue arrow) of the Mount St. Helens pyroclastic flow, as recorded by tree damage (downed or standing, stripped or with foliage) on hill lee sides.
In summary, this study shows how the characteristics and locations of damaged trees within the path of a large pyroclastic flow can be used to describe variations in dynamic pressure. Standing tree heights, as derived from shadow lengths in aerial photographs corrected for ground slope and slope directions, serve as a proxy for mapping these dynamic pressure variations. The location and extent of damage within standing clusters of trees further define pyroclastic flow head and body relationships and their evolution with distance from the volcano.
Not mentioned in this paper and worth acknowledgement are incredible first-hand accounts* of people who were present in the forest during the eruption and survived the pyroclastic flow. How did these people survive, and others did not? Dynamic pressure differences are a likely culprit.
“Vancouver, Vancouver, this is it!” Cascades Volcano Observatory’s David Johnston radios in from Coldwater II, an observation post about 8 km north of Mount St. Helens on the morning of May 18, 1980*. Even at that distance, we now know that this site experienced among the highest dynamic pressures within the pyroclastic flow. David Johnston was never found, and parts of his trailer were discovered 13 years later buried in ash.

David Johnston sitting outside his trailer at Coldwater II the day before the eruption (photo by Harry Glicken).
Others farther from the mountain had a different story to tell. A father took his boys camping about 20 km northeast of the volcano. Upon realizing the mountain had erupted, the family took refuge on the lee side of a bluff, watching trees fall all around them except for those with them behind the bluff. The father said the pyroclastic flow blew over their heads, he felt minimal wind, and they crawled under a large log to get away from the scorching heat. This family possibly witnessed the head of the pyroclastic flow detaching from the body since dynamic pressure waned markedly towards the end of its runout. The family was not slammed to the ground like other survivors who were not able to take refuge behind a bluff and were exposed to the full brunt of the pyroclastic flow head. The father and boys eventually wandered out from behind the bluff and encountered others who had been badly burned and injured. A military helicopter followed their tracks in the ash and picked them up*.

Survivors of the 1980 pyroclastic flow being transported to the hospital via military helicopter (from Waitt, 2014)
*First-hand accounts summarized here are recorded by Richard Waitt in “In the Path of Destruction: Eyewitness Chronicles of Mount St. Helens” (WSU Press)
Follow the Topic

Related Collections
With Collections, you can get published faster and increase your visibility.
Volcanic and Igneous Plumbing Systems (VIPS): Integrating Observations, Models, and Processes
2026 marks 10 years since the IAVCEI Commission on Volcanic and Igneous Plumbing Systems (VIPS) was established. The main goal of the VIPS commission is to provide a forum for VIPS research which crosses disciplinary or methodological boundaries and to foster an integrated understanding of magma transport and storage in the crust. It is thus timely for the volcanology community to reflect on how VIPS knowledge has changed in the past decade through the publication of a special issue of the Bulletin of Volcanology.
VIPS comprise a combination of thin and long intrusive sheets and large magma bodies. Melt is drained from bodies of magmatic mush at depth and converges to form a network of underground structures, such as dykes, sills and inclined sheets that are responsible for facilitating the transport and storage of magma in the crust, possibly leading to volcanic eruptions. The structure of VIPS and their complex physical and chemical interactions are key parameters controlling the magnitude and type of volcanism that occurs at the Earth’s surface. A major aim of volcanology is to understand volcanic processes and hazards for the benefit of society – improved understanding of VIPS and their associated georesources is essential to meet this aim.
In this Special Issue we welcome articles which present the current state of knowledge of VIPS. Contributions may include studies using: 1) volcano geodesy and/or geophysics for researching active VIPS, 2) structural geology, igneous petrology, and geochemistry for studying fossil, eroded VIPS, or 3) experimental, analogue, numerical, and petrological modelling to constrain the dynamics and evolution of VIPS. We particularly encourage multidisciplinary VIPS studies and insights from diverse research teams led by early career researchers.
Publishing Model: Hybrid
Deadline: Sep 30, 2026
Recent advances in the understanding of monogenetic volcanism
Monogenetic volcanoes present unique challenges for geoscientists, as these volcanoes erupt only once where no vent existed previously, they can exhibit a wide range of eruptive styles, and we do not know where, or when, the next eruption will be. This special issue on monogenetic volcanism welcomes contributions including both those presented at the International Monogenetic Conference (San Pedro de Atacama, Chile, November 2024) and any other contributions that address the main themes of the conference, including: 1) physical volcanology, eruption dynamics, and eruption styles; 2) morphology, structure, and geophysical modeling; 3) geochronology, tectonic, and spatial distribution; 4) geochemistry, petrology, and petrologic modeling, 5) lakes in monogenetic systems, climate change, paleontology, and hydrochemistry; 6) volcanic hazard and risk assessment in monogenetic fields; and 7) geoheritage, geotourism, and geoconservation.
Publishing Model: Hybrid
Deadline: Nov 30, 2026


Please sign in or register for FREE
If you are a registered user on Research Communities by Springer Nature, please sign in