Tomographic measurement of dielectric tensors at optical frequency
Published in Materials
Dielectric tensor: a fundamental physical descriptor of light-matter interaction
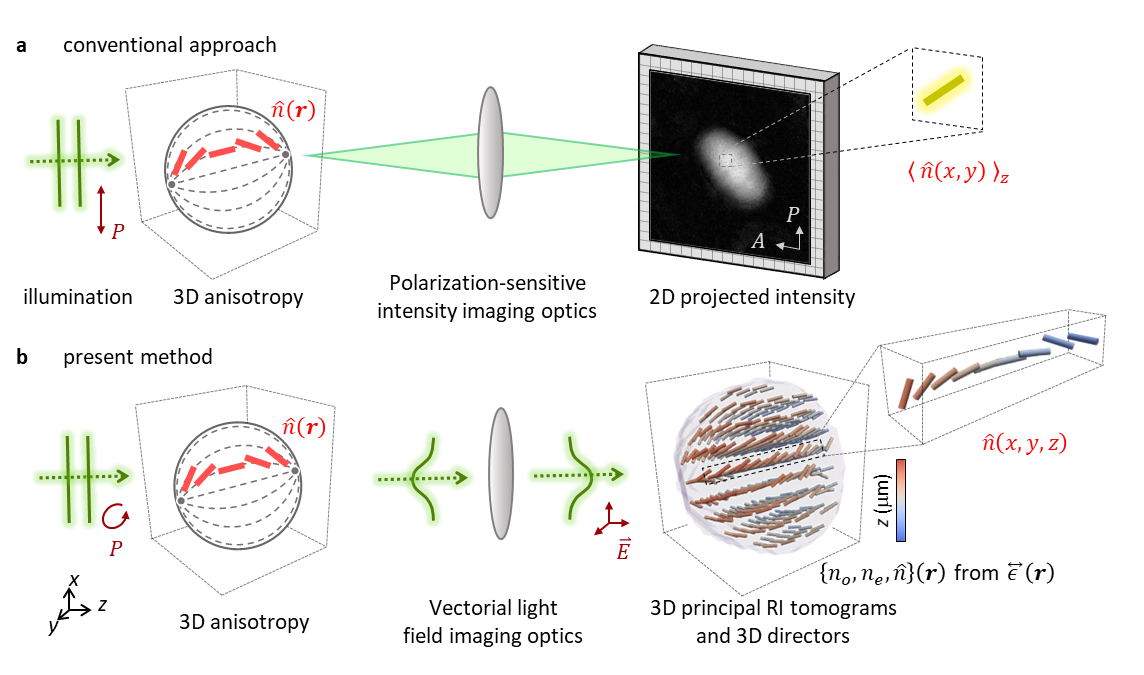
The dielectric tensor is a fundamental descriptor of light-matter interaction, considering the molecular orientation, optical anisotropy, and polarization of light. However, despite its importance in scientific and industrial applications, three-dimensional (3D) dielectric tensor has not been measured directly. The main challenge is the nature of vectorial light scattering from a 3D anisotropic structure. Existing approaches only indirectly access 3D anisotropic information, limited to two-dimensional, qualitative, strict sample conditions or assumptions. For example, polarized light microscopy has been widely used, yet it is limited to the 2D projected results with qualitative contrast information (Fig. 1a).
Precursor: 3D quantitative phase imaging
In 1969, an optical tomographic method assuming optical isotropy and simplifying the dielectric tensor into a scalar value of RI was invented by E. Wolf. The field of measuring RI tomogram, called 3D quantitative phase imaging or optical diffraction tomography, have grown for decades. However, a method for measuring the dielectric tensor still had not been demonstrated. The reason is that the number of orthogonal polarization of light is limited to two, whereas the dielectric tensor has three eigenvalues – it is an underdetermined problem.

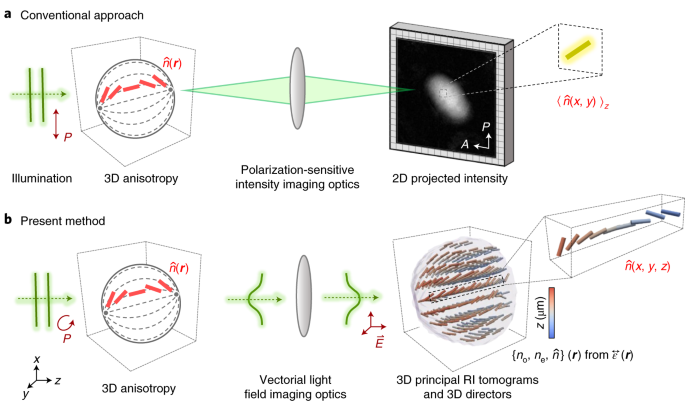
Fig. 1. Direct 3D anisotropy-imaging. a, Indirect access to 3D optical anisotropy using conventional methods. A 3D anisotropic sample is illuminated by polarized light (P), and its 2D images are recorded after passing through the analyser (A). This 2D polarization-sensitive imaging particularly conceals the axially inhomogeneous information of 3D anisotropy. The red rods depict the directors. á ñz denotes the average along the z axis. b, The present method directly visualizes 3D anisotropy. By solving the vectorial wave equation, 3D distribution of optical anisotropy is quantitatively reconstructed. no, ne, and e denote the ordinary RI, the extraordinary RI, and the dielectric tensor.
Approach: inverse solving of the vectorial wave equation
We developed a label-free tomographic method enabling the reconstruction of 3D dielectric tensors (Fig. 1b). An optically anisotropic structure is illuminated with a polarized plane wave with various angles and circularly polarization states. Then, the scattered fields are holographically measured and converted into vectorial diffracted fields components. Finally, by inversely solving a vectorial wave equation, the 3D dielectric tensor is reconstructed.
The technical challenge was that this inverse problem was underdetermined; the number of unknowns is greater than that of measurements in the conventional approach. Our approach was to measure additional holographic images by slightly tilting the incident angle. The slightly tilted illumination provides an additional orthogonal polarization which makes the underdetermined problem become the determined problem. Although scattered fields are dependent on the illumination angle, the Fourier differentiation theorem enables the extraction of the same dielectric tensor for the slightly tilted illumination.
Validation and applications
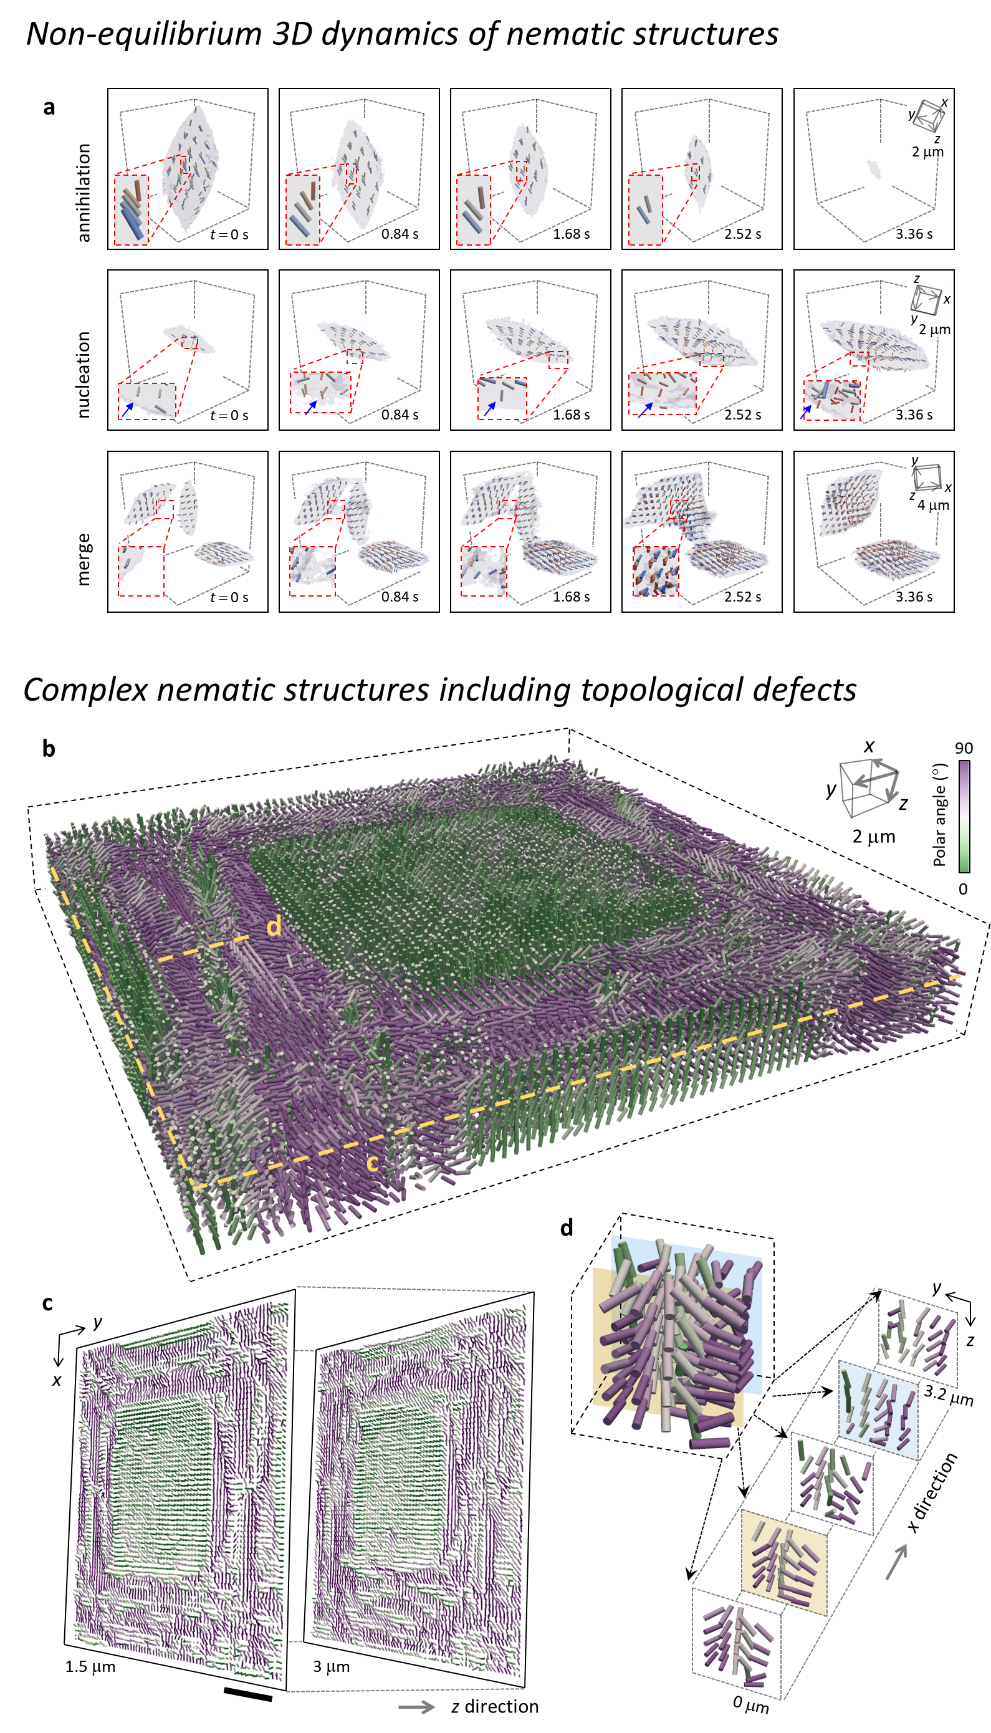
We validated the method by reconstructing the well-known liquid crystal (LC) structures, including the twisted nematic, hybrid aligned nematic, radial, and bipolar configurations. We demonstrated the non-equilibrium dynamics of annihilating, nucleating, and merging LC droplets (Fig. 2a). Also, the applicability for more complex structures was experimentally demonstrated by measuring the LC polymer network with repeating 3D topological defects (Figs. 2b-2d).

Fig. 2. a, time-lapse 3D measurements of non-equilibrium dynamics of liquid crystal droplets; annihilation when heating, nucleation, and merge when cooling. b, a 3D view of the reconstructed directors of the LC polymer network film. The perspective and scale are shown in the top-right box. c, multiple xy cross-sectional slices at different axial planes. d, An enlarged 3D view of the topological defect at the side, indicated by the yellow dashed line in b.
For further information, please read our published article in Nature Materials, https://www.nature.com/articles/s41563-022-01202-8
Follow the Topic
-
Nature Materials

A monthly multi-disciplinary journal that brings together cutting-edge research across the entire spectrum of materials science and engineering, including applied and fundamental aspects of the synthesis/processing, structure/composition, properties and performance of materials.


Please sign in or register for FREE
If you are a registered user on Research Communities by Springer Nature, please sign in