Towards AI-assisted neutron spectroscopy
Published in Physics

Introduction
Free neutrons can deeply penetrate materials due to their electric neutrality. This is used for in-depth studies of the materials’ properties with scattering instruments operated by large-scale research facilities at neutron sources around the world. Neutron spectroscopy is a generic term for scattering techniques that investigate dynamic properties such as forces between atoms ordered in an atomic lattice. In particular, three-axes spectrometers (TAS) perform experiments by guiding neutrons along three instrument axes to measure intensity distributions in the so-called Q-E space (Fig. 1).
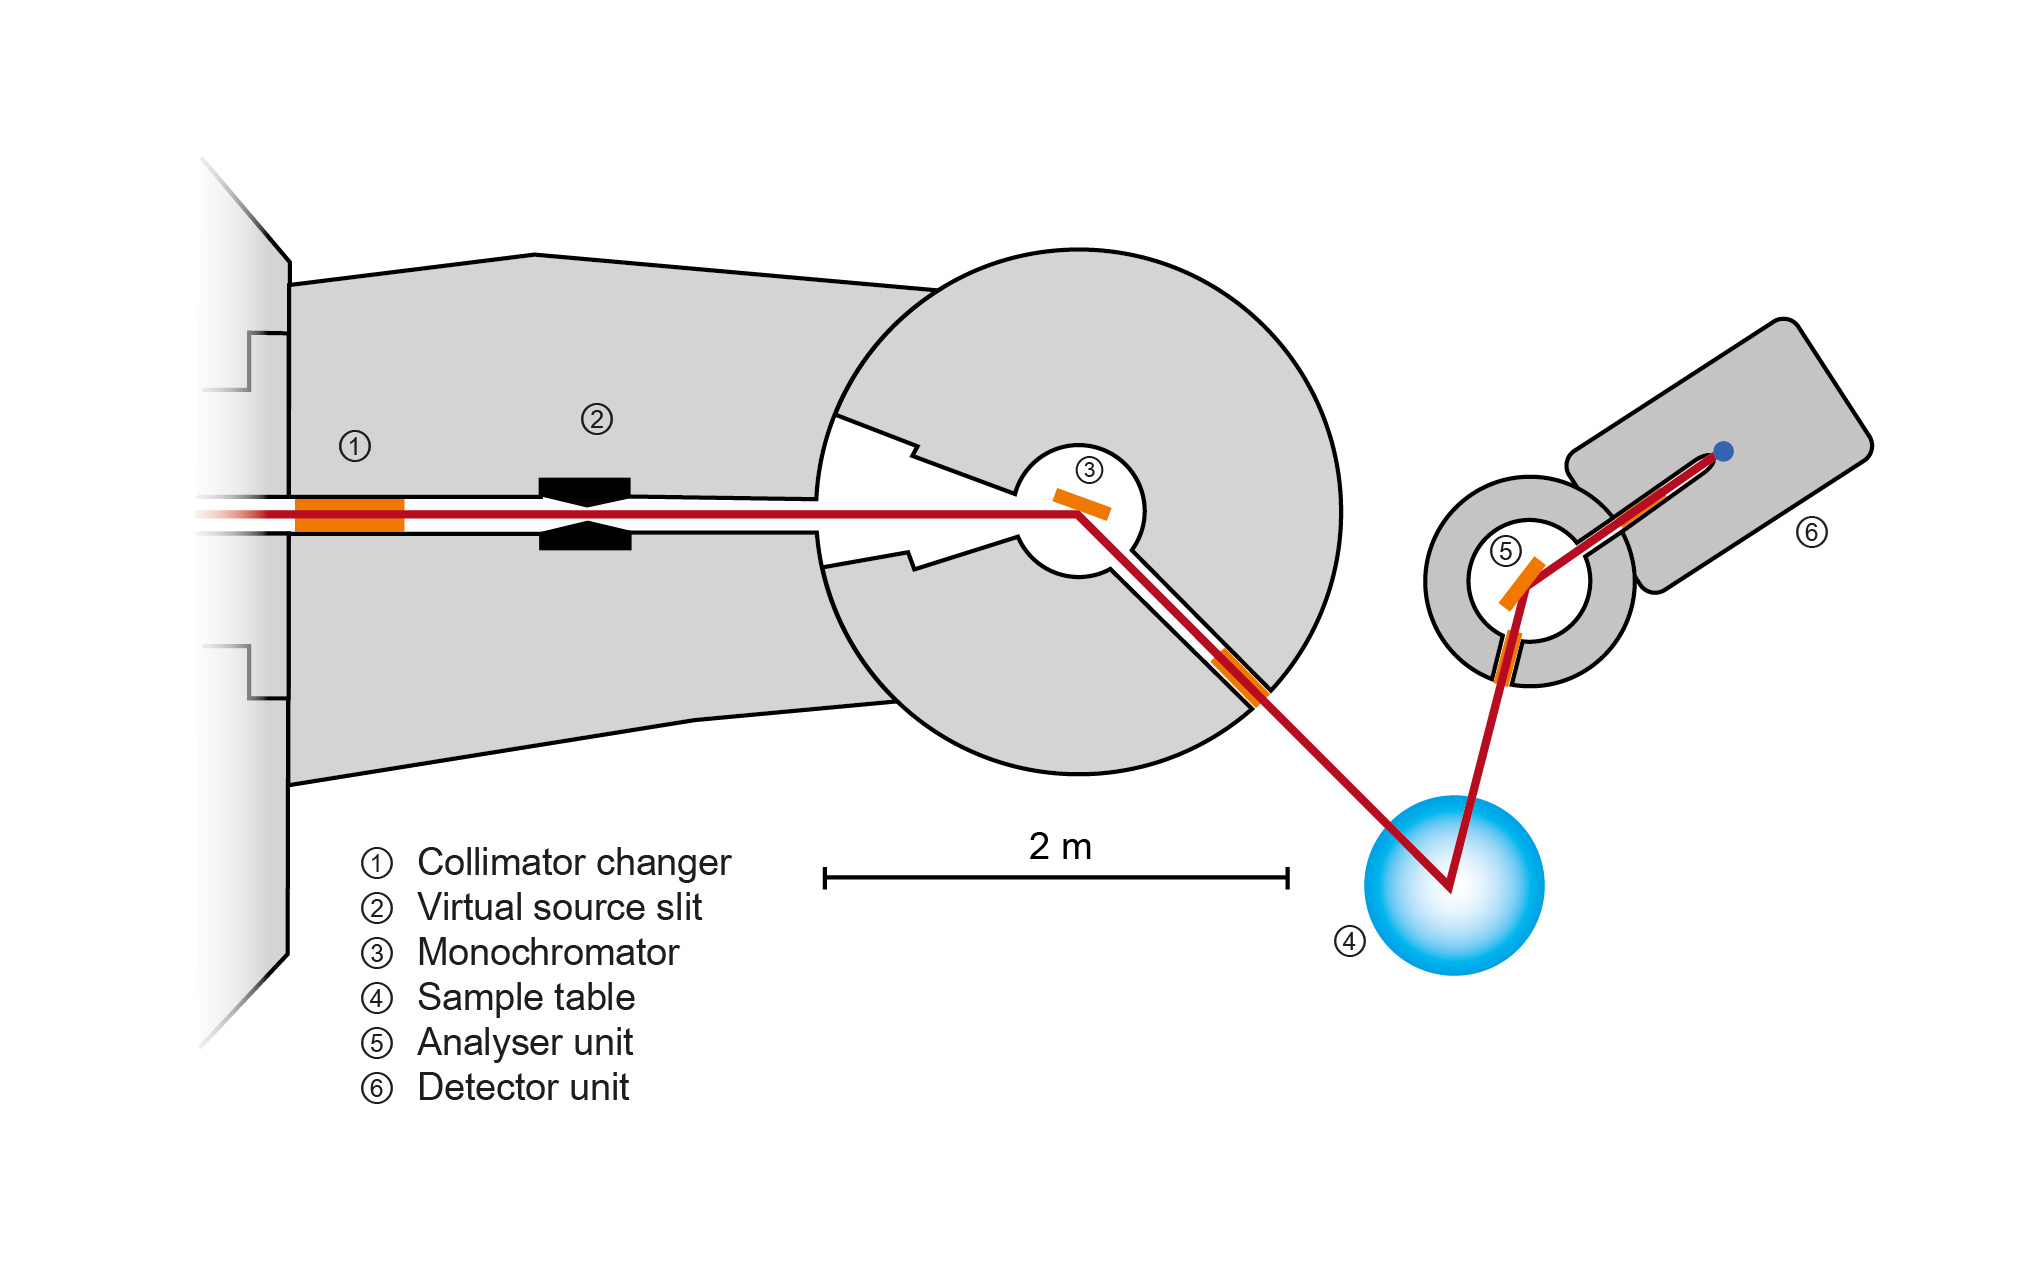
Figure 1: Scheme of the TAS PANDA (MLZ) [1]
In simple words, the material’s reciprocal space Q, representing momentum transfer, provides a coordinate system aligned to the atomic lattice and E denotes the energy loss or gain of the neutron due to the scattering process. The scattered neutrons are counted at a detector and determine the intensity at a particular point in Q-E space, which in turn is determined by the configuration of the instrument axes.
However, beam time at TAS is a valuable resource for experimenters due to its high demand and limited availability. Also, there are experimental scenarios where the intensity distribution is not known or the experimenters are unable to perform the measurements manually for a while. Thus, a quick overview is required for continuing the experiment with more detailed measurements. In this situation, experimenters commonly place measurement points manually on a grid and hope to resolve the intensity distribution with sufficient quality. It is therefore natural to ask whether we can improve the efficiency of this part of TAS experiments and make better use of the experimenter’s time. In Fig. 2, for example, we see an inefficient and efficient experiment for the same underlying intensity distribution.
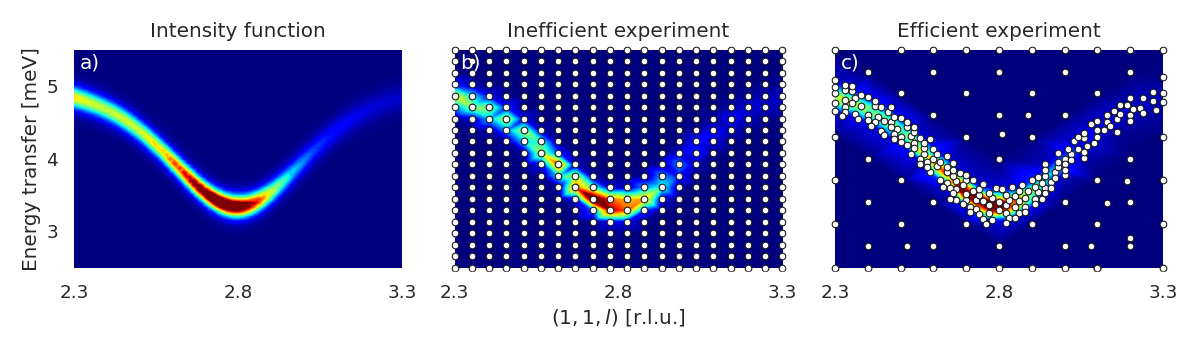
Figure 2: Example intensity distribution (a) with a corresponding inefficient (b) and efficient (c) experiment.
In this case, most of the interesting information is contained in regions of signal. Measurements in regions with no or parasitic signal such as the background (dark blue area) should therefore be avoided and their time used instead for more useful measurements in regions of signal. Note that, from an experimenter’s point of view, it is important to detect not only strong but also weak signals (Fig. 2c). So, at this point, the central task is to come up with an approach that detects the interesting regions of strong and weak signal autonomously, i.e., without human interference.
Our approach
From the field of artificial intelligence and machine learning, active learning as part of supervised learning provides a general framework that can be considered for this task of autonomous data acquisition. In contrast to other supervised learning methods, an active learning approach updates its own source of information and bases its further decisions on that. In our context, this means that such an approach sequentially collects intensity data while deciding autonomously where to place the next measurement.
For detecting and discovering regions of signal, we decided to use a probabilistic approach, i.e., our approach aims to approximate the intensity distribution by the mean function of a stochastic process and exploit the corresponding variance function, interpreted as approximation uncertainties, to place useful measurements. Therefore, we needed to find a stochastic process whose variance is largest in regions of signal, so that maximizing these uncertainties directly leads to a measurement point in these regions. It turned out that log-Gaussian processes meet this requirement perfectly as can be seen in Fig. 3.
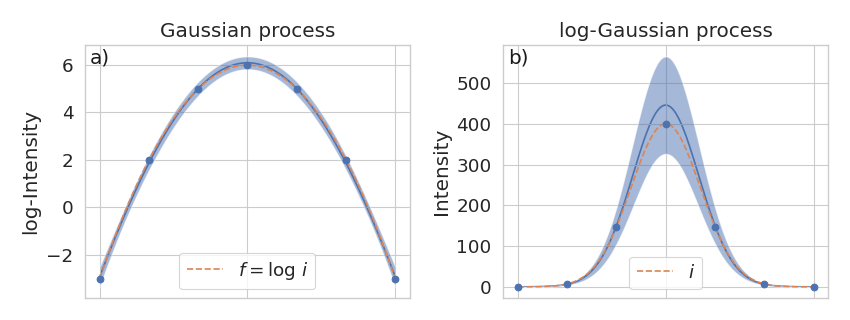
Figure 3: Log-Gaussian processes have largest uncertainties (light blue areas) in regions of signal.
The mathematical reason for that is not difficult to understand. Indeed, if Y = exp(X) for a random variable X ∼ N(μ, σ2), it holds that
Var(Y) = [exp(σ2)-1] ⋅ exp(2μ+σ2).
Note that μ, the mean of X, appears exponentially in the variance of the log-normal random variable Y. It is already clear intuitively that exponentiating X not only exponentiates its variance but also the related mean. Be aware that this is the whole secret behind our approach! Furthermore, by using log-Gaussian processes, we perfectly match the assumption of non-negative intensity distributions.
Actually, since the time to move the instrument axes in Q-E space depends on the new measurement location, we not only maximize the variance function of the log-Gaussian process, but also weight it with the costs of moving the instrument, so shorter distances are preferred.
Results
We demonstrated the benefits of our approach in the setting of a real neutron experiment and in a synthetic benchmark setting with numerous different intensity distributions.
Neutron experiment
As a first real neutron experiment, we investigated a sample of SnTe at the thermal TAS EIGER (PSI) [2]. Our general aim was to reproduce well-known results from [3, Fig. 1b]. It was a nice test case since the intensity distribution contains all aspects that could cause problems: strong and weak signals within the same region and isolated regions of signal with different intensity. The result is displayed in Fig. 4.
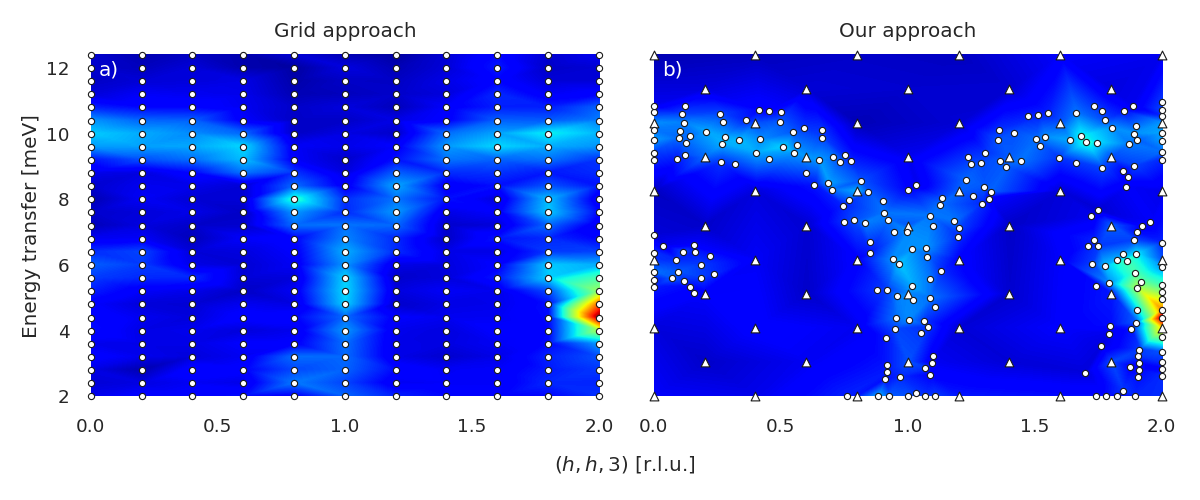
Figure 4: Results of the neutron experiment. Triangles show initial measurement points.
We see that our approach mainly places measurement points in regions of strong and weak signal. Except for the initial measurement points (triangles), almost none are placed in the background. In contrast, the grid approach placed many measurement points in the background, thus wasting valuable beam time.
Benchmark
In a synthetic but still representative benchmark setting, we were further testing our approach on numerous different intensity distributions. Indeed, we included crystal field and spin wave excitations, phonons, spinon continua, and manually manufactured functions with additional aspects. The test case intensity distributions are depicted in Fig. 5.
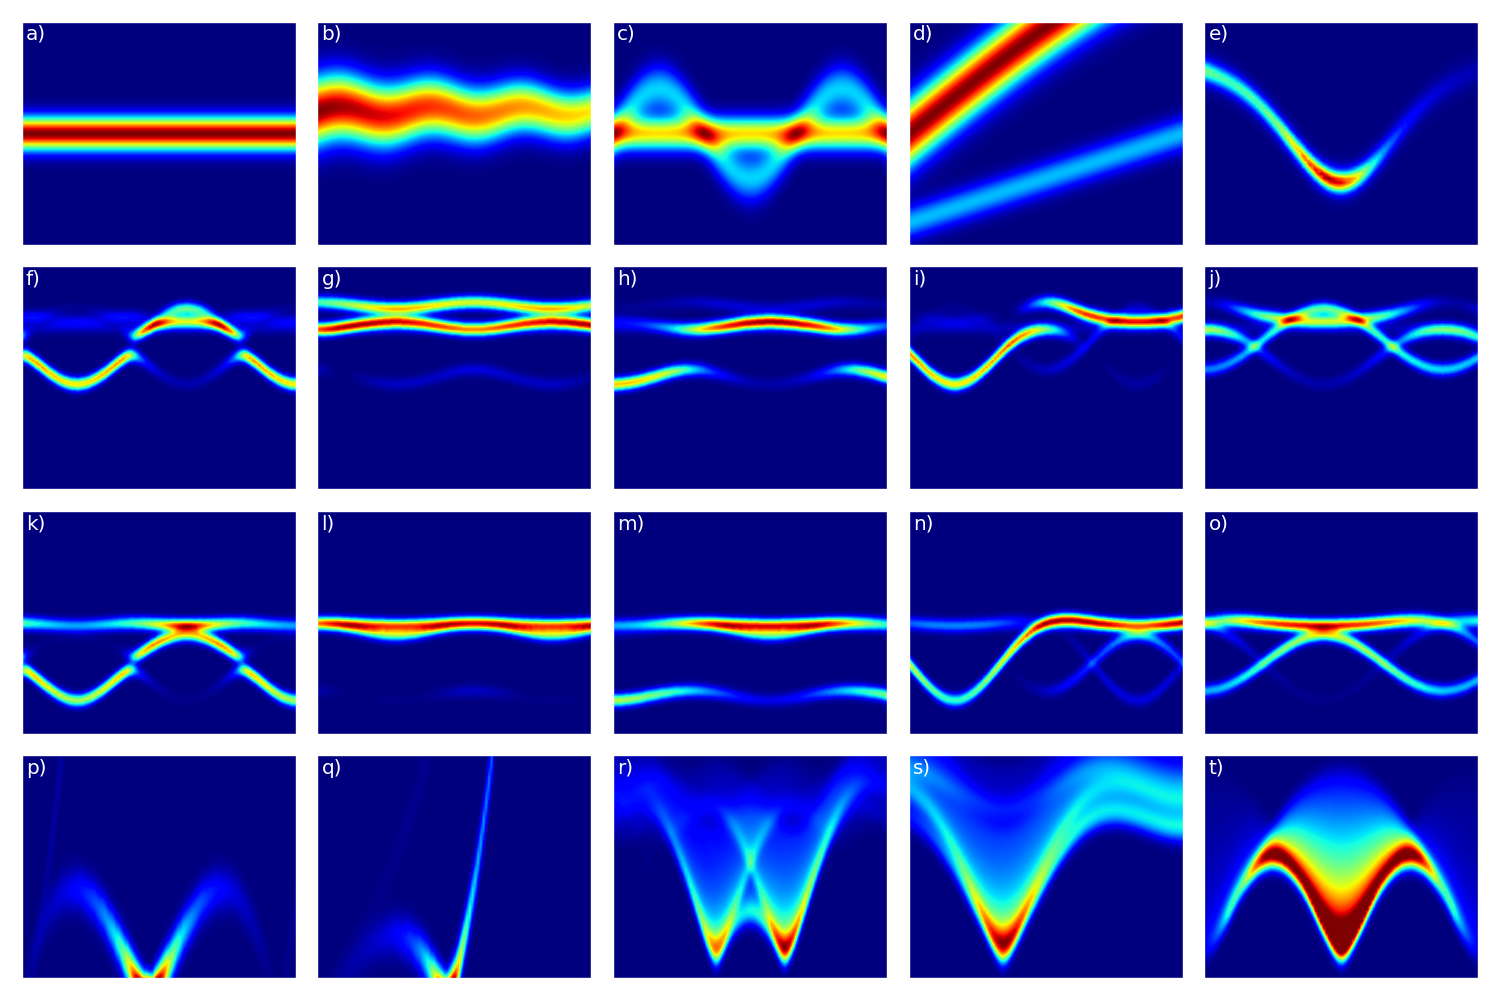
Figure 5: Intensity distributions of benchmark test cases.
Examples of particular experiments performed by our approach for each test case can be seen in Fig. 6.
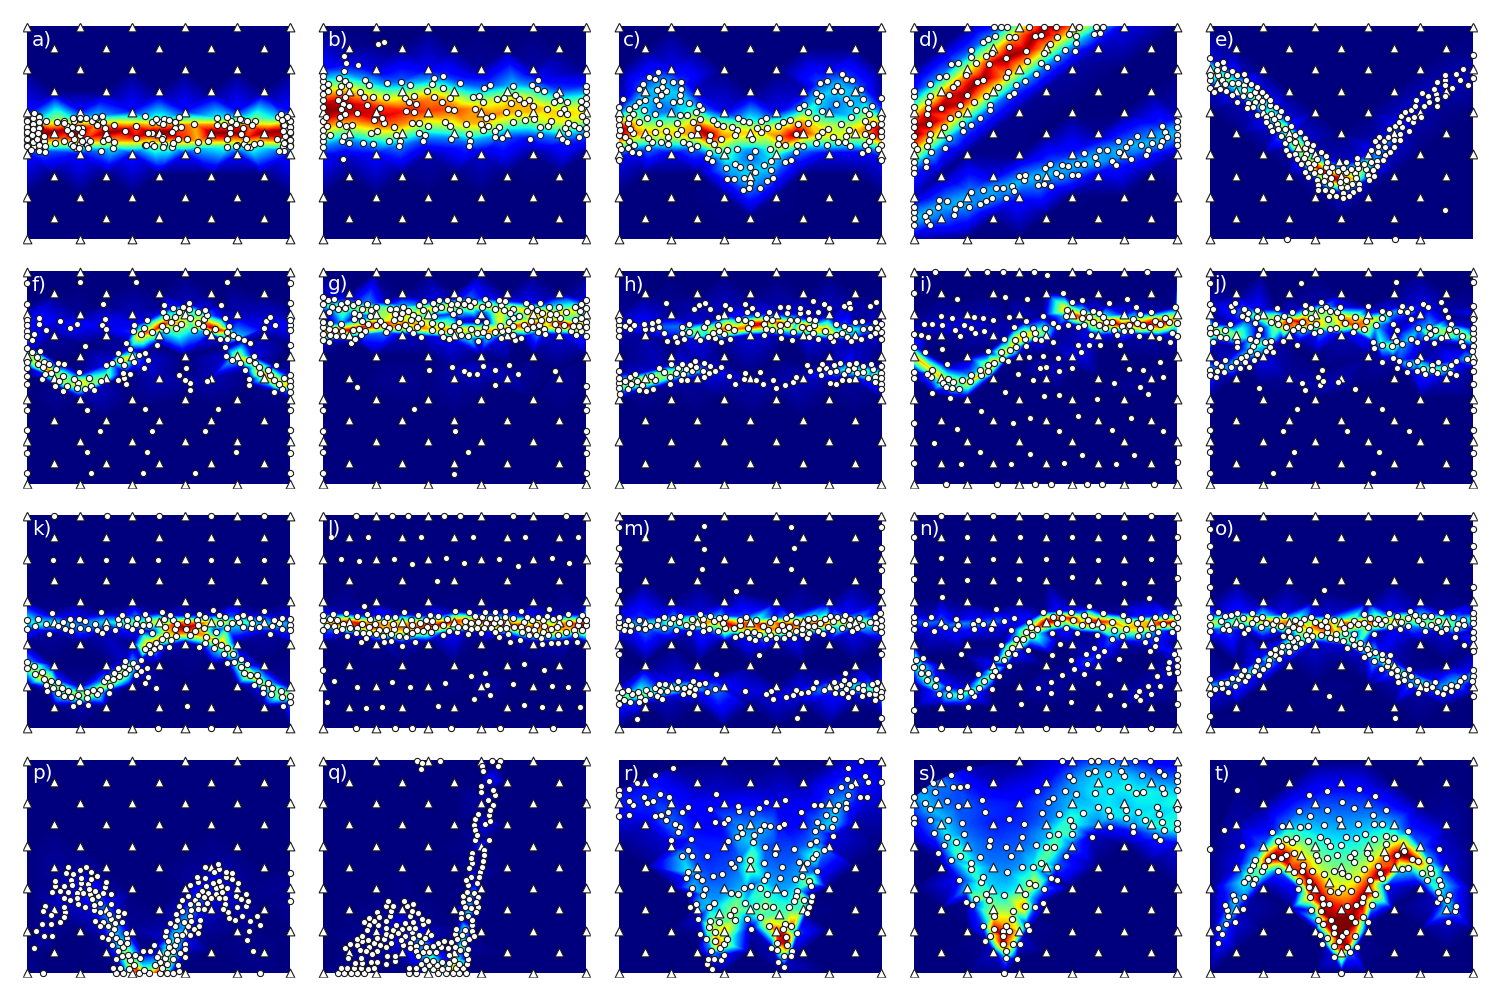
Figure 6: Examples of particular experiments performed by our approach for each benchmark test case. Triangles show initial measurement points.
After initialization (triangles), our approach mainly places measurement points in regions of signal and hence shows good performance. For a quantitative comparison of our approach with other approaches in this benchmark setting and studies of its robustness w.r.t. changes of its parameters, we refer the reader to our corresponding paper.
Note that these test case intensity distributions contain neither background nor experimental noise (Poisson count statistics) due to the benchmark's performance measure. However, we internally tested our approach on the test cases with simulated background and experimental noise to prepare for the neutron experiment mentioned above.
Finally, we would like to acknowledge the support of and discussions with our collaborators at ILL and PSI. If the reader also gets excited about autonomous neutron spectroscopy experiments, the corresponding authors of our paper would be pleased to receive an e-mail.
Software
The software implementation of our approach can be found from the repository at
https://jugit.fz-juelich.de/ainx/ariane/.
References
1. Schneidewind, A. & Cermak, P. PANDA: Cold three axes spectrometer. Journal of large-scale research facilities 1, A12 (2015). doi: 10.17815/jlsrf-1-35.
2. Stuhr, U. et al. The thermal triple-axis-spectrometer EIGER at the continuous spallation source SINQ. Nucl. Instrum. Methods Phys. Res. A: Accel. Spectrom. Detect. Assoc. Equip. 853, 16–19 (2017). doi: 10.1016/j.nima.2017.02.003.
3. Li, C. W. et al. Phonon self-energy and origin of anomalous neutron scattering spectra in SnTe and PbTe thermoelectrics. Phys. Rev. Lett. 112, 175501 (2014). doi: 10.1103/PhysRevLett.112.175501.
Follow the Topic
-
Nature Communications
An open access, multidisciplinary journal dedicated to publishing high-quality research in all areas of the biological, health, physical, chemical and Earth sciences.

Related Collections
With Collections, you can get published faster and increase your visibility.
Women's Health
Publishing Model: Hybrid
Deadline: Ongoing
Tumor Microenvironment Crosstalk and Therapeutic Implications
Publishing Model: Hybrid
Deadline: Nov 02, 2026


Please sign in or register for FREE
If you are a registered user on Research Communities by Springer Nature, please sign in