
The topic of the ideal city has been debated for centuries. In the fourth century BC, Plato, in his work "The Republic," focused on social justice and pondered the characteristics of an ideal city. He concluded that an ideal city would involve the harmonious cooperation of all its citizens. However, this utopian vision is quite different from the reality of how cities have developed over time. Currently, cities do not always promote harmonious cooperation. It is widely recognized that metropolitan areas are important centers of creativity and innovation, housing more than half of the world's population and driving progress in various fields such as science, technology, social development, and the arts. Nevertheless, modern cities are grappling with significant challenges, including socioeconomic inequalities that lead to unequal access to resources, opportunities, and public services. As cities expand, these inequalities can worsen if growth is not managed equitably.
The concept of "Proximity-based cities" is gaining recognition as a new urban organizational model. Specifically, the 15-minute city suggests that metropolitan areas can function more efficiently, equitably, and sustainably when crucial everyday services and essential amenities are within a 15-minute walk or bike ride. While the term itself is relatively new, the underlying idea has existed for a long time, rooted in how cities were designed before the advent of cars.
From the idea to the measurement
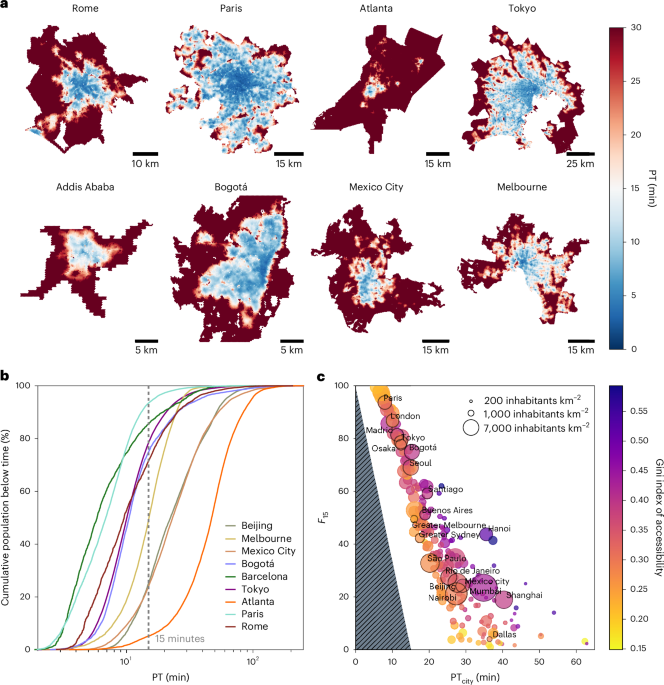
The paper A Universal Framework for Inclusive 15-minute Cities moved its first steps from the following question: how close are present cities worldwide to the ideal of the 15-minute city? To answer this, we have built a pipeline to assess how accessible the services included in the 15-minute basket for every location in a city, defining a suitable metric that we dub Proximity Time (PT). A crucial ingredient is represented by the location of the so-called Points of Interest (POIs), organised in the following categories: Outdoor activities, Learning, Supplies, Eating, Moving, Cultural Activities, Physical Exercise, Services, and Healthcare. This framework enables us to draw maps highlighting the 15-minuteness of present cities. As a result we produce maps that show hexagonal grids of cities. Each hexagon in the map is colour-coded based on its Proximity Time score, with blue areas indicating low PT (better accessibility), red areas indicating high PT (poorer accessibility), and white areas representing locations around the 15-minute accessibility mark.

We analysed almost all cities worldwide with more than 40k inhabitants, about 10k in total, and the results are freely accessible through our online platform. Similar analyses can also be found by different authors, performed in recent years. This is, however, just the first data analysis part of the work described here. The emerging picture is a profound heterogeneity in accessibility patterns within and across cities.
A world of inequalities
Typically, city centres are more 15-minute than the peripheries and the outskirts. Stark contrasts also exist when comparing different cities, with only a tiny fraction of the city area very well positioned to be 15-minute and an extensive distribution on more or less large values of the score. We can illustrate these heterogeneities through a scatter plot of two significant quantities, the population-weighted average Proximity Time of a city, dubbed PTcity , vs the fraction of the population living in a 15-minute condition, named F15 .
.png "Some city average scores of accessibility.")
From this figure we observe that the Gini index shows an increasing trend with PTcity, indicating that the least accessible cities also exhibit a higher level of inequality. Therefore, relying solely on the population-weighted average of Proximity Time is insufficient to describe a city, as this average may stem from either a very uniform accessibility pattern or a significantly uneven one.
Towards equal accessibility
After evaluating the current state of our cities, our next consideration was whether we could enhance the situation and increase the percentage of the population within a 15-minute reach of urban services. To address this question, we conducted a simulation where we relocated services to ensure that accessibility was more evenly distributed across cities. This involved using a unique algorithm that takes into account the 15-minute reachability of Points of Interest (POIs) by the resident population. In other words, the algorithm prioritizes proximity, placing services near people where needed, within a 15-minute radius.
.png "Percentage of relocated services to reach the proximity ideal")
after relocating them according to the resident population.
One of the outcomes of this experiment is a ranking of the percentage of POIs that needed to be relocated in the optimal condition given the same number of existing POIs. A first important observation is that the overall improvement of the 15-minuteness of a city causes an improved Robin Hood effect: one does not destroy good proximity neighbourhoods to make suburban areas a bit better. Quite the opposite is true: typically, city centres are so well-served that a small reallocation of services to less central areas does not impact their good accessibility patterns. At the scale of cities, we can also appreciate that cities known for their car-centric designs, such as Atlanta and other North American cities, must relocate a high percentage of POIs, over 70% in some cases. Conversely, certain European cities, including Milan, Copenhagen, Lisbon and Paris, already possess a well-optimised distribution of services. Here, the need for relocation is minimal, reinforcing the effectiveness of the present urban design in making the city walkable and accessible.
Can the 15-minute city model be sustained?
Another question came naturally. If we assume that a city is in the ideal proximity configuration where the services are proportional to the resident population, are cities going to need the same amount of services to become 15-minute cities? And. if not, what is a necessary population density to sustain the model? What is the sufficiently dense concentration of people needed?

is highly heterogeneous and unsustainable for some cities.
Suppose we can provide an ever-increasing number of services. Then even cities with very low population densities will eventually become perfectly accessible, meaning that services will always be very close to each resident. However, due to their vast differences in densities, sizes, and population distributions, each city will require a different number of amenities to achieve a 15-minute proximity time. By varying the number of services as a parameter, we can determine the number of POIs per capita needed for each city to become a 15-minute city: a potential to achieve a proximity city. Some less-dense cities may struggle to sustain enough amenities per capita, while others have the potential to be a 15-minute city but do not fully comply with it yet. There is probably a sustainable threshold that depends on the category of services and the market, which could provide a good starting point for further investigation.
So what's the message?
The findings suggest two conclusions. Firstly, the 15-minute city concept is not utopian. Several cities already have this structure, designed to be accessible without relying on cars. Cities don't need to be extremely dense; they can have a mix of high-rise buildings and suburban homes, providing green spaces, public areas, social interactions, and essential services. Secondly, there's no one-size-fits-all solution for cities. Different areas within the same city have diverse accessibility patterns. When comparing different cities, some can be optimized for the 15-minute city concept, while others may require densification or different urban organizational models.
The concept of proximity cannot be the ultimate solution for all cities. While decentralizing activities and opportunities can help counter car-centric urban sprawl, long-distance accessibility remains essential, requiring efficient public transit. Proximity is part of a broader framework called chrono-urbanism, which emphasizes the importance of time in city planning. However, other factors, such as the values of places and local population density, are also crucial for creating a good city. In areas with low population density and urban sprawl, implementing a 15-minute city is impractical. Therefore, a more comprehensive approach is needed to ensure democratic access to opportunities, whether they are nearby (i.e., reachable by foot or bicycle) or far (i.e., reachable by efficient public transport). While the proximity paradigm is valuable, city planning should consider broader aspects to prevent exacerbating existing inequalities.
Follow the Topic
-
Nature Cities
This journal aims to deepen and integrate basic and applied understanding of the character and dynamics of cities, including their roles, impacts and influences — past, present and future.

What are SDG Topics?
An introduction to Sustainable Development Goals (SDGs) Topics and their role in highlighting sustainable development research.
Continue reading announcement


Please sign in or register for FREE
If you are a registered user on Research Communities by Springer Nature, please sign in