VitalML: Predicting Patient Decompensation from Continuous Physiologic Monitoring in the Emergency Department
Published in Healthcare & Nursing
Imagine walking into a bustling emergency department (ED): doctors and nurses are darting around, caring for many complex patients simultaneously, and the waiting room is packed. Who needs help first? Who can wait to be seen, and who cannot? This decision-making process of prioritizing patients' evaluation and treatment based on the time sensitivity of their condition is known as triage (Figure 1). Triage is a daunting task, especially because apparently stable patients can suddenly worsen.

Figure 1. Basic triaging process. Patients arrive from the ambulance or as walk-ins and are subsequently assigned priority for rooming and treatment (simplified in Figure).
Many hospitals use early warning scores based on vital signs and other patient characteristics to predict mortality or decompensation, which often entails worsening of one or more vital signs such as heart rate, oxygen saturation, or blood pressure. For those who present to the ED without these physiologic abnormalities, however, there is no well-established protocol for predicting decompensation.
In fact, decompensation in initially stable patients is not uncommon. Some studies have shown that one in seven ED patients experience clinical decompensation (1), with up to one in eight experiencing unreported decompensation (i.e., development of abnormal vital signs without clinician notification), particularly in overcrowded EDs and among elderly patients (2).
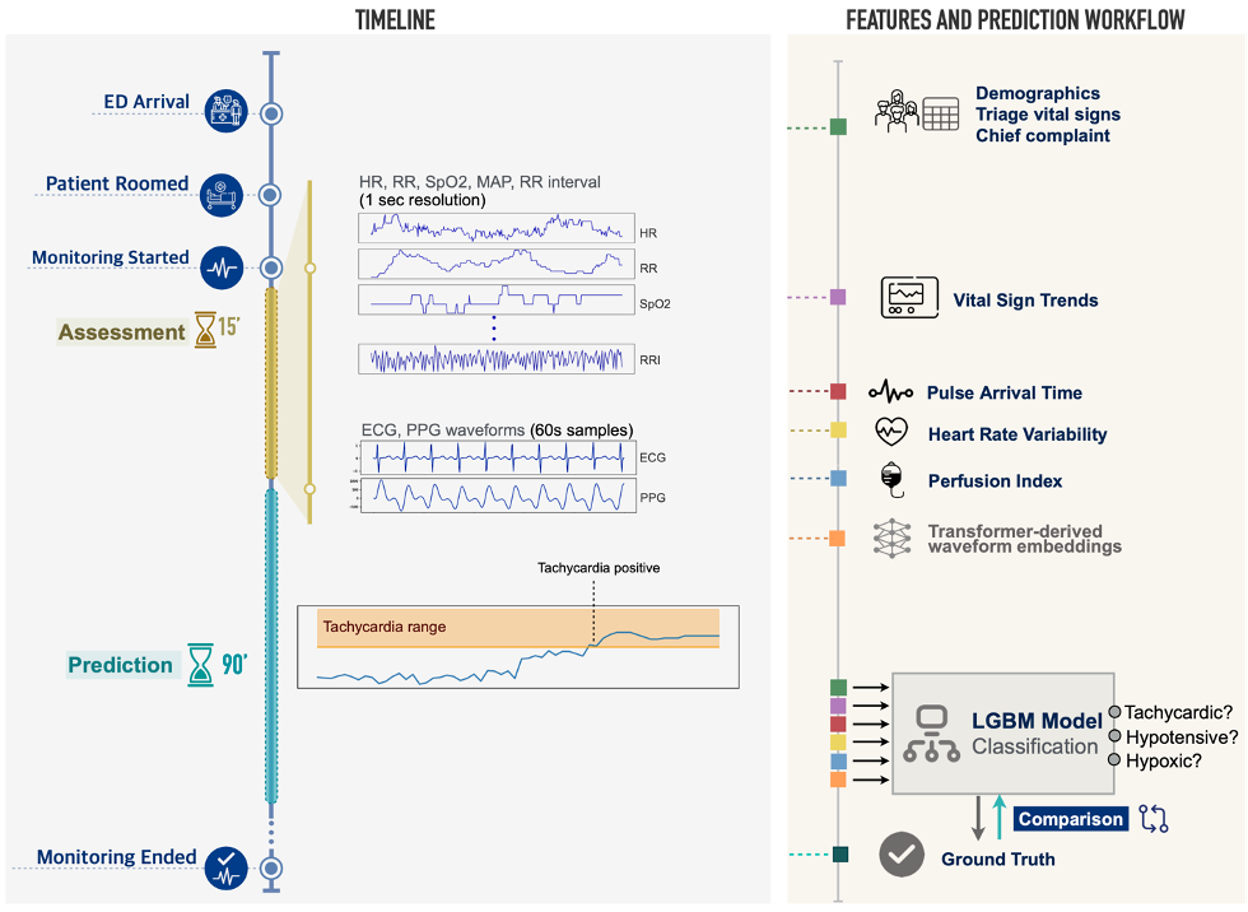
To address this, our team used routinely collected but seldom studied continuous monitoring signals from nearly 20,000 visits to the Stanford Health Care Emergency Department. We built VitalML, a system that uses machine learning algorithms to integrate a variety of patient data and predict whether initially stable patients will experience physiologic decompensation (new tachycardia, hypotension, or hypoxia) in the next 90 minutes. We did this by integrating high-resolution data from the first 15 minutes of patient monitoring, including continuous readings of cardiac activity electrocardiogram or ECG), the pulse waveform (photoplethysmography or PPG), and moment-to-moment changes in vital signs and other features (Figure 2). This data is routinely collected but seldom stored or analyzed; to our knowledge, ours is the first study using continuous, detailed physiologic data for near-term clinical predictions in a diverse ED population.

Figure 2. Data sources and modeling approach. Patient demographics, chief complaint, and initial vital signs are collected upon ED arrival. After rooming, and concurrent with other workup, the patient enters a 15-minute assessment period during which six numeric measures (HR, RR, SpO2, MAP, Beat-to-Beat RR Interval, Perfusion Index) are recorded at 1-second resolution, and 60-second segments of lead-II ECG and PPG waveforms are sampled. Triage data and vital sign trends are combined with physiologic measures derived from RR intervals and ECG/PPG waveforms (heart rate variability, pulse arrival time), as well as deep learning-derived representations of ECG and PPG waveforms, in a model that predicts whether a patient will develop tachycardia, hypotension, or hypoxia in the 90 minutes following the initial assessment period.
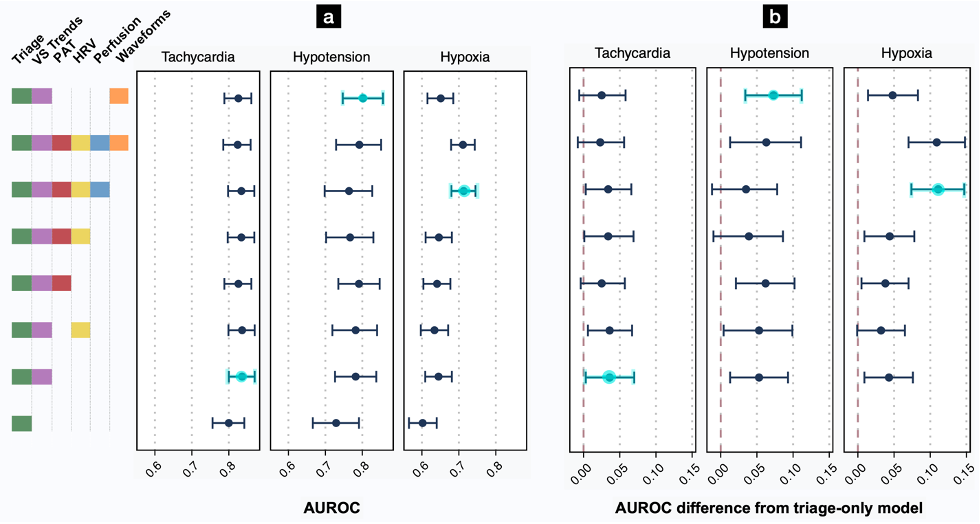
To assess the predictive value of the many data points collected in the first minutes of an ED patient’s care (vital signs and chief complaint at triage, continuous vital signs from initial monitoring, and features derived from the ECG and PPG waveforms), we compared the prediction performance of models incorporating different combinations of features. We summarized prediction performance with their area under the receiver operating characteristic curve (AUROC), where higher values indicate better accuracy in the prediction of patient decompensation. The best-performing models used both conventional triage features (e.g. age, gender, triage vital signs, etc.) as well as features derived from a 15-minute period of continuous monitoring (e.g. vital sign trends, ECG and PPG derived features), and predicted new tachycardia with AUROC of 0.836 (95% CI, 0.800–0.870), new hypotension with AUROC of 0.802 (95% CI, 0.747–0.856), and new hypoxia with AUROC of 0.713 (95% CI, 0.680–0.745) in a held-out test set of visits chronologically following those used in training and validation (Figure 3).

Figure 3. Effect of feature types on AUROC for prediction of decompensation. (a) AUROC point estimates with bootstrapped 95% CIs represent prediction performance on the test set (see also Tables S1-S2). (b) AUROC differences from the baseline triage model with 95% CIs. For each outcome, additional monitoring features produced more accurate predictions than the baseline triage model. “Triage” variables include age, gender, triage vital signs, and chief complaint. “VS Trends” denotes first vital signs from continuous monitoring, and the linear trends of each vital sign over a 15-minute assessment period. “PAT” denotes pulse arrival time, calculated from the ECG and PPG waveforms. “HRV” is a suite of heart rate variability measures. “Perfusion” is the perfusion index. “Waveforms” indicates an 8-dimensional embedding generated from a transformer model, with 4 features each from the PPG and ECG waveforms. The best-performing model for each outcome is highlighted in light blue.
For each type of decompensation, models using features from a 15-minute period of passive monitoring significantly outperformed models restricted to conventional triage features. Though trends in vital signs indeed proved vital for these predictions, other waveform features improved discrimination over vital sign trends alone. We concluded that our framework offers a proof-of-principle for the automated prediction of decompensation in initially stable ED patients.
VitalML, if prospectively validated, could be used to improve the triage of initially stable patients at risk for decompensation, and could even be applied continuously for real-time estimates of near-term clinical deterioration.
References
- Lambe, K., Currey, J. & Considine, J. Frequency of vital sign assessment and clinical deterioration in an Australian emergency department. Australas. Emerg. Nurs. J. 19, 217–222 (2016).
- Scott, B. M., Considine, J. & Botti, M. Unreported clinical deterioration in emergency department patients: a point prevalence study. Australas. Emerg. Nurs. J. 18, 33–41 (2015).
Follow the Topic
-
npj Digital Medicine

An online open-access journal dedicated to publishing research in all aspects of digital medicine, including the clinical application and implementation of digital and mobile technologies, virtual healthcare, and novel applications of artificial intelligence and informatics.
Related Collections
With Collections, you can get published faster and increase your visibility.
Digital Health Equity and Access
Publishing Model: Open Access
Deadline: Mar 03, 2026
Evaluating the Real-World Clinical Performance of AI
Publishing Model: Open Access
Deadline: Jun 03, 2026


Please sign in or register for FREE
If you are a registered user on Research Communities by Springer Nature, please sign in
Really interesting read. Thank you for sharing. And outstanding figures! Working in an ER myself, I can really relate to the idea you propose here.