Witnessing Mt. Etna’s 2025 Eruption – Through the Eyes of Space
Published in Earth & Environment
Explore the Research
Multi-platform satellite-derived products during the 2025 Etna eruption - Scientific Data
Scientific Data - Multi-platform satellite-derived products during the 2025 Etna eruption
The 2025 Etna eruption
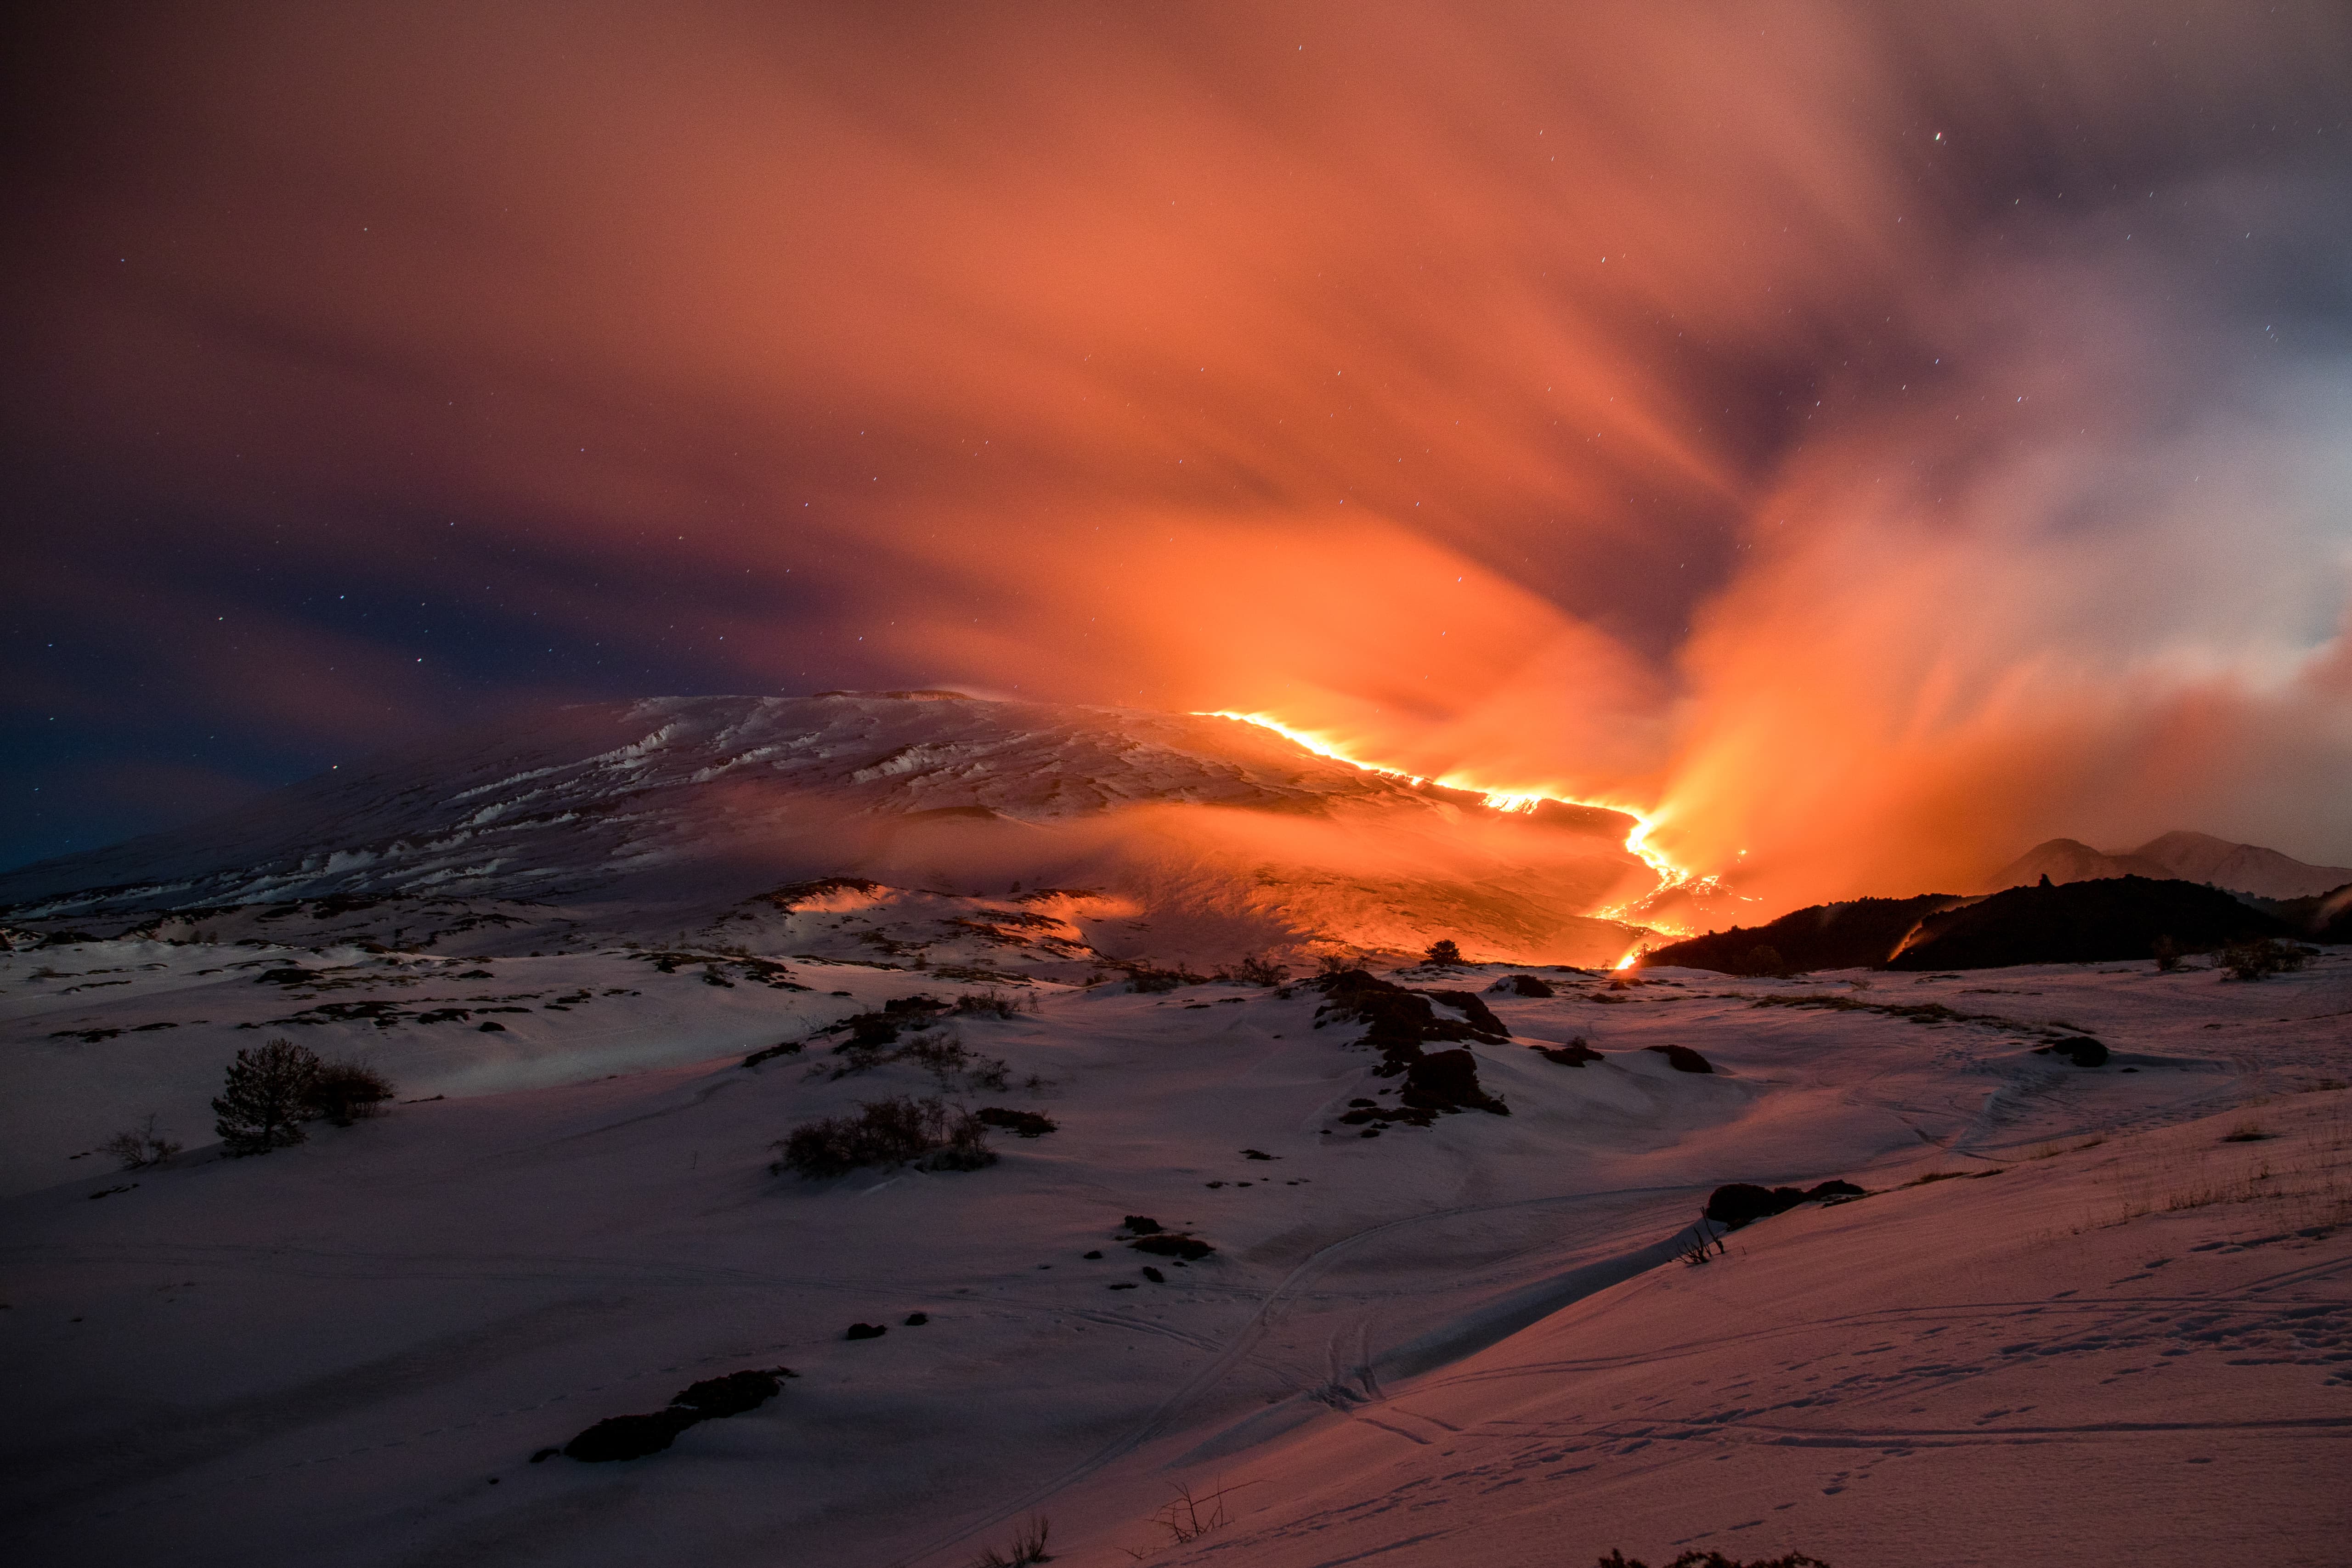
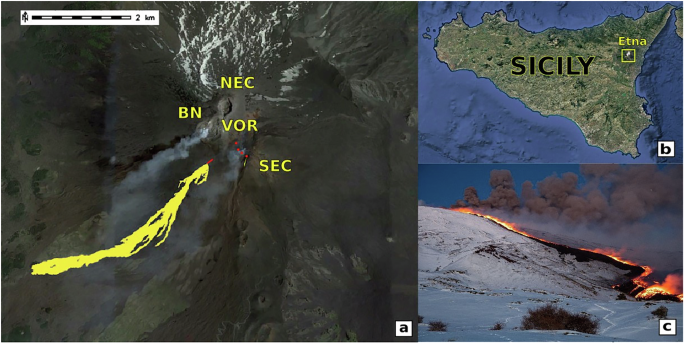
The eruption began on February 6 with mild Strombolian explosions from the South-East Crater (SEC), the youngest of Etna’s four summit craters. This was followed on February 8 by lava effusion from a fissure at the base of the Bocca Nuova (BN) summit crater, at an elevation of approximately 3,050 metres above sea level (a.s.l.). Lava flows advanced rapidly over snow-covered slopes, causing explosive interactions with the snowpack, and reached elevations as low as 1,960 m a.s.l. by February 13. Intermittent phases of both Strombolian and effusive activity continued until March 2, including renewed lava effusion and crater overflows from both SEC and BN.

This eruption marked the debut of the Meteosat Third Generation (MTG) in volcanic observation. Its Flexible Combined Imager (FCI) delivered detailed mid-infrared images every 10 minutes — a leap forward in both resolution and frequency.
Paired with the legacy SEVIRI sensor, and modern instruments like VIIRS, MODIS, and the ultra-high-resolution Skysat and PlanetScope constellations, a multi-dimensional picture of Etna’s behavior was captured from heat and motion to gas emissions.
Breaking Down the Data: What Satellites Saw
Speed and quantity of lava being released (Volume)
Using thermal data processed through the CL-HOTSAT system, the Time-Averaged Discharge Rate (TADR) was calculated— essentially, how fast lava was pouring out of the volcano. By combining data from SEVIRI, MODIS, VIIRS, and FCI, they estimated lava volumes and detected hotspot locations in near real-time.
Mapping Lava Fields (Area)
High-resolution images from Skysat and PlanetScope enabled analysts to track the shape and growth of the lava field over time — specifically on February 9, 11, 12, 17, 21, 24, 26, and March 4. These satellite passes mapped lava expansion to nearly 0.94 km², matching and even exceeding field observations.
3D Mapping with Pléiades (Thickness)
To assess how much material was deposited, Digital Surface Models (DSMs) of the topography were created by using Pléiades tri-stereo imagery — applying photogrammetry to 3D reconstruction from space. Pléiades imagery were acquired thanks to the Mt Etna supersite initiative (http://geo-gsnl.org/supersites/permanent-supersites/mt-etna-volcano-supersite-new/). By comparing pre- and post-eruption topography, lava thicknesses and total volume deposited were estimated. The final product: a 5-meter resolution topographic map covering 95 km².
Tracking Gas Emissions (Degassing Magma/Lava)
The Sentinel-5P TROPOMI instrument detected and quantified sulfur dioxide (SO₂) emissions using a novel image clustering technique. SO₂ is a key tracer of volcanic degassing and helps infer magma supply dynamics. Peaks in gas release on February 20 and 26 aligned closely with increases in lava effusion — an important clue to understanding the volcano’s plumbing.
 The TADR from SEVIRI (yellow diamonds), FCI (green diamonds), MODIS (red diamonds), and VIIRS (blue diamonds) data, together with the daily SO2 total mass from TROPOMI (gray bars); (b) The evolution of the lava flow field from Skysat and PlanetScope imagery; (c) The volcanic deposits obtained by differencing Pléiades-derived DSMs.")
Why It Matters
The availability of multi-source multi-temporal satellite data streams allowed for:
-
Timely hazard assessments — including lava flow mapping and gas plume tracking.
-
Volumetric modeling of lava deposits, crucial for long-term risk mitigation.
- Better understanding of eruption dynamics, linking surface behavior to subsurface processes.
Perhaps most importantly, this event demonstrates how integrated satellite systems can now provide near-continuous monitoring of volcanic activity, bridging the gap between scientific understanding and disaster response.
The derived lava volume from DSM differencing was 5.05 ± 0.9 × 10⁶ m³, closely matching the CL-HOTSAT-derived thermal volume estimate of 5.37 ± 0.8 × 10⁶ m³, confirming the consistency between the topographic and radiative approaches. Temporal correlation between SO₂ emissions with effusive output suggests a coupled relationship between magma supply and degassing processes.
Validation of all products was carried out using drone surveys, thermal camera observations, and field mapping by INGV-OE. DSM accuracy was assessed with GNSS ground control points, showing vertical residuals within ±3.6 m and a mean error of 0.02 m. The consistency of lava flow lengths, areas, and altitudinal fronts with ground observations confirms the reliability of the EO-derived products. SO₂ flux trends also align with proximal gas measurements, further supporting the validity of the remote sensing estimates.
What’s Next?
As satellites continue to evolve — with better resolution, faster revisit times, and more spectral bands — so too does our ability to watch and understand Earth’s most dynamic landscapes. The 2025 Etna eruption stands as a proof-of-concept: not only of the power of satellite remote sensing but of how close we are to real-time, global volcanic surveillance.
For those living near volcanoes, that’s more than science — it’s safety.
Want to explore the data?
Ganci, G., Bilotta, G., Dozzo, M. et al. Multi-platform satellite-derived products during the 2025 Etna eruption. Sci Data 12, 1353 (2025). https://doi.org/10.1038/s41597-025-05545-0
All satellite-derived products from the 2025 Etna eruption are available under a CC BY 4.0 license here: https://doi.org/10.6084/m9.figshare.28759586
This research was supported by the INGV project Pianeta Dinamico (grant number: CUP D53J19000170001) funded by the Italian Ministry of University and Research (“Fondo finalizzato al rilancio degli investimenti delle amministrazioni centrali dello Stato e allo sviluppo del Paese”, legge 145/2018), Volcanological Theme SAFARI (An Artificial Intelligence-based StrAtegy For volcAno hazaRd monItoring from space).
Follow the Topic
-
Scientific Data
A peer-reviewed, open-access journal for descriptions of datasets, and research that advances the sharing and reuse of scientific data.

Related Collections
With Collections, you can get published faster and increase your visibility.
Genomics in freshwater and marine science
Publishing Model: Open Access
Deadline: Jul 23, 2026
Computer vision in plant science and agriculture
Publishing Model: Open Access
Deadline: Jul 10, 2026


Please sign in or register for FREE
If you are a registered user on Research Communities by Springer Nature, please sign in