A genotype-phenotype-fitness map for stick insect colour
Published in Ecology & Evolution
Despite the term adaptation being used all the time to explain evolutionary processes, it is effectively very difficult to be demonstrated. It involves depicting how a phenotype allows organisms to survive and/or to reproduce better, and to nail down the genetic basis underlying this process (i.e. to determine the genomic regions controlling the trait, and how alleles’ frequencies change in response to selective pressures). In addition, considering more than one locus might be involved, it is important to understand how interactions between their different alleles (i.e. epistasis) affect adaptation. In our recently published manuscript (Nosil et al., 2020), we explored these very fundamental questions using Timema stick insects, where we show how ecology explains the whole genotype-phenotype-fitness map.
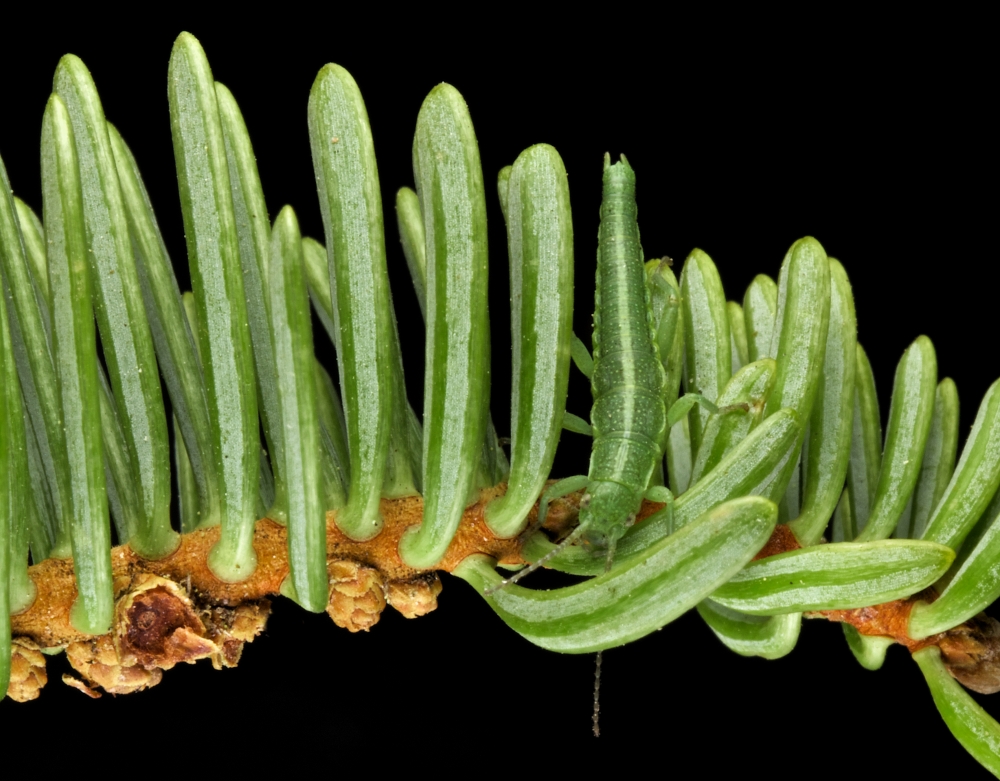
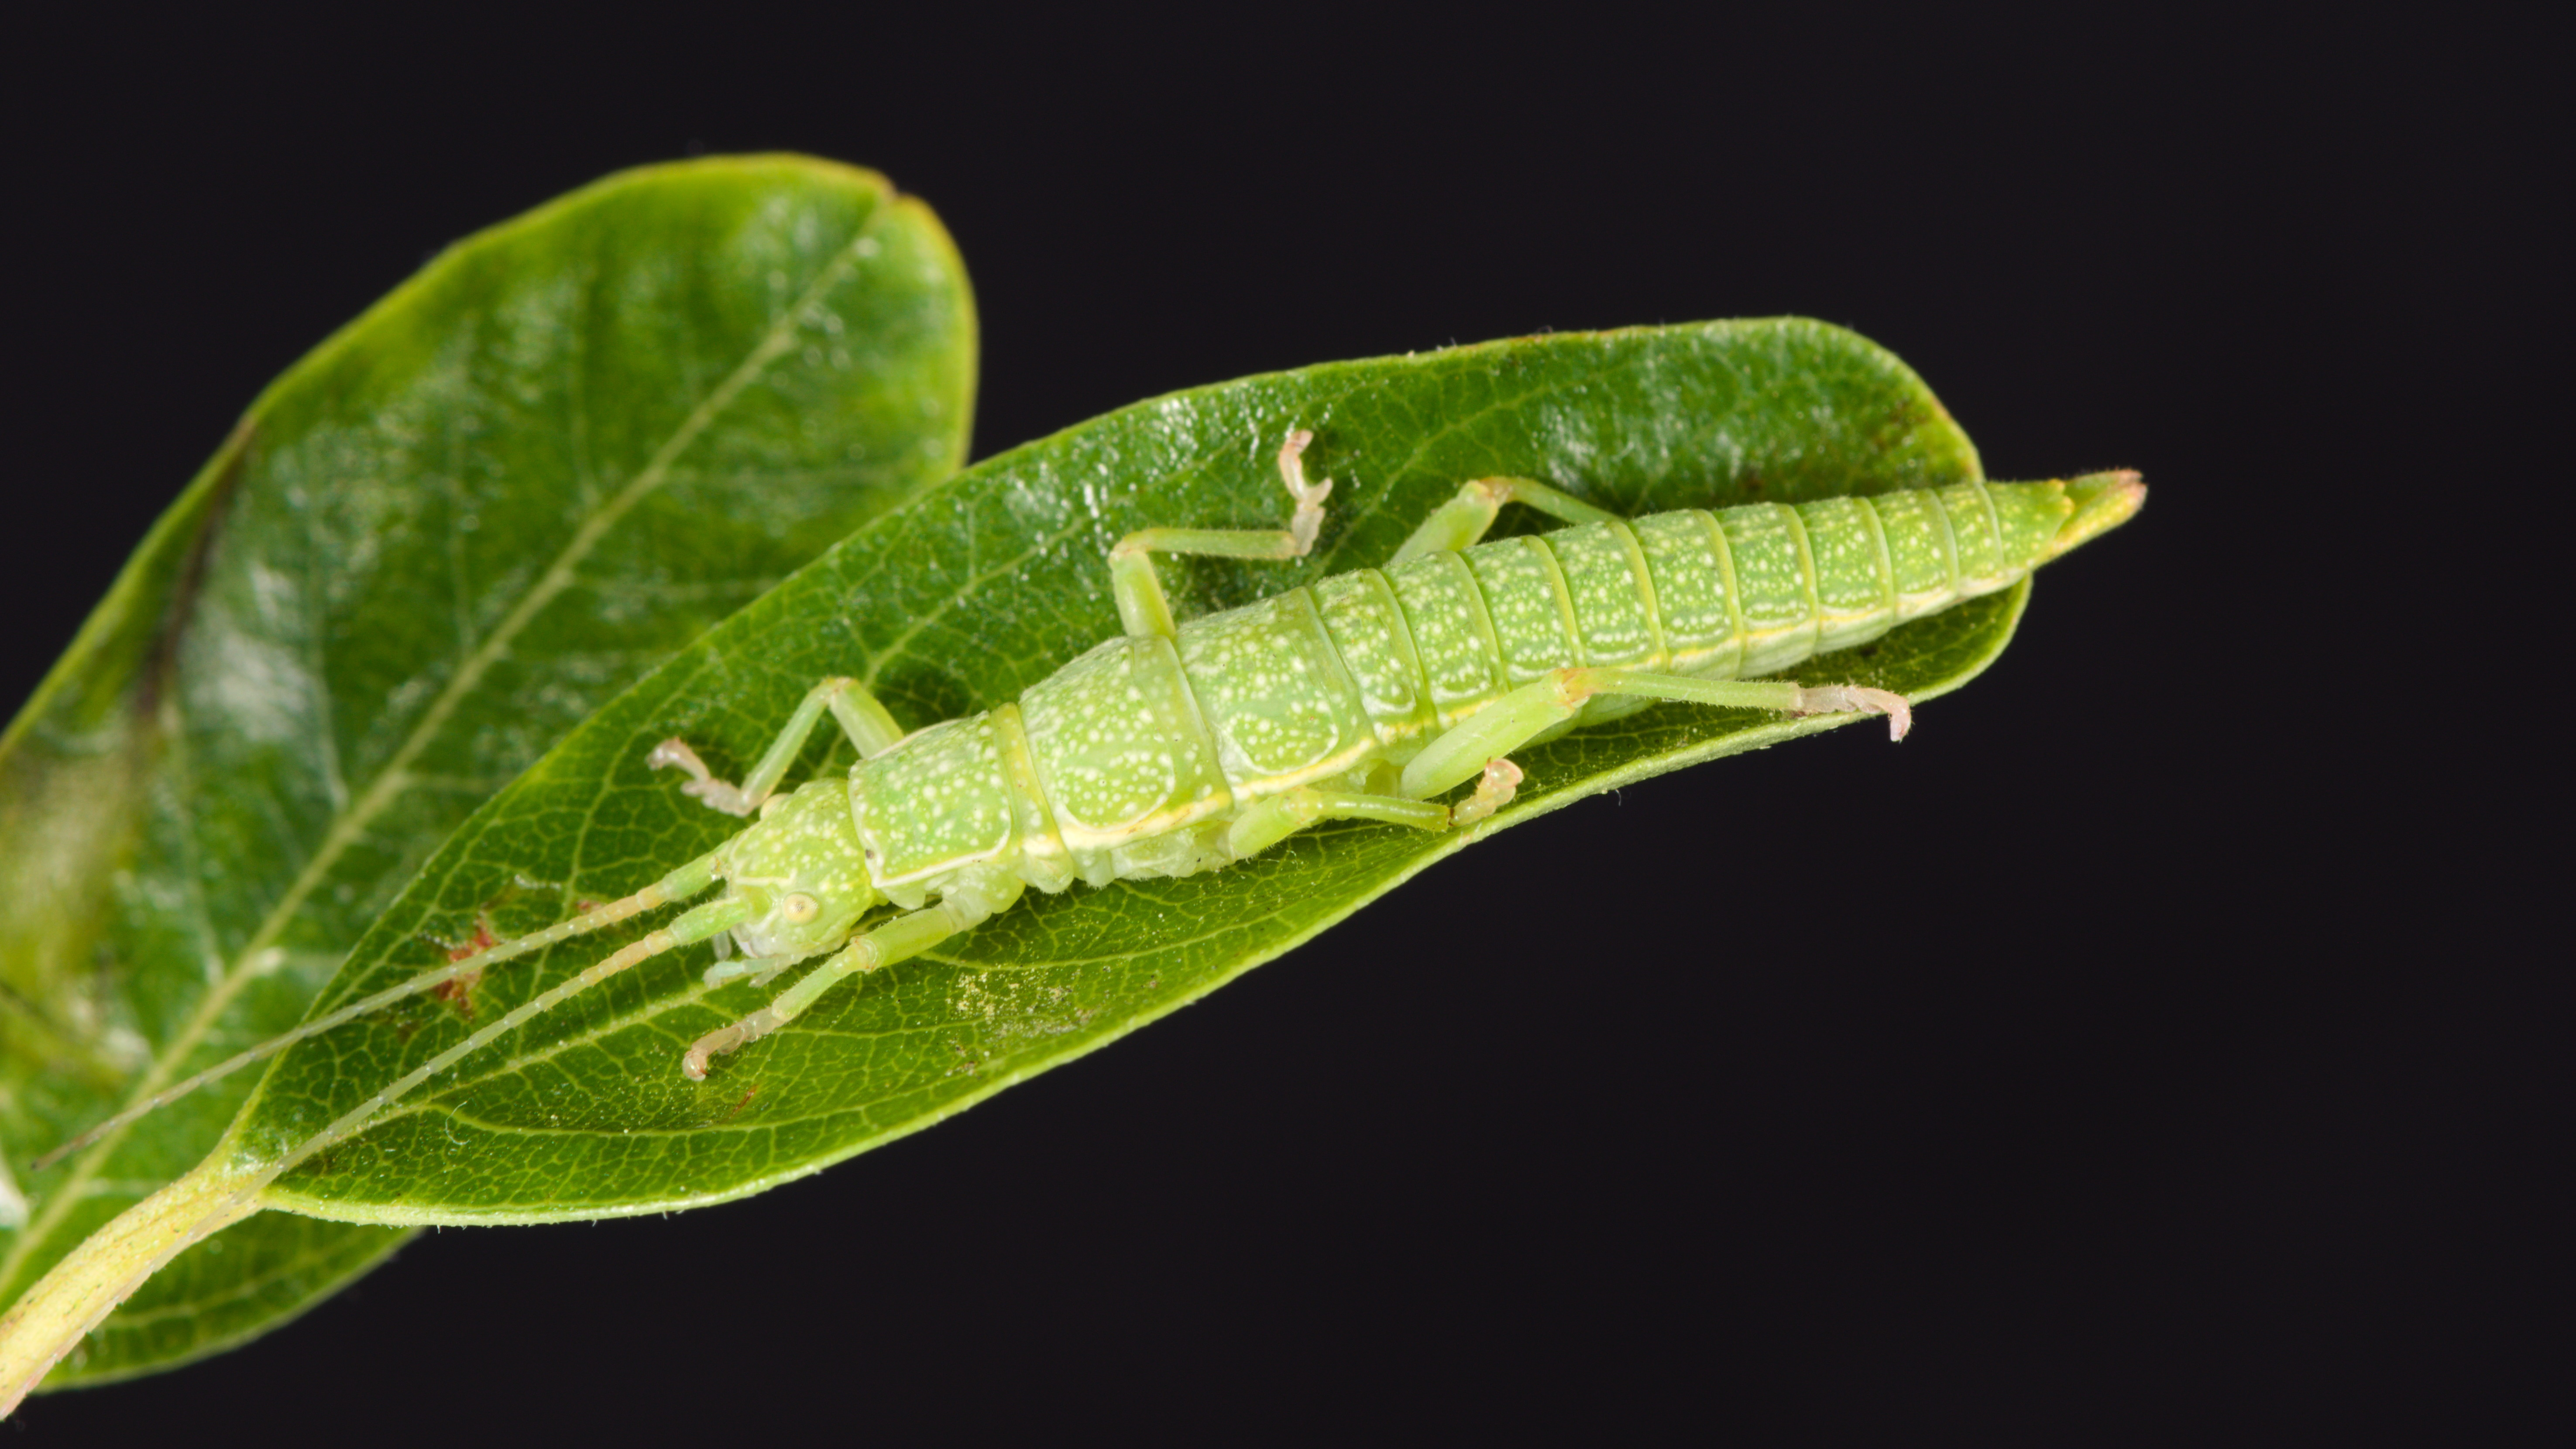
The Timema are closely associated with the host plants they are found on, where they feed, mate and spend all their lives. Their strategy to escape predation (at least from the visually oriented predators, like birds) is to resemble their hosts in colour. Thus, cryptic colouration is likely an important adaptive trait to them. This is well understood in T. cristinae, and in T. podura, whose green individuals match the leaves, and the brown ones match the stems of the host plants (Nosil and Crespi, 2006; Sandoval and Nosil, 2005). Our next challenge was to study how colour could be adaptive in T. chumash, a species with a wider colour palette, ranging from green to brown, with a series of other colours in between that we called ‘intermediate’ morphs.
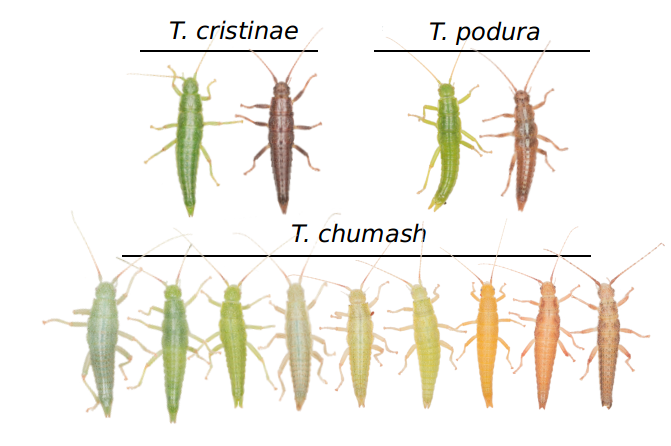
We found T. chumash matched the diversity of colours in their host plants (e.g. mountain mahogany and oak), and confirmed that colour was controlled by few recombining genes. In comparison, species with only green versus brown morphs (e.g. T. cristinae) mirrored their hosts’ discrete colours (i.e. leaves versus stem in Adenostoma and Ceanothus plants; Sandoval, 1994), and this variation was controlled by a large genomic region with suppressed recombination (i.e. ‘a candidate supergene’, Nosil et al. 2018). With that in hands, we came with the hypothesis that ecology could explain whether genes for cryptic colouration form a supergene or recombine, raising the prediction that different selective regimes were offered by those host plant species.
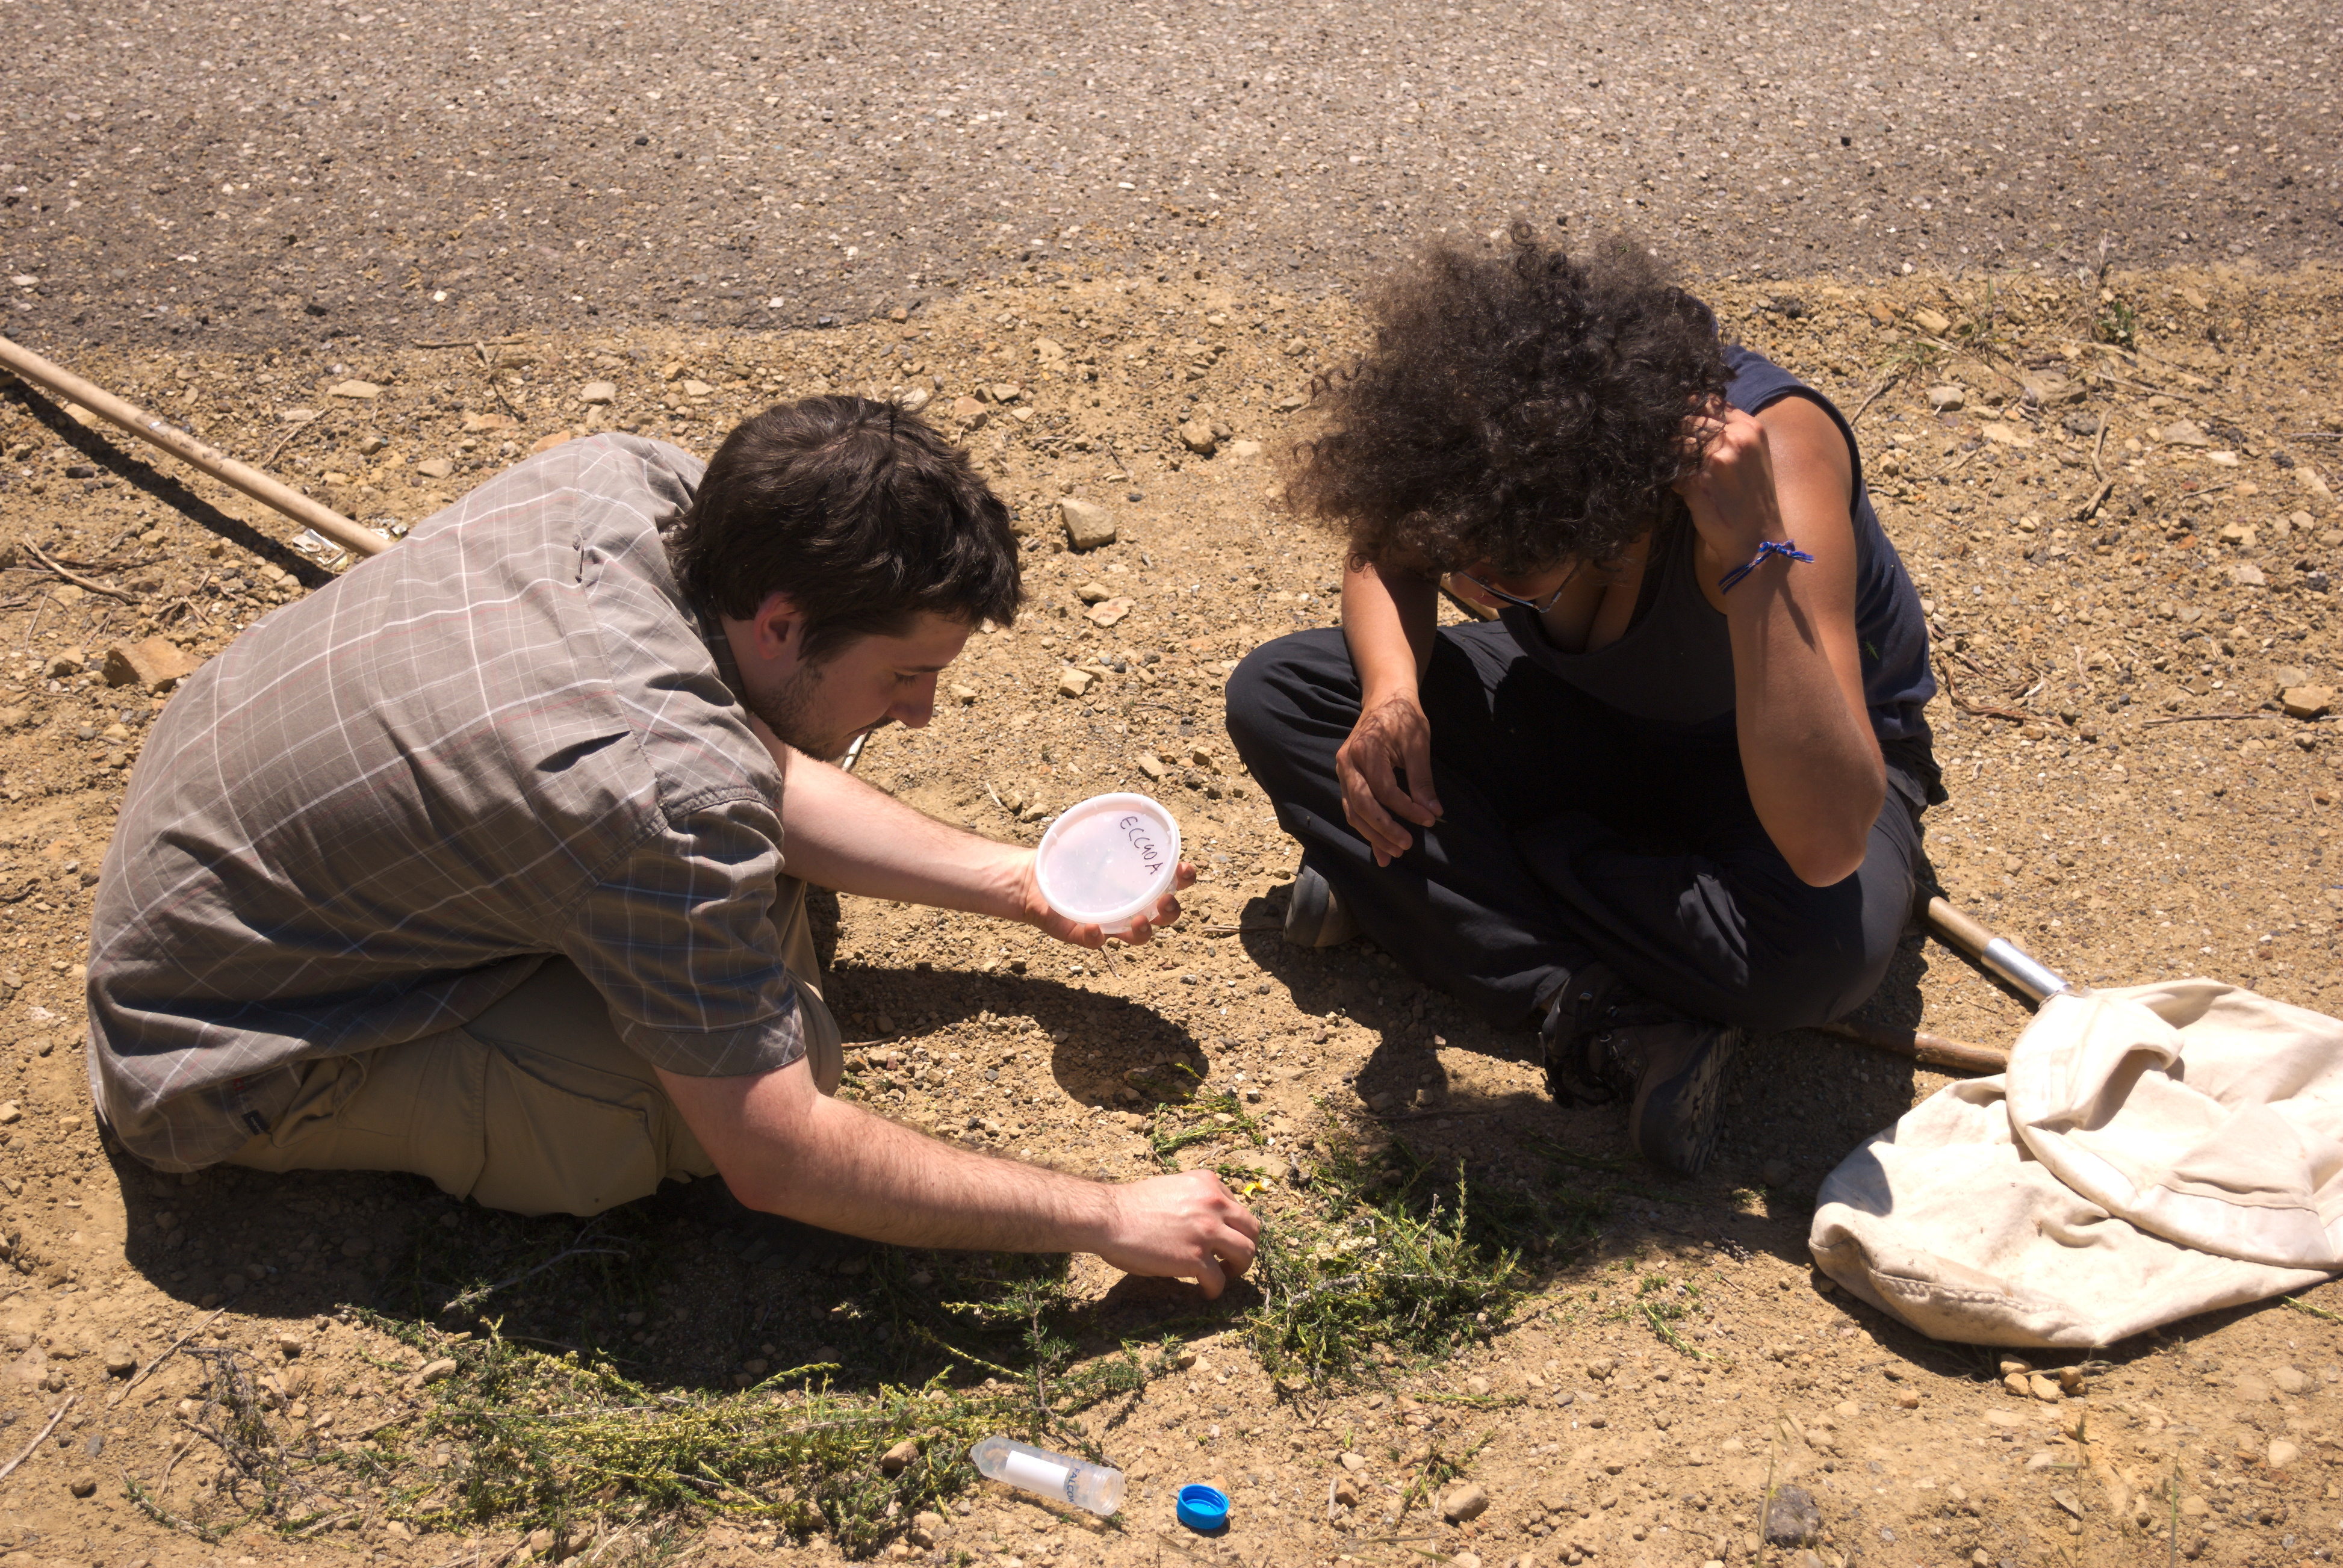
To test this, we designed a transplant experiment in the wild. We collected a great number of T. chumash individuals from mountain mahogany, and sorted the colour variation groups of green, brown, and intermediate individuals to be marked and released in bushes of mountain mahogany (control), and in intertwined bushes of Adenostoma/Ceanothus, where T. chumash is occasionally found. We left it aside for a few days while the birds did the job of selecting through variation. We expected to recapture individuals with a wide range of colours in the first case, and to recapture the green/brown extremes in the second (i.e. resultant from disruptive selection). Our predictions were met, as that was exactly what we found!
Despite our excitement, we had difficulties to publish the manuscript as it was. But, because we were convinced our story was very promising, we decided to strengthen the results by repeating the experiment. This time, we recorded the phenotype and saved tissue for DNA extraction, just so we would have the whole phenotype-genotype-fitness map of adaptation.
At some point, we sat down and agreed the data we had in hands was worth of two different manuscripts. In one, we could draw the focus to the genetic architecture of cryptic colouration in Timema (now published at Villoutreix et al., 2020), and in the other we could explore the thrilling results from the experiment. With the latter, Patrik saw the opportunity to investigate it through the lenses of adaptive landscapes (something he has long wanted to explore) and of epistasis. We already knew colour was controlled by multiple recombining genes, which allowed us to investigate whether there was a additive and/or epistatic effect in the phenotype (genotype-phenotype map). In addition, we had evidence for differential selection of phenotypes in the transplant experiment following the host plants transplant (phenotype-fitness map). Our last step was to integrate the genotype-phenotype-fitness map to estimate epistasic effects on fitness, and to infer the fitness landscape.
At the end of this journey, I learned not only to trust the data, that it can yield very interesting stories, but especially that having a clear core message is essential. That, of course, besides our very exciting findings and to be able to see evolution happening before my eyes.
This post was co-written by Clarissa F. de Carvalho and Romain Villoutreix (CNRS-Université de Montpellier). Poster image: T. petita resting on Ceanothus by Romain Villoutreix
Follow the Topic
-
Nature Ecology & Evolution
This journal is interested in the full spectrum of ecological and evolutionary biology, encompassing approaches at the molecular, organismal, population, community and ecosystem levels, as well as relevant parts of the social sciences.

Related Collections
With Collections, you can get published faster and increase your visibility.
Understanding species redistributions under global climate change
Publishing Model: Hybrid
Deadline: Dec 31, 2026


Please sign in or register for FREE
If you are a registered user on Research Communities by Springer Nature, please sign in