A ten-year journey to find enhanced woody biomass production in a mature temperate forest under elevated CO2
Published in Earth & Environment and Agricultural & Food Science
Late 20th-century experiments in growth chamber and young tree plantations found a ‘CO2 fertilization effect’ (i.e., increased growth with increasing CO2). Considerable uncertainty remained as to whether older, longer-established forests retained this capacity to respond to elevated CO2. In 2013, the opportunity arose to mount the major experimental effort required to test whether CO2 fertilization could be detected in long-established temperate deciduous forest.
By 2014, the initial $50M programme was in place and plans drawn up for a Free Air CO2 Enrichment (FACE) facility of the University of Birmingham’s Institute of Forest Research (BIFoR) to subject patches of old oak woodland to elevated CO2 for a decade (2017-2026, inclusive). BIFoR FACE has since grown to be a $75M programme, with elevated CO2 running to 2031. The years 2014-2017 were consumed with the design and build of BIFoR FACE, a process which came to a nerve-jangling climax with the installation of the support infrastructure by specialist helicopter (a short video of the construction is available at https://youtu.be/f2Su1W6Wtts).
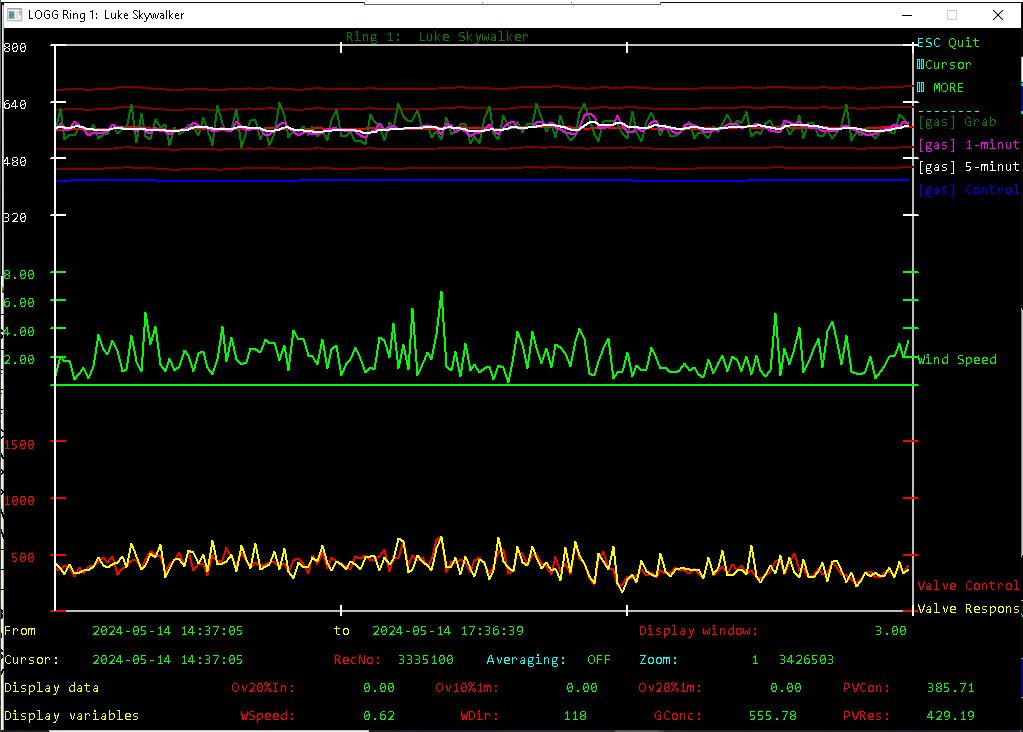
As the sun rose on 1st April 2017, the CO2 enrichment began, and it has continued in daylight hours in the April-November growing season ever since [Figure 1]. All that was left to do was wait…oh, yes, and measure every possible component of forest ecophysiology, and food web so that the response of the forest as a system could be investigated.

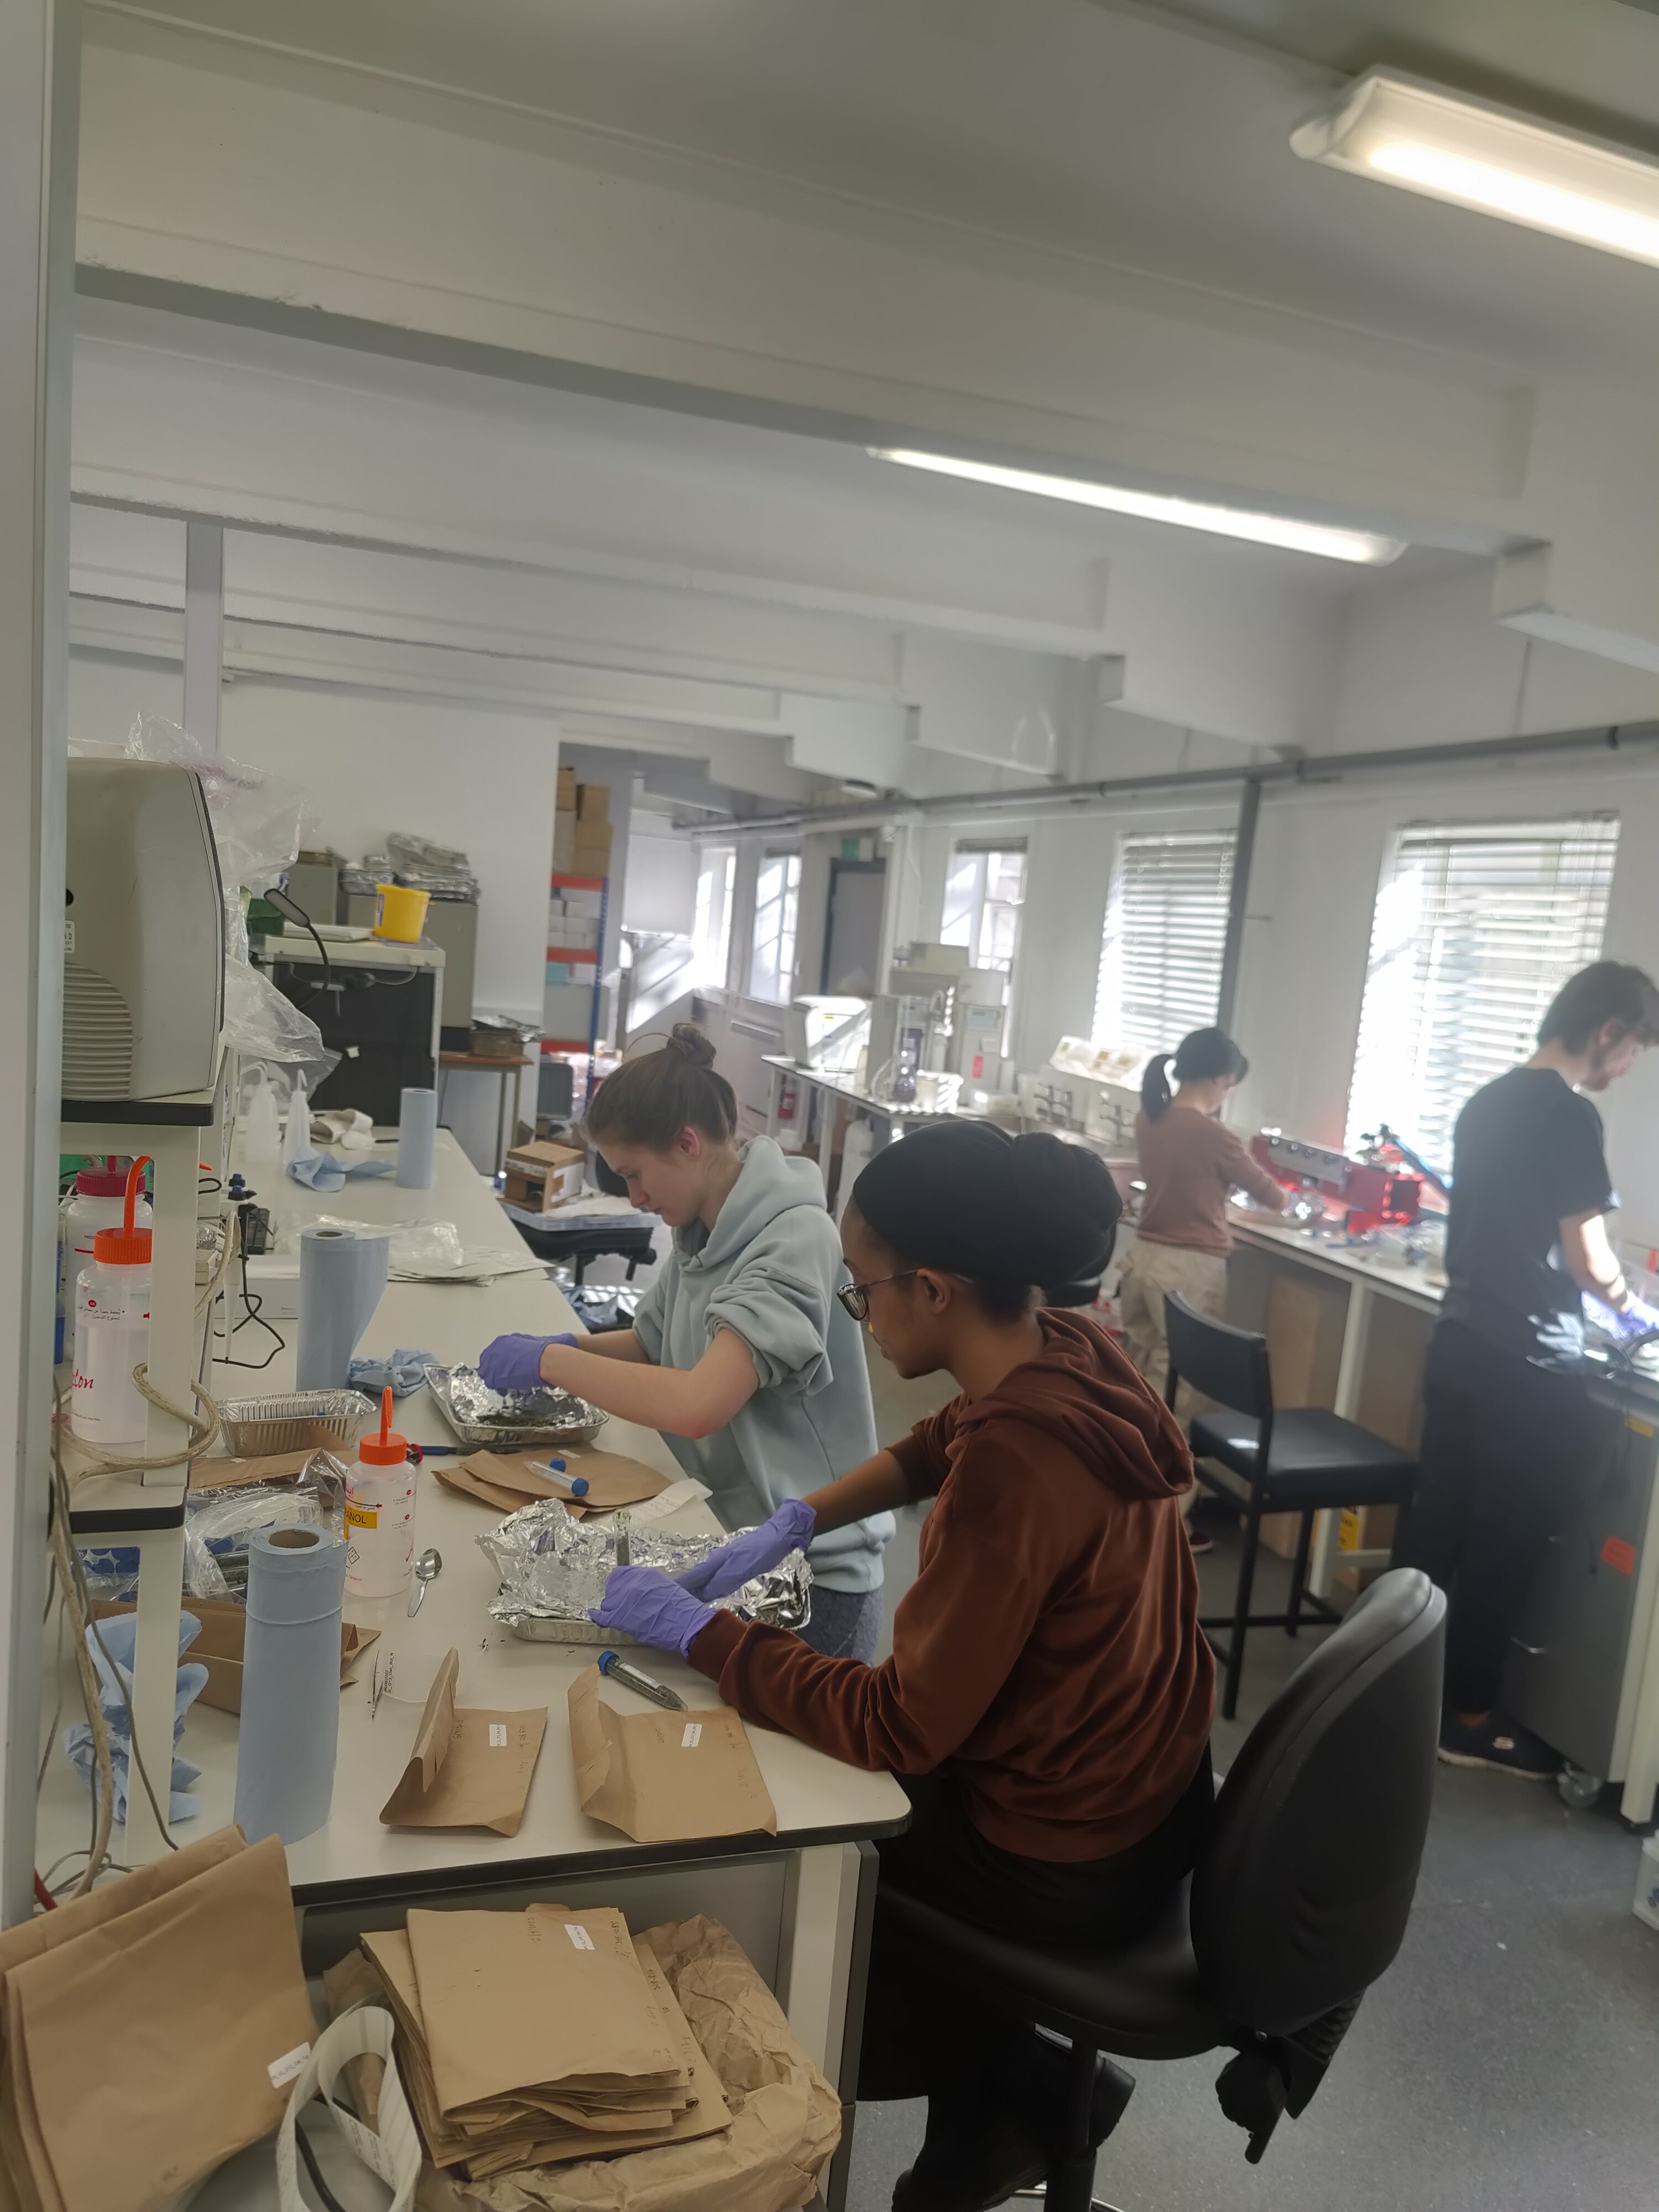
Measuring the elements of net primary productivity (NPP) is an arduous and time-consuming task, demanding great attention to detail and only made possible by the work of many hands: researchers, graduate students, technical staff, and volunteers. It is particularly pleasing to see the very significant contributions of five technical staff resulting in co-authorship — a welcome example of how criteria for authorship are changing for the better. [Figure 2]

Figure 2. Technical staff and undergraduate volunteers at work sorting and separating samples from intensive soil sampling at BIFoR FACE.
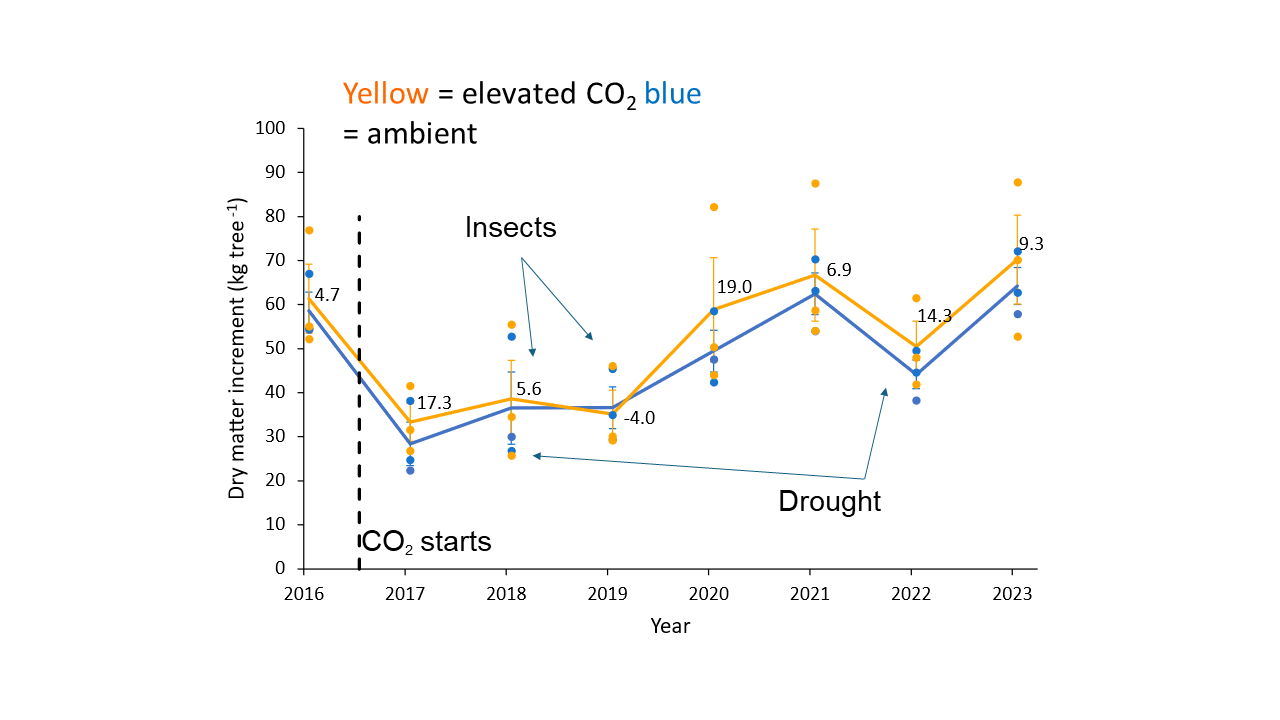
All ecosystem science takes time, and working with forest manipulation experiments is no exception. We knew we would have to wait to make sure that: (i) we were not observing transient effects of setting up the facility; and (ii) that we accounted for variability in the growing seasons (the UK site is at the end of the North Atlantic storm track and so subject to very changeable weather). Perhaps our ecological nous should have tempered our optimism bias, but what came as somewhat more of a surprise and added greatly to the variability (and, hence, the need to wait) were (iii) sub-decadal insect herbivory outbreaks, and (iv) greatly varying growth rates amongst the evenly-aged and closely related oaks in the woodland [Figure 3].

Figure 3. Dry matter increment for long-established oak forest under ambient conditions (blue) and elevated CO2 (orange). Annotation shows significant insect herbivory outbreaks and growing-season droughts. Adapted from Norby et al., 2024.
To account for the highly variable growth rates between individuals in the forest, we took stem cores so that we could measure relative growth rates (i.e. ring widths) for the period before the experiment began. Although working in long-established forest brought many difficulties, the ability to look back in time through stem coring (i.e., dendrochronology) gives the experiment a unique backwards-and-forwards in time perspective.
One final unexpected hurdle presented itself: our trees seemed not to be a standard ‘shape’. That is, the relationship between the stem diameter and the whole mass of wood in the tree seemed not to fit conventional relationships. The solution was to undertake a comprehensive laser scanning assessment of the forest (a short video showing an example of the laser scanning output is available at https://www.youtube.com/watch?v=-8h4PVEftig ). More measuring, more waiting.
By the end of the 2023 season, as described in the paper, sufficient evidence had accrued to see the patterns in spite of the interannual ‘noise’. Dry matter increment (DMI) per tree, as calculated from diameter and adjusted by pretreatment differences among plots, was greater in elevated CO2 than in ambient CO2 for every year of CO2 enrichment except 2019 (Figure 3); over the 7 years from 2017 to 2023, tree growth was on average 10% greater in elevated CO2. Adding in the other elements of total NPP, and looking over the two years for which all the elements of productivity were observed, NPP increased by just under 11%, equivalent to an extra ~1.7 tonnes of dry matter per hectare per year.
Of those non-woody elements of productivity, changes in root exudation are perhaps the most interesting, because such changes have important implications for the coupling of trees and the soil microbia — and so, between the cycling of carbon and soil-sourced nutrients. This coupling may release extra nutrients for the trees to use, hence enabling them to maintain a ‘balanced diet’ despite the extra sugar coming from enhanced photosynthesis under elevated CO2. Nutritional balance is obviously crucial for the long-term fitness of any living organism. Establishing whether such balance is being maintained is a crucial next step in our scientific investigations through to 2031. [Figure 4]

Follow the Topic
-
Nature Climate Change

A monthly journal dedicated to publishing the most significant and cutting-edge research on the nature, underlying causes or impacts of global climate change and its implications for the economy, policy and the world at large.


Please sign in or register for FREE
If you are a registered user on Research Communities by Springer Nature, please sign in