Flattening the load: from flocking birds to reducing peak energy demand in buildings.
Published in Earth & Environment, Electrical & Electronic Engineering, and Mathematics
Explore the Research
Optimising peak energy reduction in networks of buildings - Scientific Reports
Scientific Reports - Optimising peak energy reduction in networks of buildings
It was during a project meeting when we started musing about starling murmurations and buildings.
At the time we had been thinking about coordinating the electricity demand between buildings to avoid peak loads on the grid, caused by coincident spikes in demand. This is a particular problem when the loads become big enough to disrupt the operation of the power grid. If you have ever ridden an old bicycle which has a dynamo to power filament lights then you will remember the increase in effort when the lights are switched on. This same effect can cause slowing of generators, resulting in de-synchronisation and cascading network failures.
Up to that point we'd assumed that the coordination would have to be between large numbers of buildings with a lot of information exchange along the whole network. One of my colleagues, the project lead Sukumar, came up with the suggestion that instead of this large-scale cooperation, a simpler scheme might in fact work.
In the complex systems community there are some well known models of flocking birds (known as boids), where simulated starlings only interact with their nearest neighbours and with just a few simple local coordination rules to govern their flight paths. Despite this, surprisingly beautiful coordinated emergent behaviour matching that seen in nature is observed.
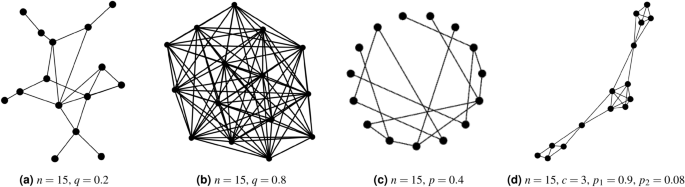
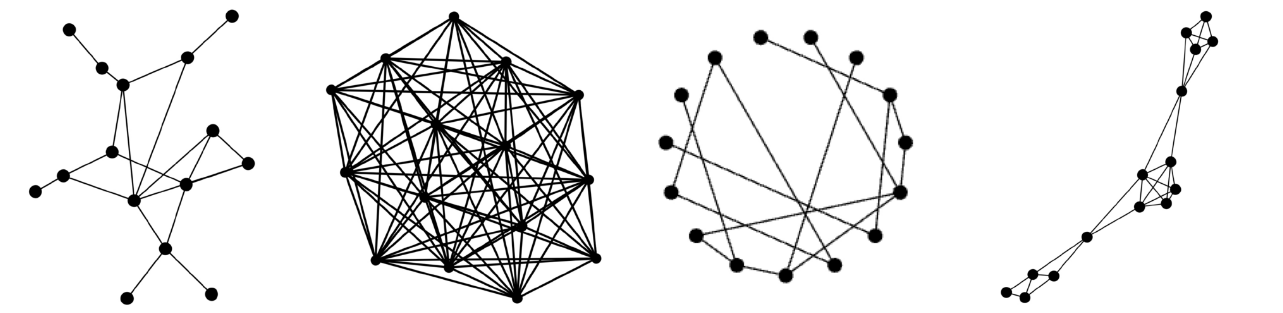
In our case this raised an interesting question about what the minimum level of coordination between buildings could be to have a significant effect on flattening the grid-level peaks that can prove so problematic. We focused on three aspects, which were investigated by our project Research Associate Anush Poghosyan using Agent Based Modelling as the computational framework. The first two of these are the network size and layout (or topology). Networks are a mathematical representation of the interactions between any set of individuals, represented as points, and lines between the points representing the connections or information exchange paths. The size of the networks can be described in terms of either the overall number of nodes or the number of connections between nodes or neighbourhoods of nodes. The topology describes the particular layout of points in relation to each other in this information space. Four of these are shown below, with examples of a random network, all-to-all, a Watts–Strogatz small world network with local connections and long-range short-cuts and a partition network that has both local group and more long range connections.
On top of this, each of the nodes representing houses has a set of rules, our third factor in this model. Our aim was to see which of these factors were important and also the simplest system that could have an effect on avoiding the dangerous peaks seen around the world.
An example of the model run without any connections or rules can be seen below, with clear peaks in the overall load of a group of 100 simulated buildings:
The minimum set of rules was surprisingly simple:
- each dwelling shares its current energy load with the others to which it is connected, who only see the total load of their connected neighbourhood, not (potentially private) individual loads;
- each dwelling knows what load(s) it intends to initiate at that time, and has a limit to the amount that each can be delayed to the future;
- if the current neighbourhood load is above a predefined threshold a node can (randomly) delay a load, up to a maximum fraction of the excess load (labelled α) and within the maximum allowed delay.
- If the total load is below the desired system load it can draw from this queue of delayed loads, again within the limit set by the parameter α.
An example of implementing these rules for a large random network, with each node having four neighbours is shown below:
The flattening effect can be seen clearly. The surprising (yet pleasing) thing here was the amount of flattening for a such a small number of connections. This very much agrees with the models of starlings shown previously, and validates the simple approach taken. Another surprising result was that the network topology was not found to be very important at all, greatly simplifying the real-world implementation of such a scheme for any network operator.
The summary of our results can be seen in the (rather technical) graph below, comparing different network topologies and node degrees (the average number of connections to other individuals) across a range of the gap-filling parameter α. The RMSE on the vertical axis is the Root Mean Squared Error, a measure of the difference between the "flattened" load and the uncoordinated "peaky" load, with smaller numbers representing flatter, less peaky load profiles.
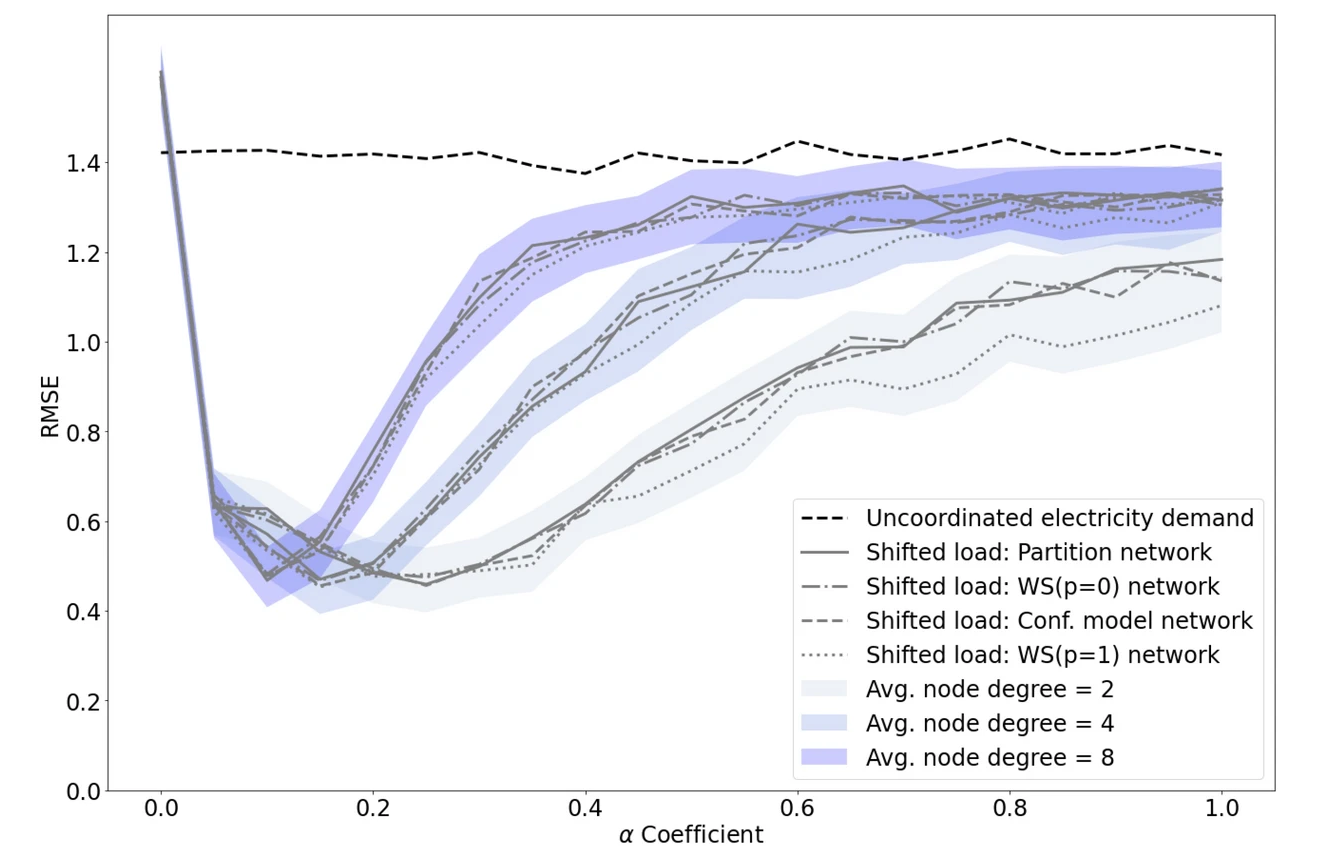
The small value of α (around 0.2) that gives the minimum peaky load is a result of the fact that allowing large shifts can result in the unintended consequence of everyone shifting everything at the same time, creating a worse problem than to begin with. Hence more frequent, smaller shifts are better.
The simplicity of the rules, small number of interactions and low amounts of information exchanges needed for a very effective load flattening makes this a very interesting model for future smart grids and even virtual networks. Due to the small number of buildings, the scheme can be scaled to any size network, without any increase in complexity or infrastructure costs. Additionally, there is nothing in this scheme that relies on a physical connection between the buildings, only that they share minimal information on their aggregated load and preferably that they are being supplied by the same substation.
The full publication can be accessed open access in Nature Scientific Reports, here.
More about the project that led to this work can also be seen here:
Follow the Topic
-
Scientific Reports
An open access journal publishing original research from across all areas of the natural sciences, psychology, medicine and engineering.

Related Collections
With Collections, you can get published faster and increase your visibility.
Infectious disease diagnostics
Publishing Model: Open Access
Deadline: Sep 23, 2026
AI in Education
Publishing Model: Open Access
Deadline: Oct 09, 2026


Please sign in or register for FREE
If you are a registered user on Research Communities by Springer Nature, please sign in