Imaging glioma metabolism
Published in Chemistry and Biomedical Research
The challenge in oncology is to match the drug to the patient. There may be several different subtypes of a tumour, which will respond differently to treatment. One approach to treatment selection is to use tumour or liquid biopsies to survey the genomic landscape of the tumour, which may then indicate which drug or treatment may be most effective. A complementary approach is to determine the specific tumour phenotype. For example, studies in several tumour types, including glioblastoma, have identified metabolic subtypes, where an oxidative subtype is more sensitive to treatment1. We have been developing MRI techniques for imaging metabolism with hyperpolarized 13C-labelled and 2H-labelled substrates and have used them to both detect the metabolic subtypes present within a particular tumour, and therefore to predict their potential therapeutic vulnerabilities, and subsequently to detect their very early responses to such treatment.
Preclinical MRI studies with hyperpolarized 13C-labelled pyruvate and 2H-labelled glucose showed that we could detect glycolytic and oxidative subtypes in orthotopically implanted patient derived glioblastoma xenografts in mice and rats2,3. Hyperpolarization is a technique that has translated to the clinic and can increase the sensitivity of the 13C MRI experiment by more than 10,000x4,5. This means that following the injection of hyperpolarized [1-13C]pyruvate we have sufficient sensitivity to image its location in the body and, more importantly, its conversion into lactate, which provides an index of glycolytic activity. In the case of [6,6-2H2]glucose, rapid signal averaging in a 2H MRI experiment gives us sufficient sensitivity to image the production of labelled lactate and glutamate/glutamine (Glx) from the labelled glucose. The rate of production of labelled lactate provides a measure of glycolytic flux and the production of labelled Glx provides a measure of flux into the TCA cycle. This MRI technique has also translated to the clinic6. Previous work of others using a transcriptomic analysis showed that these metabolic subtypes could co-exist within an individual patient’s tumour1. We had also showed, as expected from the work of others, that the oxidative subtype was more sensitive to radiotherapy, both as cells in vitro2 and as a tumour in vivo7. A pilot study in glioblastoma patients with hyperpolarized 13C-labelled pyruvate showed that some patient’s tumours were more glycolytic and others more oxidative, consistent with the transcriptomic analyses8.
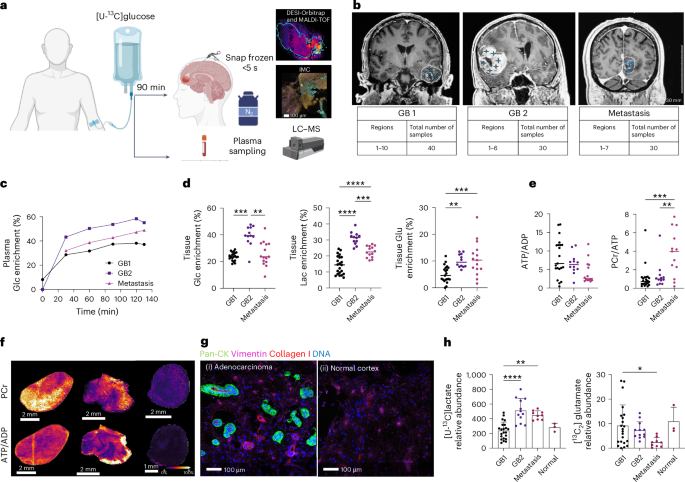
In this study we sought evidence for the presence of glycolytic and oxidative metabolic subtypes in the tumours of glioblastoma patients by infusing the patients with 13C-labelled glucose immediately prior to surgery and then rapidly freezing the excised tumour and subjecting tumour sections to mass spectrometry imaging. This provided, at ~60 μm resolution, the concentrations of numerous metabolites and their degree of 13C-labelling. The preservation of ATP and phosphocreatine concentrations in these sections showing that the freezing protocol had been very effective at arresting metabolism and therefore that the degree of 13C-labelling provided a measure of metabolic flux. 13C-labelling in pyruvate and lactate was used to assess glycolytic activity and labelling of TCA cycle intermediates (fumarate, succinate, malate) mitochondrial oxidative activity. Labelling of glutamate and glutamine provided an indirect measure of TCA cycle activity. The images could be segmented into three regions; regions showing high labelling of pyruvate and lactate (representing a glycolytic subtype), regions showing high labelling of TCA cycle intermediates and Glx (oxidative subtype) and regions showing low labelling of both lactate/pyruvate and TCA cycle intermediates/Glx (Figure 1). Spatial transcriptomic analysis of contiguous sections showed good agreement, with the glycolytic regions showing high expression of glycolytic enzymes and the oxidative regions high expression of mitochondrial components. The areas occupied by these metabolic subtypes were sufficiently large that potentially they could be detected using 13C MRI with hyperpolarized 13C-labelled pyruvate and 2H MRI with 2H-labelled glucose.
.tif.jpg)
Figure 1. Segmentation of the mass spectrometry images according to lactate and glutamate labelling showed three distinct regions. A glycolytic region with relatively high labelling of lactate and pyruvate, an oxidative region, with high labelling of TCA cycle intermediates, and a region with low labelling of all these metabolites. These regions were spatially extensive (note the 1 cm scale bar) and abutted one another with distinct margins. Individual patient tumours showed different proportions of these metabolic subtypes.
A remarkable finding was that the presence of these metabolic subtypes in distinct regions appeared to be independent of the tumour microenvironment (vascularisation, hypoxia status, immune cell infiltration), as assessed my immunohistochemical and spatial transcriptomic analysis of the contiguous sections. A finding that was supported by the observation that these metabolic subtypes were preserved in vitro, when the isolated tumours cells were grown as neurospheres, and when the cells were implanted in rat brain to form orthotopic tumours. These metabolic subtypes appear therefore to be robust cell-intrinsic metabolic phenotypes that potentially could be imaged in patients using MRI-based metabolic imaging techniques, which could then be used to guide subsequent treatment.
References
1 Garofano, L. et al. Pathway-based classification of glioblastoma uncovers a mitochondrial subtype with therapeutic vulnerabilities. Nat Cancer 2, 141-156, doi:10.1038/s43018-020-00159-4 (2021).
2 Mair, R. et al. Metabolic Imaging Detects Low Levels of Glycolytic Activity That Vary with Levels of c-Myc Expression in Patient-Derived Xenograft Models of Glioblastoma. Cancer Res 78, 5408-5418, doi:10.1158/0008-5472.Can-18-0759 (2018).
3 Low, J. C. M. et al. Deuterium metabolic imaging differentiates glioblastoma metabolic subtypes and detects early response to chemoradiotherapy. Cancer Research, doi:10.1158/0008-5472.Can-23-2552 (2024).
4 Ardenkjær-Larsen, J. H. et al. Increase in signal-to-noise ratio of > 10,000 times in liquid-state NMR. Proceedings of the National Academy of Sciences 100, 10158-10163, doi:doi:10.1073/pnas.1733835100 (2003).
5 Nelson, S. J. et al. Metabolic imaging of patients with prostate cancer using hyperpolarized [1-¹³C]pyruvate. Sci Transl Med 5, 198ra108, doi:10.1126/scitranslmed.3006070 (2013).
6 De Feyter, H. M. et al. Deuterium metabolic imaging (DMI) for MRI-based 3D mapping of metabolism in vivo. Sci Adv 4, eaat7314, doi:10.1126/sciadv.aat7314 (2018).
7 Hesse, F. et al. Imaging Glioblastoma Response to Radiotherapy Using 2H Magnetic Resonance Spectroscopy Measurements of Fumarate Metabolism. Cancer Res 82, 3622-3633, doi:10.1158/0008-5472.Can-22-0101 (2022).
8 Zaccagna, F. et al. Imaging Glioblastoma Metabolism by Using Hyperpolarized [1-(13)C]Pyruvate Demonstrates Heterogeneity in Lactate Labeling: A Proof of Principle Study. Radiol Imaging Cancer 4, e210076, doi:10.1148/rycan.210076 (2022).
Follow the Topic
-
Nature Metabolism
This journal publishes work from across all fields of metabolism research that significantly advances our understanding of metabolic and homeostatic processes in a cellular or broader physiological context, from fundamental cell biology to basic biomedical and translational research.

Related Collections
With Collections, you can get published faster and increase your visibility.
The expanding therapeutic landscape of GLP 1 receptor agonists
Publishing Model: Hybrid
Deadline: Jan 23, 2027
Microbiome and energy metabolism
Publishing Model: Hybrid
Deadline: Dec 06, 2026

Please sign in or register for FREE
If you are a registered user on Research Communities by Springer Nature, please sign in